| Download | Discussion | Bugs/Issues | Documentation |
|---|---|---|---|
 |
 |
 |
 |
| Download the Latest Version | Join/Read the Community Discussion | Raise an Issue about a Problem | Get Help about Usage |
Screenipy is an advanced stock screener to find potential breakout stocks from NSE and tell it's possible breakout values. It also helps to find the stocks which are consolidating and may breakout, or the particular chart patterns that you're looking specifically to make your decisions. Screenipy is totally customizable and it can screen stocks with the settings that you have provided.
- Download the suitable file according to your OS.
- Linux & Mac users should make sure that the
screenipy.bin or screenipy.runis havingexecutepermission. - Run the file. Following window will appear after a brief delay.
- Configure the parameters as per your requirement using
Option > 8.
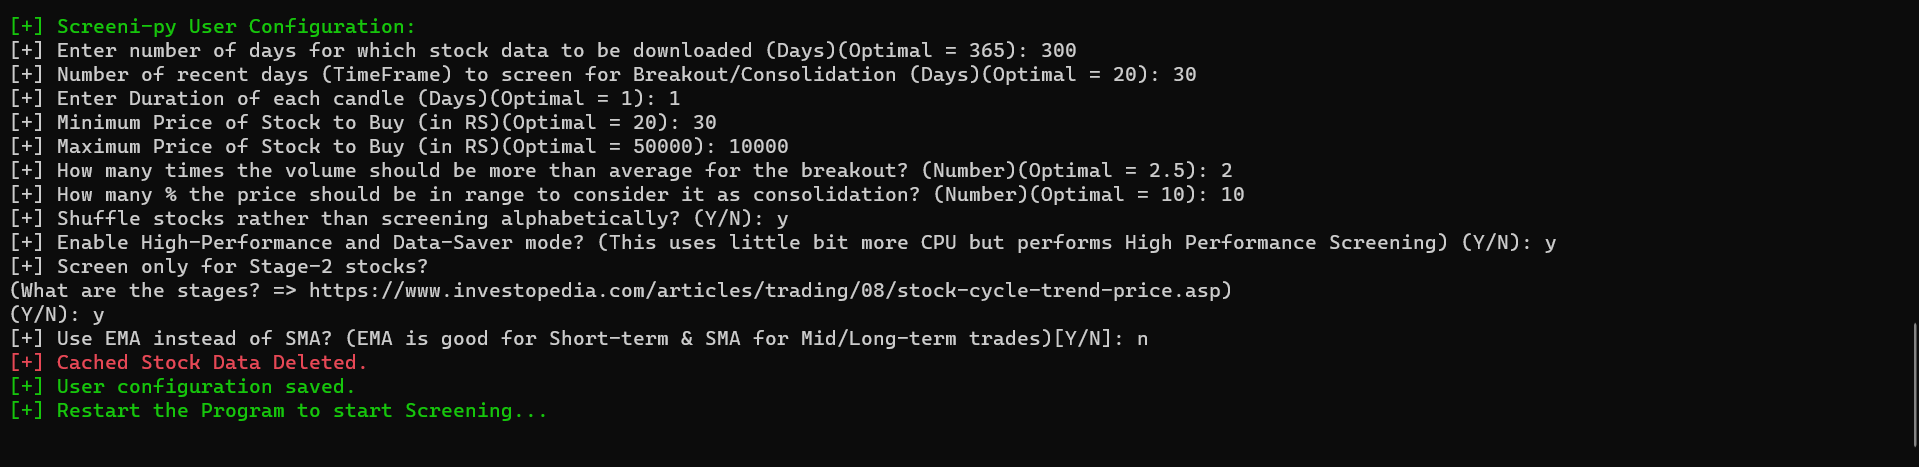
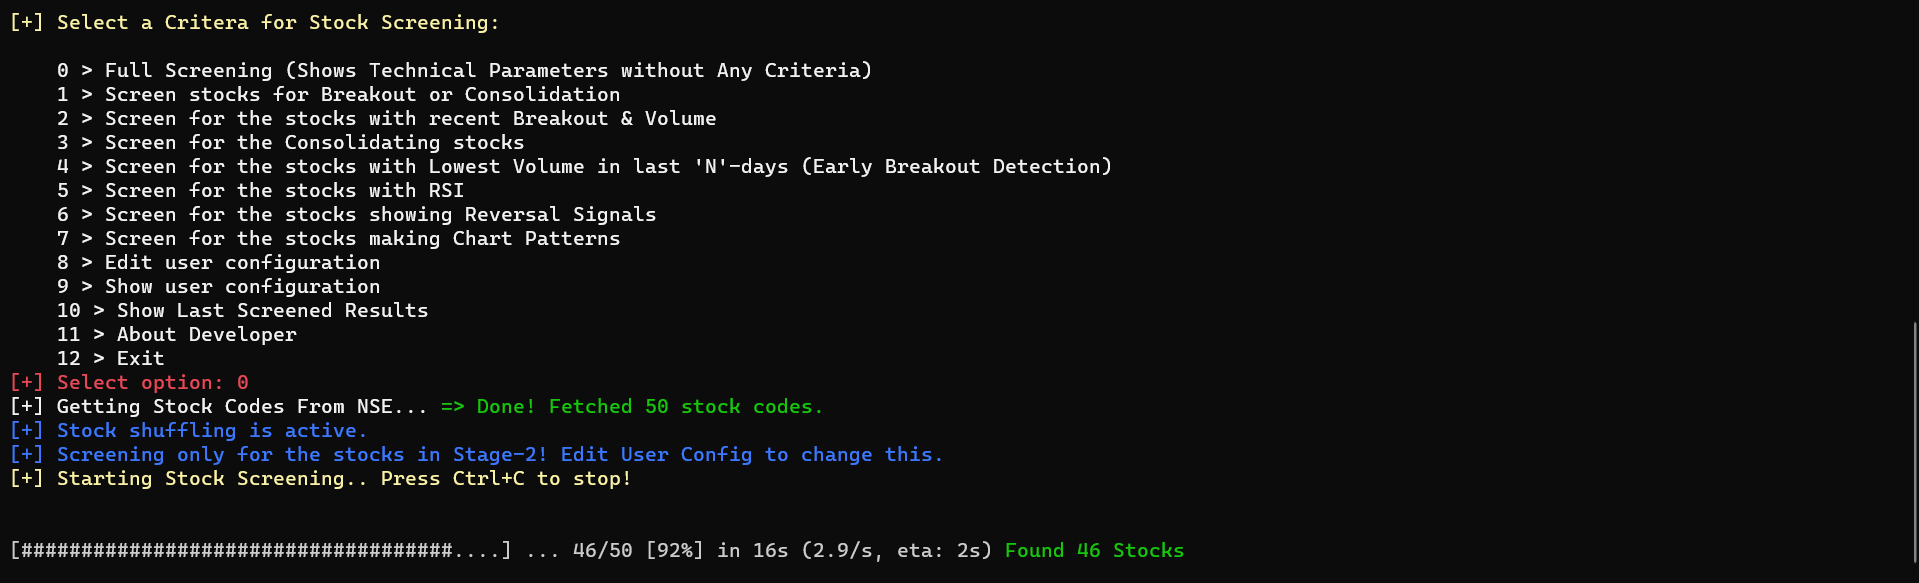
- Following are the screenshots of screening and output results.
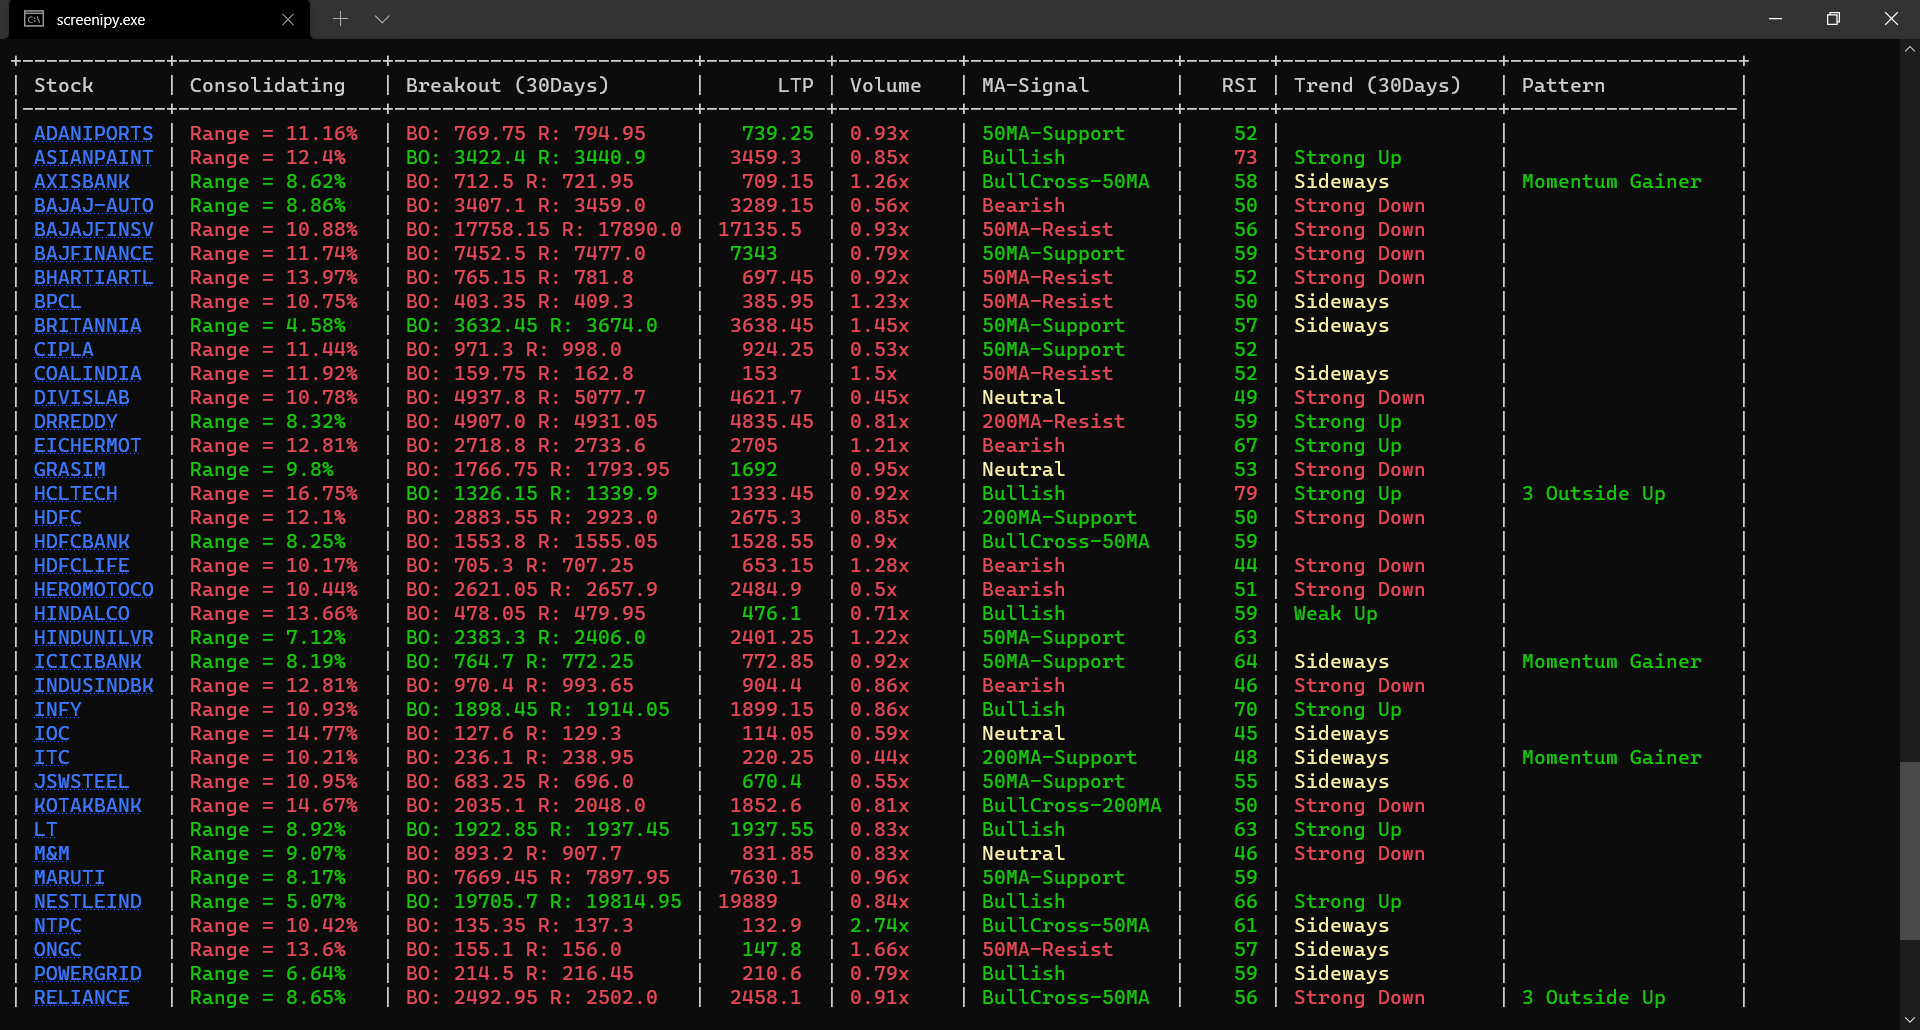
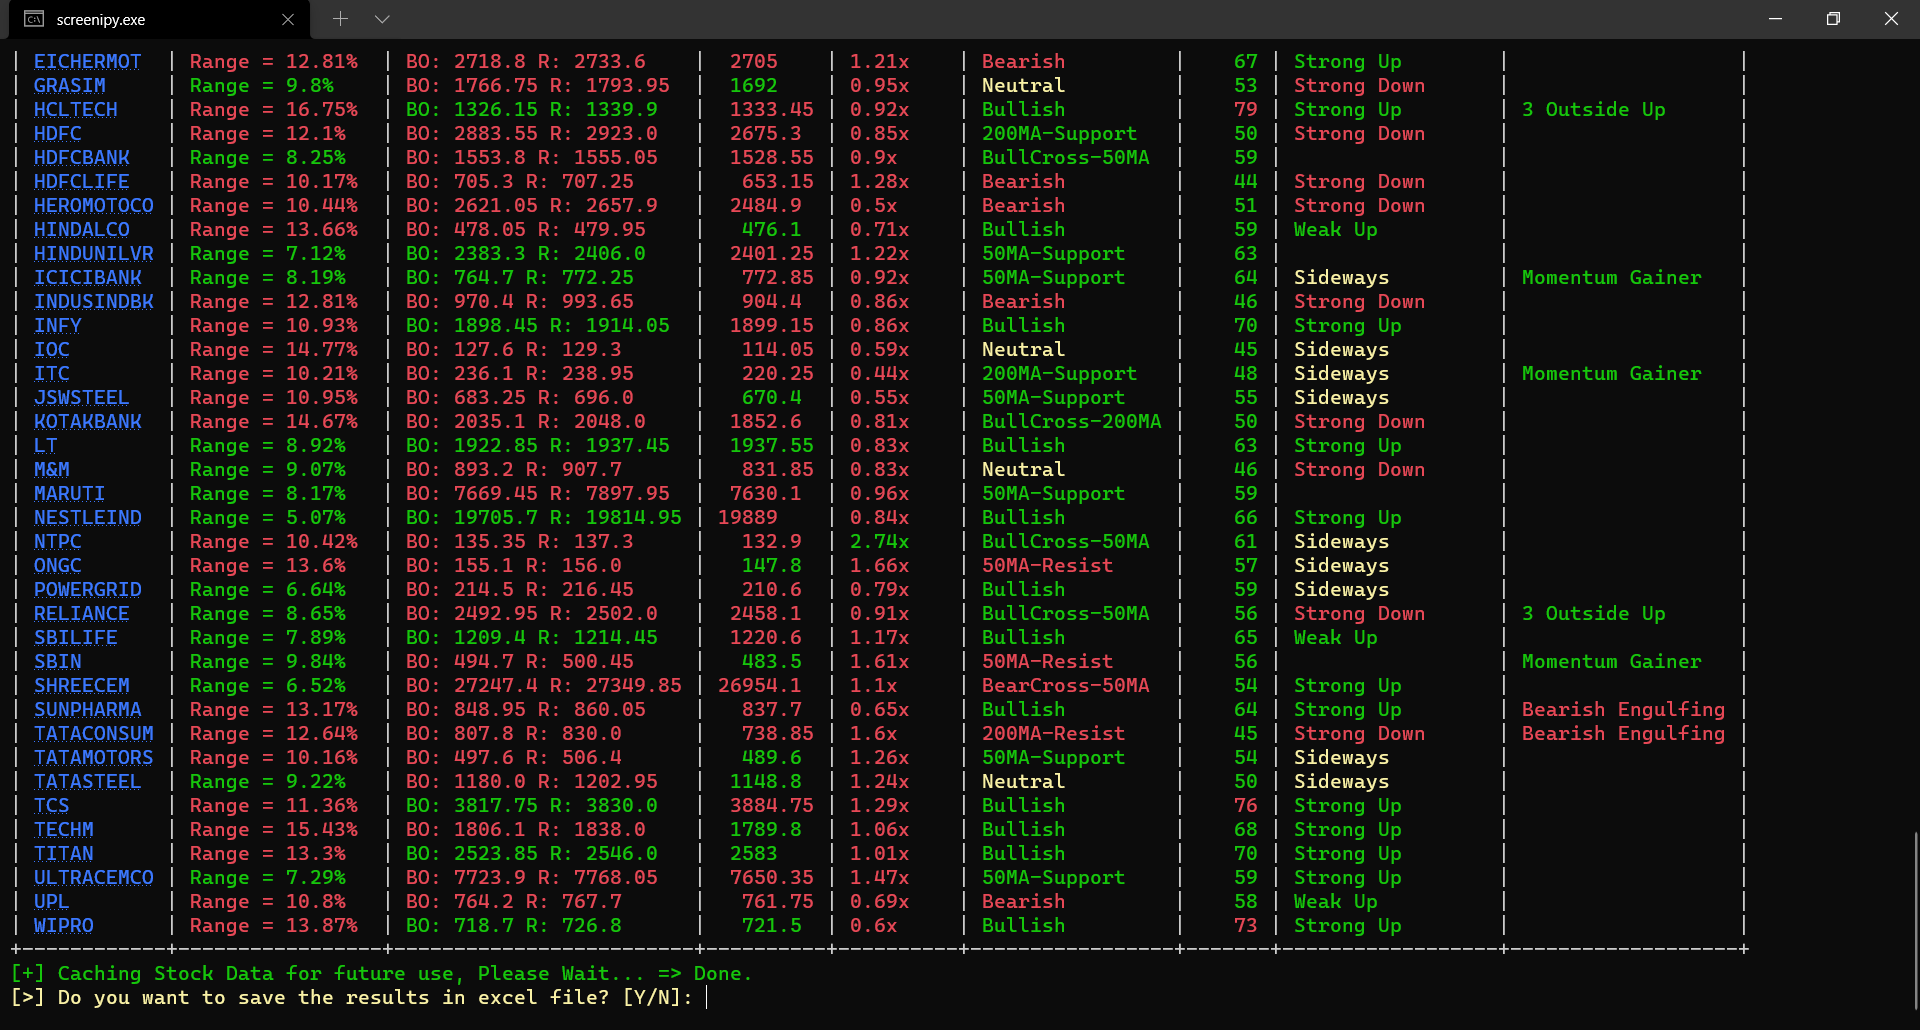
- Once done, you can also save the results in an excel file.
The Result table contains a lot of different parameters which can be pretty overwhelming to the new users, so here's the description and significance of each parameter.
| Sr | Parameter | Description | Example |
|---|---|---|---|
| 1 | Stock | This is a NSE scrip symbol. If your OS/Terminal supports unicode, You can directly open TradingView charts by pressing Ctrl+Click on the stock name. |
TATAMOTORS |
| 2 | Consolidating | It gives the price range in which stock is trading since last N days. N is configurable and can be modified by executing Edit User Configuration option. |
If stock is trading between price 100-120 in last 30 days, Output will be Range = 20.0 % |
| 3 | Breakout (N Days) | This is pure magic! The BO is Breakout level in last N days while R is the next resistance level if available. Investor should consider both BO & R level to decide entry/exits in their trades. |
B:302, R:313(Breakout level is 100 & Next resistance is 102) |
| 4 | LTP | LTP is the Last Traded Price of an asset traded on NSE. | 298.7 (Stock is trading at this price) |
| 5 | Volume | Volume shows the relative volume of the recent candle with respect to 20 period MA of Volume. It could be Unknown for newly listed stocks. |
if 20MA(Volume) is 1M and todays Volume is 2.8M, then Volume = 2.8x |
| 6 | MA-Signal | It describes the price trend of an asset by analysing various 50-200 MA/EMA crossover strategies. | 200MA-Support,BullCross-50MA etc |
| 7 | RSI | For the momentum traders, it describes 14-period RSI for quick decision making about their trading plans | 0 to 100 |
| 8 | Trend | By using advance algorithms, the average trendlines are computed for N days and their strenght is displayed depending on steepness of trendlines. (This does NOT show any trendline on chart, it is calculated internally) |
Strong Up, Weak Down etc. |
| 9 | Pattern | If the chart or the candle itself forming any important pattern in the recent timeframe or as per the selected screening option, various important patterns will be indicated here. | Momentum Gainer, Inside Bar (N),Bullish Engulfing etc. |
Feel free to Edit the parameters in the screenipy.ini file which will be generated by the application.
[config]
period = 300d
daystolookback = 30
duration = 1d
minprice = 30
maxprice = 10000
volumeratio = 2
consolidationpercentage = 10
shuffle = y
cachestockdata = y
onlystagetwostocks = y
useema = n
Try to tweak this parameters as per your trading styles. For example, If you're comfortable with weekly charts, make duration=5d and so on.
- Please feel free to Suggest improvements bugs by creating an issue.
- Please follow the Guidelines for Contributing while making a Pull Request.
- DO NOT use the result provided by the software 'solely' to make your trading decisions.
- Always backtest and analyze the stocks manually before you trade.
- The Author and the software will not be held liable for your losses.


![github-actions[bot] avatar](https://avatars.githubusercontent.com/in/15368?v=4 "github-actions[bot]")
