Code Monkey home page Code Monkey logo

v-chart-plugin's Introduction


A plugin for adding charts to Vue

version version

Table of Contents

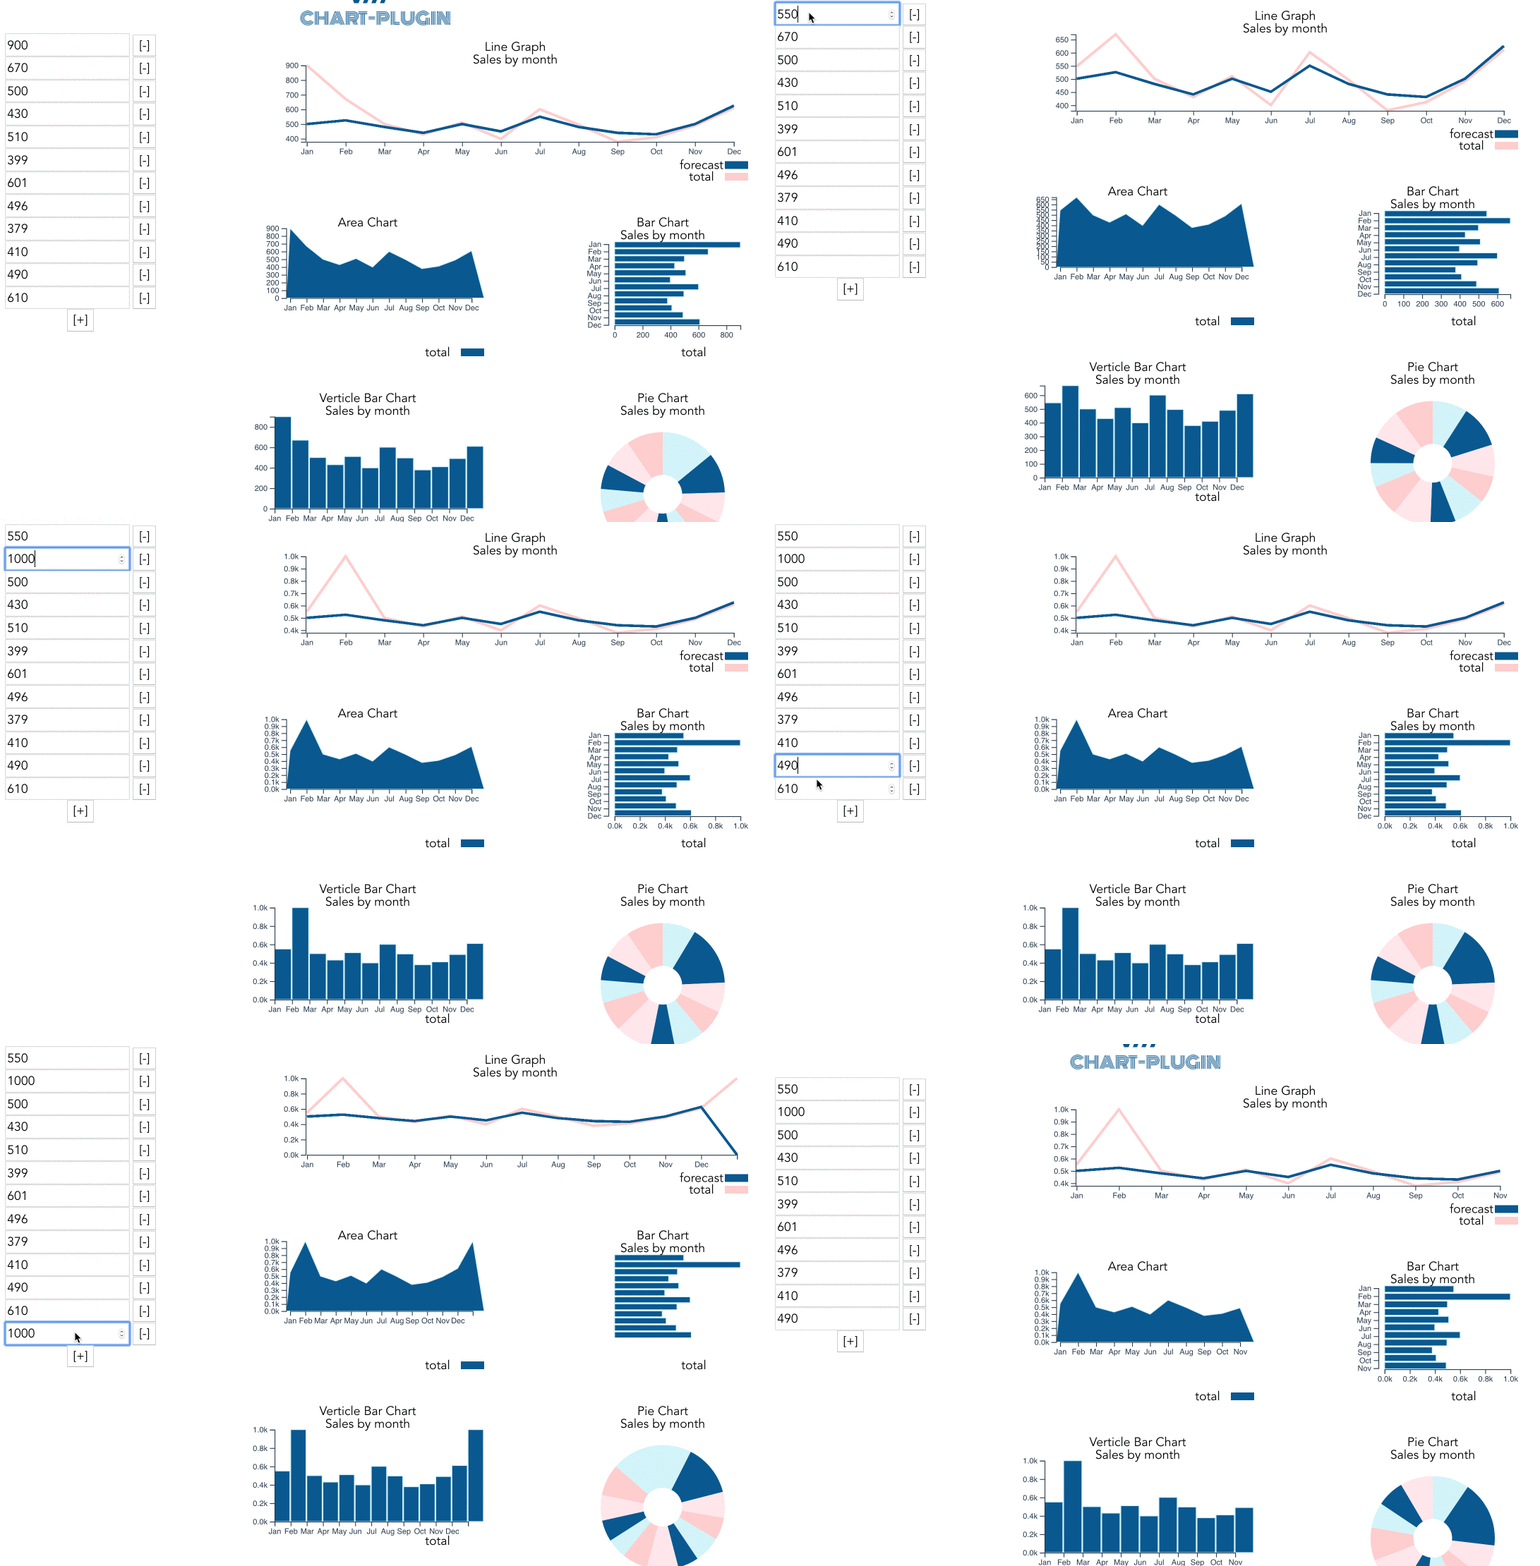
Screenshot

Purpose

This plugin is designed to allow Vue.js developers to incorporate fully reactive and customizable charts into their applications. The plugin is built off of the D3.js JavaScript library for manipulating documents based on data. By binding data from your components, you can create complex charts and graphs that respond to changes in your application. Vue.js lifecycle events will trigger the charts to update and maintain two-way binding between your charts and your data. By adding in a state management (such as Vuex) you can additionally persist state across an entire application.

V Chart Plugin is built using Vue.js' component architecture. This will allow the chart to be a first class citizen of your Vue.js application. Combining multiple charts allows you to create complex dashboards and enable deeper insights into your data. All aspects of the charts can be configured to allow for full customization of your graphs along with the ability to style the SVG elements using the classes and IDs generated for each individual canvas element.

By adding additional charts into the import folder and importing them into the v-chart-plugin.js you can include any custom charts to use with Vue.js. Using the JavaScript API you can hook into the specific methods in the API and create a reusable component that can persist across your application.

Demo Page

Usage

These instructions are assuming you are using Vue CLI to create your template. Include the plugin in your main.js:

import Chart from 'v-chart-plugin'

Vue.use(Chart);

Within your component you will need to include an object with: title, selector, width, height, and datapoints to pass to the component. Data can be passed as an array or as an array of objects:

export default {
  name: 'example',
  data () {
    return {
      chartData: {
        chartType: 'barChart',
        selector: 'chart',
        title: 'Important Data',
        width: 300,
        height: 200,
        data: [120, 140, 70, 90, 110, 65, 210]      
      }
    }
  }
}

If passed as an array of objects you will need to define which attribute to use as your metric / dimension

export default {
  name: 'example',
  data () {
    return {
      chartData: {
        chartType: "vBarChart",
        selector: "chart",
        title: "Important Data",
        width: 400,
        height: 200,
        metric: 'count', // for two or more metrics pass as an array ['count', 'pyCount']
        data: [
          {'count': 120,
           'fruit': 'apples'}, 
          {'count': 250,
           'fruit': 'oranges'}
        ]
      }
    }
  }
}

Bubble Charts require three metrics (v1, v2, and v3). These should be passed as metrics

export default {
  name: 'example',
  data () {
    return {
      chartData: {
        chartType: "bubbleChart",
        selector: "chart",
        title: "Important Data",
        width: 400,
        height: 200,
        metric: ['count', 'pyCount', 'revenue']
        data: [
          {'count': 120,
           'pyCount': 115,
           'revenue': 170,
           'fruit': 'apples'}, 
          {'count': 250,
           'pyCount': 255,
           'revenue': 325,
           'fruit': 'oranges'}
        ]
      }
    }
  }
}

Overrides

If you need to override any of the default values of the charts (pallette colors, ticks, margins, etc) you can pass an overrides object to you chartData.

      vBarChartData: {
        chartType: "vBarChart",
        ...   
        overrides: {
           palette: {
            fill: 'red',
          },
          y: {
            ticks: 20,
          },
        }
      },

Legends

Legends are turned off by default. You can add a legend to a chart by including a legends objects in your chartData as such:

chartData: {
  chartType: "vBarChart",
  ...
  legends: {
    enabled: true,
    height: 25,
    width: 50,
  }
}

Gridlines

Gridlines are turned off by default. You can include and configure your gridlines via the configuration object:

chartData: {
  chartType: "barChart",
  ...
  grid: {
    enabled: true,
    gridTicks: 25,
  }
}

Goals

Goals are used to place a line on your graph showing where your target is for the period:

chartData: {
  chartType: "lineGraph",
  ...
  goal: 500,
}

Labels

Labels are assigned to the x and y axis:

chartData: {
  chartType: "lineGraph",
  ...
  label: true,
}

Chart types currently supported:

  • barChart: a chart in which the numerical values of variables are represented by the width of rectangles of equal height.
  • vBarChart: a chart in which the numerical values of variables are represented by the height of rectangles of equal width.
  • lineGraph: a graph which displays information as a series of data points called 'markers' connected by straight line segments.
  • scatterPlot: a graph in which the values of two variables are plotted along two axes, the pattern of the resulting points revealing any correlation present.
  • pieChart: a chart in which a circle is divided into slices to illustrate proportion
  • areaChart: a chart which displays graphically quantitative data
  • bubleChart: a bubble chart is a variation of a scatter chart in which the data points are replaced with bubbles, and an additional dimension of the data is represented in the size of the bubbles.

Charts that support two or more metrics

  • barChart
  • vBarChart
  • lineGraph

Lastly you will need to add the component and bind your data

<v-chart v-bind:chartData="chartData"></v-chart>

If you wish to style the components of the chart you can via the selectors:

<style>
  .chart-barChart {
    fill:blue;
  }
</style>

Performance Consideration

By default all charts are imported into v-chart-plugin.js. This allows all charts to share one common interface. If you are only using a few select charts in your implementation you can remove those unused charts from the import statements in the v-chart-plugin.js.

import barChart     from './import/barChart' 
import vBarChart    from './import/vBarChart'
import lineGraph    from './import/lineGraph'
import scatterPlot  from './import/scatterPlot'
import pieChart     from './import/pieChart'
import areaChart    from './import/areaChart'

Build Setup

# install dependencies
yarn  

# serve with hot reload at localhost:8080
yarn serve

# build for production with minification
yarn build

For a detailed explanation on how things work, check out the guide and docs for vue-loader.

v-chart-plugin's People

Contributors

dependabot[bot] avatar ignoreintuition avatar kndarp avatar mtrunt avatar paulhbarker avatar philihp avatar quiquee avatar suprasinha avatar thenewsound avatar

Stargazers

 avatar  avatar  avatar  avatar  avatar  avatar  avatar  avatar  avatar  avatar  avatar  avatar  avatar  avatar  avatar  avatar  avatar  avatar  avatar  avatar  avatar  avatar  avatar  avatar  avatar  avatar  avatar  avatar  avatar  avatar  avatar  avatar  avatar  avatar  avatar  avatar  avatar  avatar  avatar  avatar  avatar  avatar  avatar  avatar  avatar  avatar  avatar  avatar  avatar  avatar  avatar  avatar  avatar  avatar  avatar  avatar  avatar  avatar  avatar  avatar  avatar  avatar  avatar  avatar  avatar  avatar  avatar  avatar  avatar  avatar  avatar  avatar  avatar  avatar  avatar  avatar  avatar  avatar  avatar  avatar  avatar  avatar  avatar  avatar  avatar  avatar  avatar  avatar  avatar  avatar  avatar  avatar  avatar  avatar  avatar  avatar  avatar  avatar  avatar  avatar

Watchers

 avatar  avatar  avatar  avatar  avatar  avatar  avatar  avatar  avatar  avatar  avatar  avatar  avatar  avatar

v-chart-plugin's Issues

Add Area Graph

An area chart is similar to a line chart, but the space between the x-axis and the line is filled with a color or pattern. It is useful for showing part-to-whole relations, such as showing individual sales reps’ contribution to total sales for a year. It helps you analyze both overall and individual trend information.

Can re-use the module for line chart.

Ghosting on line charts

When line charts transition we have noticed that the new path appears while it tweens the old path.

Bubble Chart

Add in a bubble chart that will take one dimension (oridinal coordinate) and two measures (linear). Plot the dimension and the first measure against each other on the x/y axis. The second measure used to measure the radius of the plot point.

Add Optional Subtitle Field

The chart should allow for the smaller subtitle to be displayed under the graphs main title. Adjust the size and placement of the graph accordingly when the subtitle is included.

Transition and easing

Currently when the graph is updated it redraws. Need to update to transition and include easing

ERROR in ./node_modules/v-chart-plugin/src/v-chart-plugin.js

I installed this plugian via npm install v-chart-plugin
When I try to include the JS file of the plugin npm doesn't compile and I get this error

Module parse failed: Unexpected token (111:16)
You may need an appropriate loader to handle this file type.
|                  * @description Bar chart directive
|                  */
|                 ...((typeof barChart !== 'undefined') && { barChart: barChart }),
|                 /**
|                  * @method vBarChard

When I manually remove this lines

                /**
                 * @method barChart
                 * @description Bar chart directive
                 */
                ...((typeof barChart !== 'undefined') && { barChart: barChart }),
                /**
                 * @method vBarChard
                 * @description Verticle Bar chart directive
                 */
                ...((typeof vBarChart !== 'undefined') && { vBarChart: vBarChart }),
                /**
                 * @method scatterPlot
                 * @description Scatter Plot directive
                 */
                ...((typeof scatterPlot !== 'undefined') && { scatterPlot: scatterPlot }),
                /**
                 * @method pieChart
                 * @description Pie chart directive
                 */
                ...((typeof pieChart !== 'undefined') && { pieChart: pieChart }),
                /**
                 * @method areaChart
                 * @description Area chart directive
                 */
                ...((typeof areaChart !== 'undefined') && { areaChart: areaChart }),
                /**
                 * @method lineGraph
                 * @description Line Graph directive
                 */
                ...((typeof lineGraph !== 'undefined') && { lineGraph: lineGraph }),

It's included correctly

Add Funnel Chart

Funnel charts are most often used to represent how something moves through different stages in a process. A funnel chart displays values as progressively decreasing proportions amounting to 100 percent in total. Funnel charts start at 100% and ends with a lower percentage indicating how something drops out of the process at each step or stage. A very common use of a funnel chart is to track sales conversions in a sales pipeline.

add data on refresh

When additional data is loaded into the dataset the charts should update accordingly

Add Optional Legends

Chart Legend provides short description of Data being rendered on Chart. Improves readability when there are multiple Data Series.

Ghosting on Line Charts

When new data is received for a line chart the new path immediately appears before the original path tweens to it's new location. This should be seamless.

Update Demo Page

Demo page needs to be updated to reflect some additional features, link to github, and include V-chart-plugin logo

Clean up jsdocs

Need someone to go through and fix up the comments on all the functions so that the jsDocs are accurate.

Unable to import v-chart-plugin

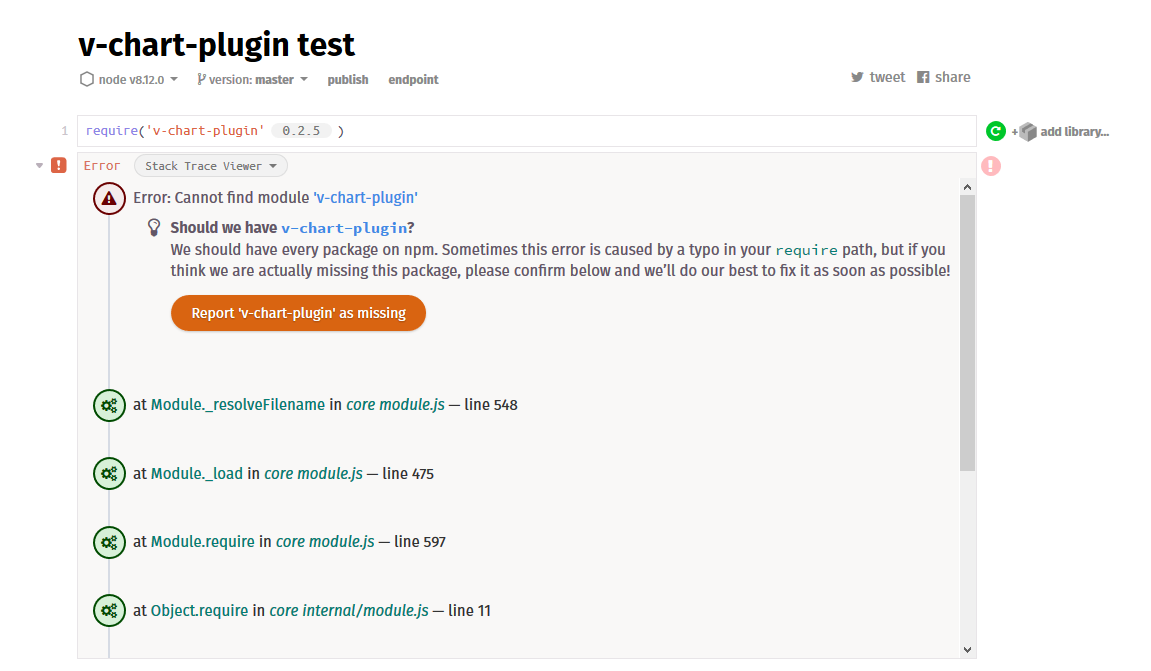
I'm not able to import v-chart plugin from my node_modules. I created an empty runkit notebook that illustrates the problem: https://runkit.com/natemara/v-chart-plugin-test.

2018-10-27 10_05_31-window

You can see that it finds the version, so it does have the package installed, it's just some problem with the way that this library is exported. I think it may be because the package.json has no main field. Can this be added?

Add in test scripts

Currently we do not have test scripts. Would need to add in for coverage.

Ghosting on Line Charts

When new data is received for a line chart the new path immediately appears before the original path tweens to it's new location. This should be seamless.

Add box plots

A Five Number Summary includes:

Minimum
First Quartile
Median (Second Quartile)
Third Quartile
Maximum

Recommend Projects

  • React photo React

    A declarative, efficient, and flexible JavaScript library for building user interfaces.

  • Vue.js photo Vue.js

    🖖 Vue.js is a progressive, incrementally-adoptable JavaScript framework for building UI on the web.

  • Typescript photo Typescript

    TypeScript is a superset of JavaScript that compiles to clean JavaScript output.

  • TensorFlow photo TensorFlow

    An Open Source Machine Learning Framework for Everyone

  • Django photo Django

    The Web framework for perfectionists with deadlines.

  • D3 photo D3

    Bring data to life with SVG, Canvas and HTML. 📊📈🎉

Recommend Topics

  • javascript

    JavaScript (JS) is a lightweight interpreted programming language with first-class functions.

  • web

    Some thing interesting about web. New door for the world.

  • server

    A server is a program made to process requests and deliver data to clients.

  • Machine learning

    Machine learning is a way of modeling and interpreting data that allows a piece of software to respond intelligently.

  • Game

    Some thing interesting about game, make everyone happy.

Recommend Org

  • Facebook photo Facebook

    We are working to build community through open source technology. NB: members must have two-factor auth.

  • Microsoft photo Microsoft

    Open source projects and samples from Microsoft.

  • Google photo Google

    Google ❤️ Open Source for everyone.

  • D3 photo D3

    Data-Driven Documents codes.