uptimerobot_exporter is a Prometheus exporter for Uptimerobot.
The easier way to setup this exporter is to use the Docker image on Docker Hub.
Using a docker-compose.yaml:
version: "3"

services:
uptimerobot_exporter:
    image: paolobasso/uptimerobot_exporter
    container_name: uptimerobot_exporter
    environment:
    - UPTIMEROBOT_READ_API_KEY=your-api-key
    - INTERVAL_SECONDS=300
    - LOG_LEVEL=INFO
    - PORT=8000
    ports:
    - 8000:8000
    restart: unless-stopped
If Prometheus is in the same server an internal Docker network without exposing the metrics to the internet would be preferred.
| Variable | Required | Default | Description |
|---|---|---|---|
| UPTIMEROBOT_READ_API_KEY | YES | Your Uptimerobot read API key. Found on the Uptimerobot's My Settings page -> API Settings. | |
| INTERVAL_SECONDS | NO | 300 | How many seconds to wait between a scrape end and the next scrape. You should use the Uptimerobot monitor's shortest interval. |
| LOG_LEVEL | NO | INFO | The log level. |
| PORT | NO | 8000 | The port where metrics will be exposed |
Add a job to your Prometheus configs:
- job_name: 'uptimerobot'
   scrape_interval: 5m
   scrape_timeout: 300s # Same as INTERVAL_SECONDS env vars
   static_configs:
     - targets:
        - 'localhost:8000' # Use the PORT env var (Default is 8000)
| Metric | Type | Labels | Description |
|---|---|---|---|
| uptimerobot_up | Gauge | The last scrape was successful | |
| uptimerobot_scrape_duration_milliseconds | Gauge | The duration of the last scrape in seconds | |
| uptimerobot_monitor_status | Gauge | id, url, name, type | Status of the monitor: 0 = paused, 1 = not checked, 2 = up, 8 = seems down, 9 = down |
| uptimerobot_monitor_response_time_millisecond | Gauge | id, url, name, type, status | Last response time of the monitor in milliseconds |
| uptimerobot_monitor_response_time_average_milliseconds | Gauge | id, url, name, type | Average response time of the monitor in milliseconds |
| uptimerobot_monitor_log_type | Gauge | id, url, name, type | Last log type of the monitor: 1 = down, 2 = up, 98 = started, 99 = paused |
| uptimerobot_monitor_log_datetime | Gauge | id, url, name, type, logtype | Last log of the monitor datetime |
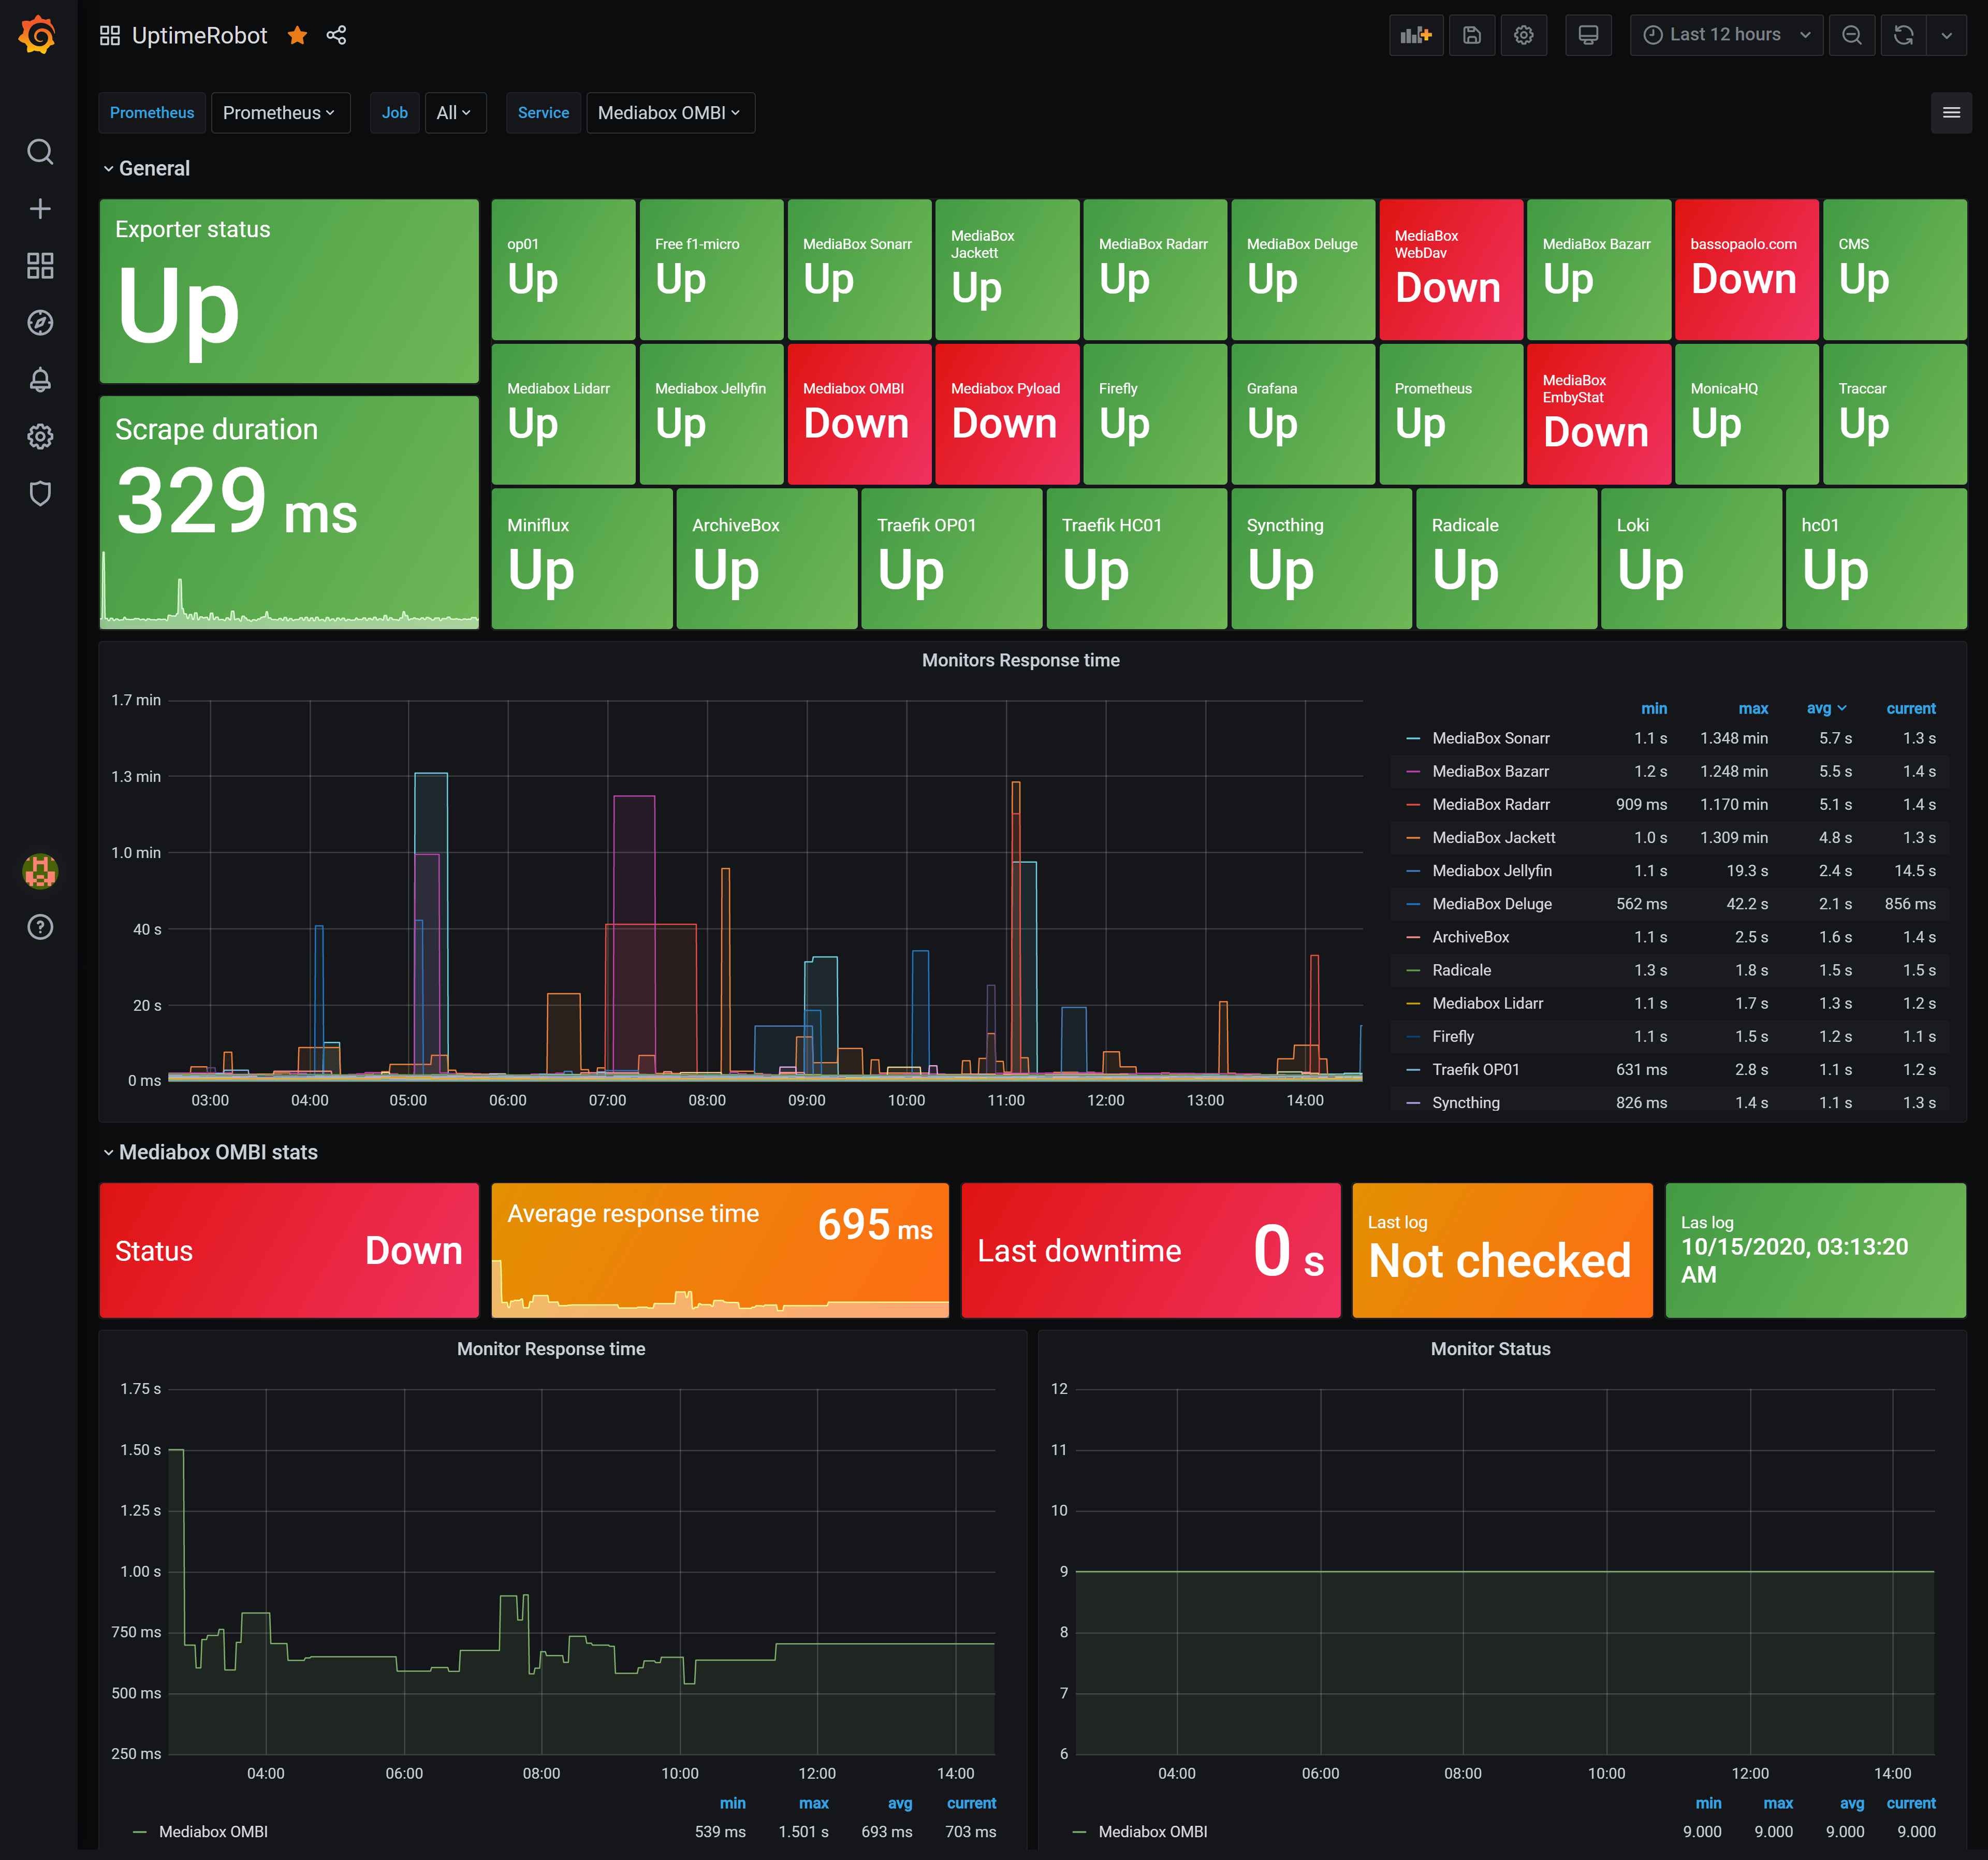
You can find the Grafana dashboard to visualize the metrics exposed by this exporter here and it looks like this:
I needed a Prometheus exporter for Uptimerobot and the existing ones that I found are either old, not updated, poorly documented or they expose not enough metrics. It was also an opportunity to learn more about Prometheus and Python.
- Using Uptimerobot to monitor websites uptime
- Creating a basic Prometheus Exporter with Python
- Creating a Grafana Dashboard from scratch
- Dockerizing a simple Python application
- Auto publishing Docker images to Docker Hub with GitHub actions
- Tesing a simple python application
- Self Hosting Prometheus
- Self Hosting Grafana
- Python Docstrings
GNU AFFERO GENERAL PUBLIC LICENSE Version 3

