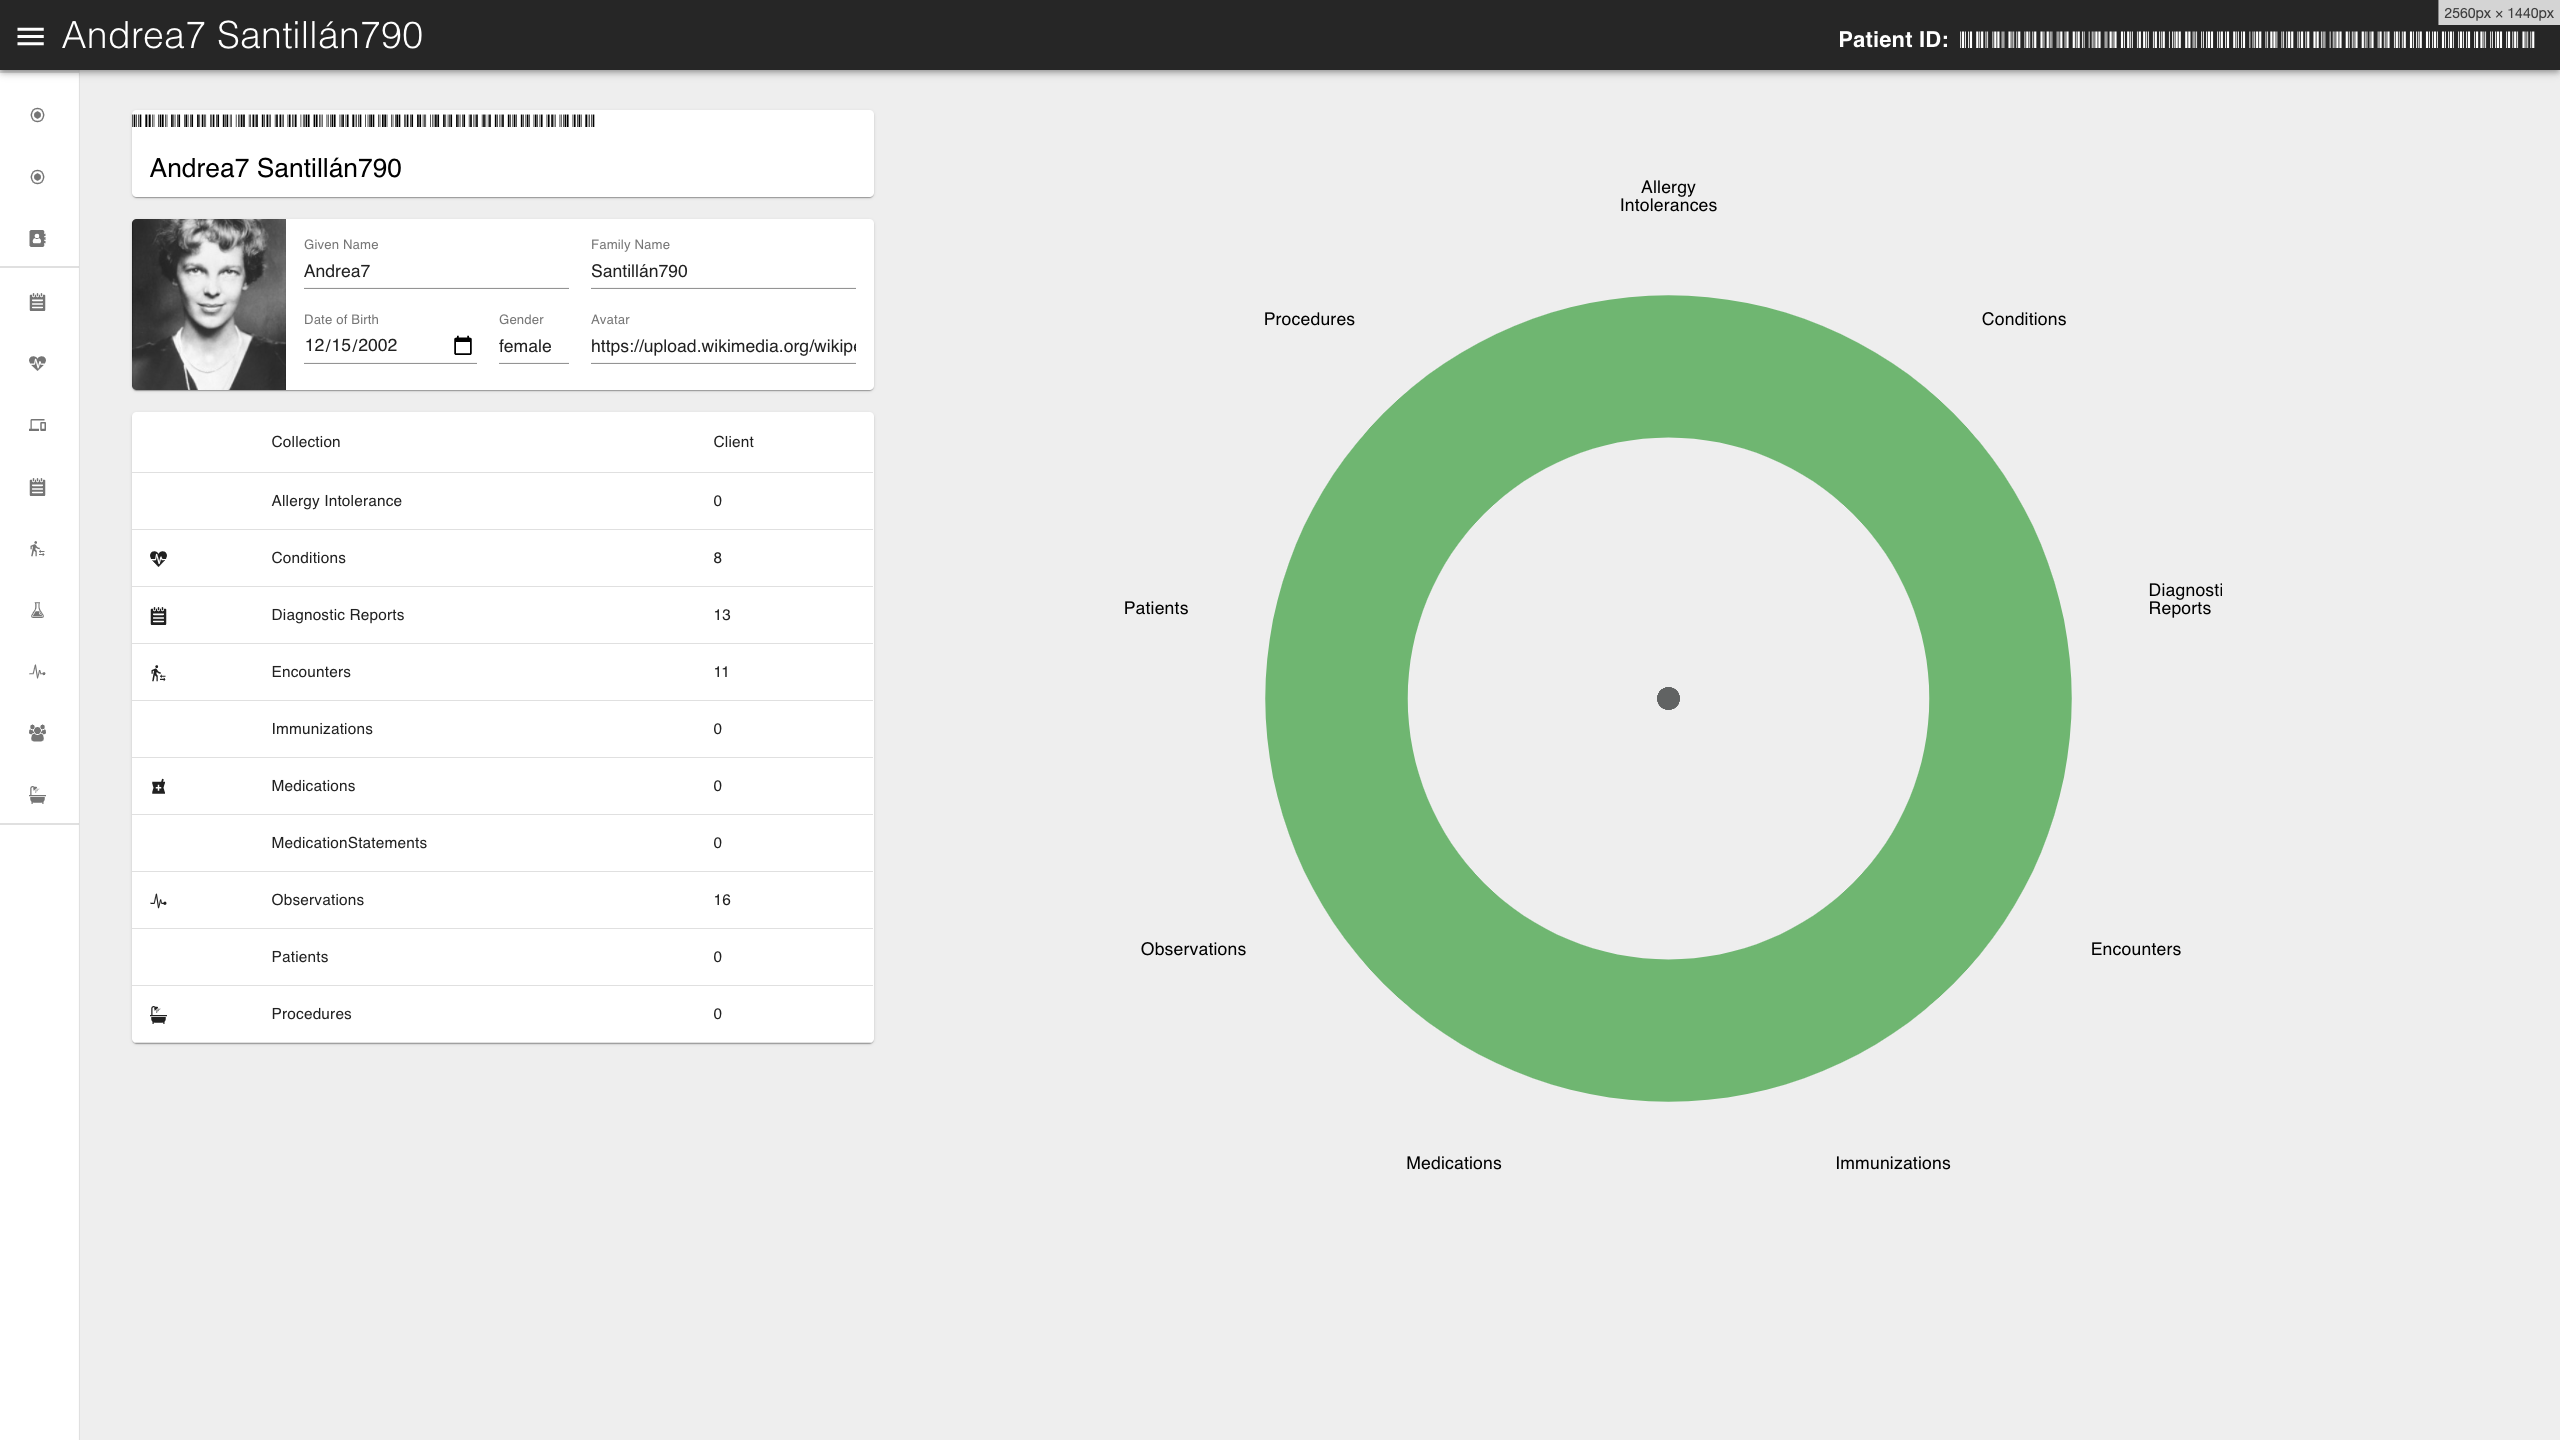
An open source visualization for patient health data, as a React component using d3.
View the React based demo for this repository.
See the core hGraph repo for more examples and roadmap.
Looking for React Native? Check out the port to React Native from Citizen Health.

This package can be found on npm and installed like so:
$ yarn add hgraph-react
# or
$ npm install hgraph-react
The hGraph component is packaged using webpack.
Most props are not required and have sensible defaults built in, as listed below.
| Prop Name | Type | Is Required | Description | Default |
|---|---|---|---|---|
| data | array | true | An array of objects representing the metrics to display in hGraph (see below) | N/A |
| score | number | false | The overall score to display in the center of hGraph | N/A |
| width | number | false | The width in pixels hGraph should render at. | 600 |
| height | number | false | The height in pixels hGraph should render at. | 600 |
| margin | object | false | An object representing the values for margins around hGraph. | { top: 70, right: 100, bottom: 70, left: 100 } |
| thresholdMin | number | false | A number value between 0 and 1 (percentage), determining the position the lower threshold of the healthy range renders at. | .25 |
| thresholdMax | number | false | A number value between 0 and 1 (percentage), determining the position the upper threshold of the healthy range renders at. | .75 |
| donutHoleFactor | number | false | A number value between 0 and 1 (percentage), determining the amount of hGraph's radius that should be cut out forming the hole in the center of the graph. | .4 |
| color | string (hex color code) | false | The color of the points and polygon shape. | '#616363' |
| healthyRangeFillColor | string (hex color code) | false | The color of the healthy range band. | '#98bd8e' |
| fontSize | number | false | The size (in pixels) of the font for the labels. | 16 |
| fontColor | string (hex color code) | false | The color of the labels. | '#000' |
| showAxisLabel | boolean | false | Whether or not axis labels should display around hGraph. | true |
| axisLabelWrapWidth | number | false | The width (in pixels) that the labels should wrap text at. | 80 (Note: use null for no wrapping) |
| axisLabelOffset | number | false | The distance (in pixels) that axis labels should be offset from the outer bounds of hGraph's 'absolute max' radius. | 12 |
| areaOpacity | number | false | The opacity of the polygon shape. | 0.25 |
| pointRadius | number | false | The radius (in pixels) of the points for metric values. | 10 |
| pointLabelWrapWidth | number | false | The width (in pixels) that the point labels should wrap text at. | null (no wrapping) |
| pointLabelOffset | number | false | The distance (in pixels) that point labels should be offset from the point. | 8 |
| hitboxRadius | number | false | The radius (in pixels) of the point hitboxes. (hGraph overlays a transparent hitbox over each point which can help users accurately click/touch points, particularly on mobile devices.) | Defaults to props.pointRadius size. |
| showScore | boolean | false | Whether or not to display the overall score in the middle of hGraph. | true |
| scoreFontSize | number | false | The size (in pixels) of the font for the overall hGraph score | 120 |
| scoreFontColor | string (hex color code) | false | The color of the hGraph score. | '#000' |
| zoomFactor | number | false | The multiplier factor hGraph should zoom in. | 2.25 |
| zoomTransitionTime | number | false | The amount of time (in milliseconds) the zooming animation should take. | 750 |
| zoomOnPointClick | boolean | false | Configure if hGraph should zoom in/focus on a clicked point and display child points in the graph. | true |
| onPointClick | function | false | Callback function called when a point is clicked. Function is passed 2 arguments: the data object corresponding to the point clicked, and the event. | N/A |
| Property Name | Type | Is Required | Description |
|---|---|---|---|
| id | string | true | A unique (compared to all other metrics) identifier string for the metric. |
| label | string | true | The axis display label for the metric. |
| value | number | true | The patient's recorded value for the metric. |
| healthyMin | number | true | The minimum value possible to still be considered a healthy value. |
| healthyMax | number | true | The maximum value possible to still be considered a healthy value. |
| absoluteMin | number | true | A reasonable minimum possible value for this metric. Note: values below this absolute minimum will be clamped to the min.) |
| absoluteMax | number | true | A reasonable maximum possible value for this metric. Note: values above this absolute maximum will be clamped to the max. |
| unitLabel | string | true | The units the metric is measured in, displayed with the metric value. |
| children | array | false | Optional array of child metrics that comprise this metric. Children metrics should conform to hGraph Metric Objects properties. Children are shown when a point is clicked and hGraph is in the "zoomed in" state. |
hGraph is Apache 2.0 licensed.

![dependabot[bot] avatar](https://avatars.githubusercontent.com/in/29110?v=4 "dependabot[bot]")