A Research Compendium of "Gaining insights in datasets in the shade of “garbage in, garbage out” rationale: feature space distribution fitting"
This repository is a research compendium of my academic publication. It provides ready-to-run open-source R scripts, example data sets, and materials (e.g., tabular data and graphics) for quantifying machine-learning data sets with respect to the fit to four long right-tail statistical distributions, namely power law, log-normal, Poisson, and exponential distributions.
Note: Please, cite the study if you would like to use or adapt the code, datasets, methodology, and other materials provided and let me know. Thank you for your interest.
Gürol Canbek, Gaining Insights in Datasets in the Shade of “Garbage In, Garbage Out” Rationale: Feature-Space Distribution Fitting. In Data Mining and Knowledge Discovery, DOI:10.1002/widm.1456, 2022.
- Dataset Distribution Analysis R Scripts
- Sample Academic Datasets on Android Mobile Benign/Malign Applications (i.e. Goodware/Malware)
- Extra Materials in an Open Office Spreadsheet (best viewed in LibreOffice)
/ [root]
├── code
│   ├── DsFeatFreqDistFit.R : Script calculating data set distributions and generating all the related figures (more than the article)
│   ├── utils.R : Common utility script used by other scripts
│   ├── LICENSE : License file
│   ├── README.md : This help file
├── data
│   ├── datasets.ods : Extra materials in an Open Office Spreadsheet (best viewed in LibreOffice)
│   ├── ds_dist_benign.RData : Feature distribution data for benign data sets in R format
│   └── ds_dist_malign.RData : Feature distribution data for malign data sets in R format
│   └── csv
│       └── FatureFrequencyDistribution_BenignDatasets.csv : Benign data sets frequency distributions in comma seperated values in decreasing order
│       └── FatureFrequencyDistribution_MalignDatasets.csv : Malign data sets frequency distributions in comma seperated values in decreasing order
│       └── DatasetSizesPerClass.csv : Benign and malign data set (sample) sizes
└── results
    └── dist_analysis_all.csv : Complete dump of data set distribution analysis for all the benign and malign data sets
    └── fit_unfit.csv : The list of features fit/unfit to the 4 statistical distributions (power law, log-normal, exponential, and Poisson)
    └── Benign or Malign
        └── DSi
            └── fig(Benign/Malign)_DSi_fit(Ex/Ln/Pl)_vs_All.png : One of the Exponential, Log-normal, and Power law fits against others fitting DSi feature distribution graph
            └── fig(Benign/Malign)_DSi_Likelihood_[fit](Pl/Ln)_vs_[fit](Ex/Ln).png : Vuong's test showing colored log-likelihood plots for the two distributions compared (according to one of the distribution's fit)
            └── fig(Benign/Malign)_DSi_Vuong_[fit](Pl/Ln/Ex/Po)_vs_[fit](Pl/Ln/Ex/Po).png : Vuong's test showing log-likelihood plots for the two distributions compared (according to one of the distribution's fit)
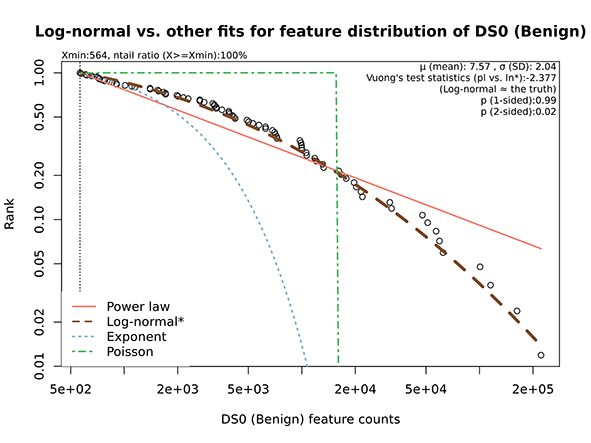
Figure 1. Benign data set plausibility of log-normal distribution fit and others
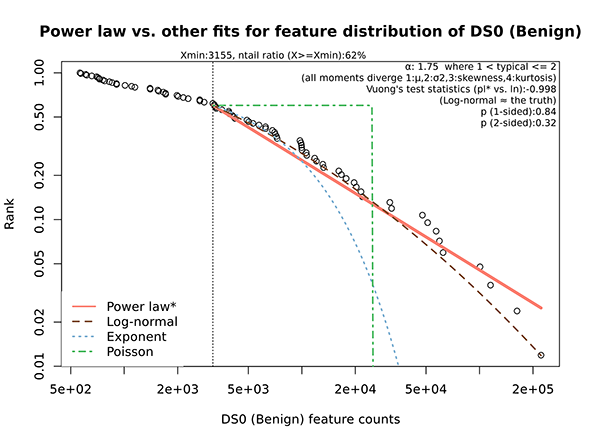
Figure 2. Benign data set plausibility of power law distribution fit and others
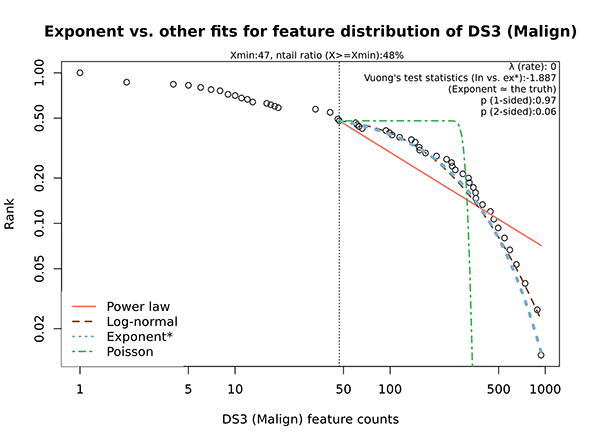
Figure 3. Malign (malware) data set plausibility of exponential distribution fit and others
DsFeatFreqDistFit.R Comprehensive set of distribution testing to fit power law, log-normal, exponential, and Poisson statistical distribution into the feature frequency distributions (i.e. the truth)
Hassle-free, ready-to-run data frames for data set frequency distributions to run the R script (see Data pane)
ds_dist_benign.RDatads_dist_benign.RData
Extra materials:
- Frequency of permission features per data set per class as a tabular data
- Data set quantification chart
- Feature frequency distribution along with the plausible statistical distribution fits with the parameters
- A comprehensive visualy enhanced table of distribution fit hypothesis tests on power law, log-normal, exponential, and Poisson
- The complete tabulated dump of dsdist.R script run
- Fitted/nonfitted feature list per best fit statistical distributions
