Code Monkey home page Code Monkey logo

chartist-plugin-threshold's Introduction

Threshold plugin for Chartist

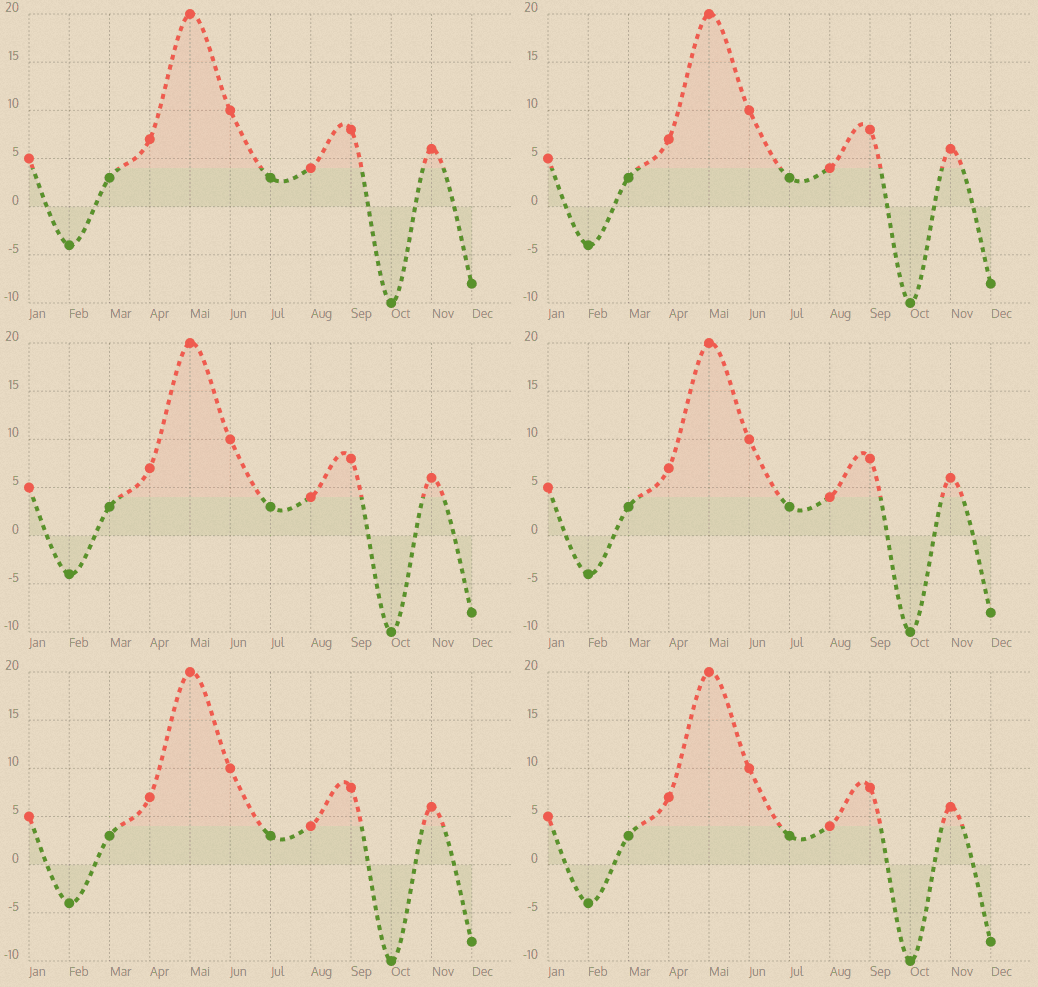
This Chartist plugin can be used to divide your Line or Bar chart with a threshold. Everything above and below the threshold will be tagged with a special class, in order for your to apply different styling where appropriate.

Threshold Example Screenshot

Usage example

You can use the Plugin for bar and line charts. Chartist will split the relevant elements so that they get divided in an above and below part. All elements will receive classes that allow you to style the parts above the threshold different than the parts below.

new Chartist.Line('.ct-chart', {
  labels: ['Jan', 'Feb', 'Mar', 'Apr', 'Mai', 'Jun', 'Jul', 'Aug', 'Sep', 'Oct', 'Nov', 'Dec'],
  series: [
    [5, -4, 3, 7, 20, 10, 3, 4, 8, -10, 6, -8]
  ]
}, {
  showArea: true,
  axisY: {
    onlyInteger: true
  },
  plugins: [
    Chartist.plugins.ctThreshold({
      threshold: 4
    })
  ]
});

Use the following CSS to style the chart parts

.ct-line.ct-threshold-above, .ct-point.ct-threshold-above, .ct-bar.ct-threshold-above {
  stroke: #f05b4f;
}

.ct-line.ct-threshold-below, .ct-point.ct-threshold-below, .ct-bar.ct-threshold-below {
  stroke: #59922b;
}

.ct-area.ct-threshold-above {
  fill: #f05b4f;
}

.ct-area.ct-threshold-below {
  fill: #59922b;
}

You can, of course, also split multiple series with the threshold plugin. Just make sure you modify the CSS selectors with the necessary parent series class.

.ct-series-a .ct-bar.ct-threshold-above {
  stroke: #f05b4f;
}

.ct-series-a .ct-bar.ct-threshold-below {
  stroke: #59922b;
}

Default options

These are the default options of the threshold plugin. All options can be customized within the plugin factory function.

var defaultOptions = {
  threshold: 0,
  classNames: {
    aboveThreshold: 'ct-threshold-above',
    belowThreshold: 'ct-threshold-below'
  },
  maskNames: {
    aboveThreshold: 'ct-threshold-mask-above',
    belowThreshold: 'ct-threshold-mask-below'
  }
};
chartist-plugin-threshold's People

Contributors

gionkunz avatar marcalexiei avatar

Stargazers

 avatar  avatar  avatar  avatar  avatar  avatar  avatar  avatar  avatar  avatar  avatar  avatar  avatar  avatar  avatar  avatar  avatar  avatar  avatar  avatar  avatar  avatar  avatar  avatar  avatar  avatar  avatar  avatar  avatar

Watchers

 avatar  avatar  avatar  avatar

chartist-plugin-threshold's Issues

Feature: Threshold range

Feature request: Ability to define a threshold range, which has a lower and upper limit.

For example, maybe threshold could accept an array with two values (lower and upper):

threshold: [36,38]

With classes applied for upper, inside and lower.

To be able to render something like this:

Screenshot from 2024-03-22 13-19-05

Update Threshold with button click

Hello,

I'm trying update the threshold and the whole chart with a click event, but the threshold doesn't changes. The chart axys updating as expected but threshold stays at the default value.

I'm updating the chart like this:

function ChangeChart(_low, _high, _threshold){
  mychart.update({
    labels: _labels,
    series: _series
  }, {
    low: _low,
    high: _high,
    showArea: true,
    plugins: [
       Chartist.plugins.ctThreshold({
         threshold: _threshold
        })
     ]
  });
}

$(document).ready(function(){
  $('button').click(function(){
     var _threshold = 2; //default is 4
     var _low = 2.5; //default is 3.5
     var _high = 5.5; //default is 6.5
     ChangeChart(_low, _high, _threshold);
   });
});

Is there a way to update the threshold. Am I doing something wrong?

Bars disappear

Hello
first of thanks for this great library!
My problem, I cannot get the threshold plugin to work in my bar graph. As soon as I enable the plugin my bars disappear.
Below is my HTML and CSS.
Thanks!
Alex

<!DOCTYPE html>
<html>
<head>
	<title>Test Page</title>
	
    <link rel="stylesheet" type="text/css" href="chart/chartist.css">
    <link rel="stylesheet" type="text/css" href="chart/threshold-styles.css"> 
    <link rel="stylesheet" type="text/css" href="chart/sample-styles.css">
    
    <!--Script references. -->
    <!--Reference the jQuery library. -->
    <script src="Scripts/jquery-1.6.4.min.js"></script>
    <!--Reference the chartist library (Chart). -->
    <script type="text/javascript" src="chart/chartist.min.js"></script>
    <script type="text/javascript" src="chart/chartist-plugin-axistitle.js"></script>
    <script type="text/javascript" src="chart/chartist-plugin-targetline.js"></script>
    <script type="text/javascript" src="chart/chartist-plugin-threshold.js"></script>
  
</head>
<body>
    <script>
        $(function () {
            var options = ({ width: 600, height: 200, high: 500 , 
                plugins: [Chartist.plugins.ctAxisTitle({
                    axisX: {
                        axisTitle: 'Horizontal Axis Label',
                        axisClass: 'ct-axis-title',
                        offset: {
                            x: 0,
                            y: 30
                        },
                        textAnchor: 'middle'
                    },
                    axisY: {
                        axisTitle: 'Vertical Axis Label',
                        axisClass: 'ct-axis-title',
                        offset: {
                            x: 0,
                            y: -1
                        },
                        flipTitle: false
                    }
                })
                , Chartist.plugins.ctTargetLine({ value: 275 }) 
                <!-- , Chartist.plugins.ctThreshold({ threshold: 200 }) //Create threshold does not work  -->
                ]
            });
            
            var chart = new Chartist.Bar('.ct-chart', { labels: [1, 2, 3, 4, 5], series: [[450, 200, 220, 300, 400]] }, options);
        });
    </script>
    <div style="position: fixed; top: 30px; left: 30px" class="ct-chart"></div>
</body>
</html>

And here is the sample-styles.css

.ct-target-line {
  stroke: green;
  stroke-width: 2px;
}

.ct-line.ct-threshold-above, .ct-point.ct-threshold-above, .ct-bar.ct-threshold-above {
  stroke: #f05b4f;
}

.ct-line.ct-threshold-below, .ct-point.ct-threshold-below, .ct-bar.ct-threshold-below {
  stroke: #59922b;
}

.ct-area.ct-threshold-above {
  fill: #f05b4f;
}

.ct-area.ct-threshold-below {
  fill: #59922b;
}

Issue when using High/Low entries

When using high/low options for chart the threshold colors don't always show:

new Chartist.Bar('#chartSF', {
labels: ['WR','RP','MJ','LJ','CN','RB','SM','LB','LW','CJ','RW','MR'],
series: [
[4.14035,4.27397,3.93103,3.70270,3.92105,3.77273,3.68182,3.55000,3.67500,3.61765,3.42308,3.26087]
]
}, {
horizontalBars: false,
high: 5,
low: 3,
axisY: {
},
plugins: [
Chartist.plugins.ctThreshold({
threshold: 3.7458541666666666666666666667
})
]
});

Plugin not work at all !!

I have been playing around with chartist for few hours now. I successfully integrated other plugins but this one is just a nightmare. I'll include a jsfiddle link below. If someone could tell me if it's my mistake or a bug, I would be forever thankful.

https://jsfiddle.net/HassanYA/9w24uo6b/2/

btw thanks for being open-source much love <3

Cloned line path appears 'over' original line path

Problem
The original line path element naturally appears before the cloned element.

This causes problems for other plugins that perhaps have added event listeners (mouseover, mouseout, etc) to the original element as these events will not be triggered by the cloned element, for a couple of reasons:

  • cloneNode does not clone events of the original element, and
  • the cloned element appears 'over' the original element, effectively blocking triggering of events.

Solutions
One solution is to clone the events of the original node.

However, since the cloned node is purely presentational, perhaps it would be better to either disable mouse / pointer events of the cloned node or simply insert it first before the original node.

Issues with certain datasets on bar graphs

I am having an issue with certain series values causing some display issues.
Certain datasets seem to work fine, wile others cause the values to be grouped together on the X axis, making the graph not display correctly.
I am unable to figure out any consistancy as to when it works and when it doesn't.

Example of non-working code here: https://jsfiddle.net/up4af8ad/5/

Working datasets:
series: [[3, 0, 4, 5, 6, -2, -1, -4, -6, 6, -2, -1, -4, 2, 3, -1, -2, 4, 2]]
series:[[0],[0],[0],[0],[0],[0],[0],[0],[0],[-1],[-1],[-1],[0],[0],[0],[0],[0],[0]]

Non-working datasets:
series: [[1],[-1],[0],[3],[-3],[2],[0],[0],[0],[0],[0],[0],[0],[0],[0],[0],[0],[0]]
series: [[0],[1],[-4],[0],[-1],[0],[1],[1],[1],[-1],[-1],[0],[0],[0],[0],[0],[0],[0]]

Threshold on X axis

How do i plot the threshold along my X axis? I have been trying but so far only able to plot along the Y axis!

Thanks.

Fix documentation

Inside readme.md you have the following:

.ct-area.ct-threshold-above {
    stroke: #f05b4f;
}

.ct-area.ct-threshold-below {
    stroke: #59922b;
}

"stroke" should be changed to "fill" in both lines. It's fixed in the sample-styles.scss file but not in the docs, I spent four hours figuring out what was wrong with my chart code haha.

A pull request for this seemed like too much.

BTW, great job with chartist.js!

Showing multiple charts makes the area coloring go wrong

When I show one chart, everything is fine, but showing multiple, and the threshold coloring doesn't seem to work.

I made a codepen:
https://codepen.io/anon/pen/eVJywN

You can easily see that it can work by removing the .chart-XRP div, so you only draw one chart. You will see red and green area. But drawing more then one chart and everything stays green.

I have tried to instantiate both chart instances in their own context, tried to make sure I use unique names for everything. But perhaps the issue isn't about variable references, maybe it has to do with targeting dom elements wrongly. I don't know.

Importing into angular app

Hi,

i tried to import your plugin to an angular app that is using ng-chartist.
https://www.npmjs.com/package/ng-chartist

In order to make this work, the lines 1 to 16 have to be changed, Not sure if this would break someone. Maybe you can review it and add it to the package if possible?

(function (root, factory) {
if (root === undefined && window !== undefined) root = window;
if (typeof define === 'function' && define.amd) {
// AMD. Register as an anonymous module unless amdModuleId is set
define(["chartist"], function (a0) {
return (root['Chartist.plugins.ctThreshold'] = factory(a0));
});
} else if (typeof module === 'object' && module.exports) {
// Node. Does not work with strict CommonJS, but
// only CommonJS-like environments that support module.exports,
// like Node.
module.exports = factory(require("chartist"));
} else {
root['Chartist.plugins.ctThreshold'] = factory(root["Chartist"]);
}
}(this, function (Chartist) {

Recommend Projects

  • React photo React

    A declarative, efficient, and flexible JavaScript library for building user interfaces.

  • Vue.js photo Vue.js

    🖖 Vue.js is a progressive, incrementally-adoptable JavaScript framework for building UI on the web.

  • Typescript photo Typescript

    TypeScript is a superset of JavaScript that compiles to clean JavaScript output.

  • TensorFlow photo TensorFlow

    An Open Source Machine Learning Framework for Everyone

  • Django photo Django

    The Web framework for perfectionists with deadlines.

  • D3 photo D3

    Bring data to life with SVG, Canvas and HTML. 📊📈🎉

Recommend Topics

  • javascript

    JavaScript (JS) is a lightweight interpreted programming language with first-class functions.

  • web

    Some thing interesting about web. New door for the world.

  • server

    A server is a program made to process requests and deliver data to clients.

  • Machine learning

    Machine learning is a way of modeling and interpreting data that allows a piece of software to respond intelligently.

  • Game

    Some thing interesting about game, make everyone happy.

Recommend Org

  • Facebook photo Facebook

    We are working to build community through open source technology. NB: members must have two-factor auth.

  • Microsoft photo Microsoft

    Open source projects and samples from Microsoft.

  • Google photo Google

    Google ❤️ Open Source for everyone.

  • D3 photo D3

    Data-Driven Documents codes.