frederick0329 / tracin Goto Github PK
View Code? Open in Web Editor NEWImplementation of Estimating Training Data Influence by Tracing Gradient Descent (NeurIPS 2020)
License: Apache License 2.0
Implementation of Estimating Training Data Influence by Tracing Gradient Descent (NeurIPS 2020)
License: Apache License 2.0


I think the equations below just hold for one checkpoint.
           lg_sim = np.sum(trackin_train['loss_grads'][i] * loss_grad)
           a_sim = np.sum(trackin_train['activations'][i] * activation)
           scores.append(lg_sim * a_sim)```

For the cases with more than one checkpoint equations need to be changed to
        lg_sim = np.sum(trackin_train['loss_grads'][i] * loss_grad, axis=0)
        a_sim = np.sum(trackin_train['activations'][i] * activation, axis=0)
        scores.append(np.sum(lg_sim * a_sim))
which lg_sim and a_sim has dimension c (number of checkpoints)
Hi Frederick,
Thanks for your colab notebook implementation. I am trying to understand the calculation of TracIN score in the notebook "resnet50_imagenet_proponents_opponents" where you calculate 3 scores in the loss function as shown below
def find(loss_grad=None, activation=None, topk=50):
        if loss_grad is None and activation is None:
              raise ValueError('loss grad and activation cannot both be None.')
        scores = []
        scores_lg = []
        scores_a = []
        for i in range(len(trackin_train['image_ids'])):
             if loss_grad is not None and activation is not None:
                     lg_sim = np.sum(trackin_train['loss_grads'][i] * loss_grad)
                     a_sim = np.sum(trackin_train['activations'][i] * activation)
                     scores.append(lg_sim * a_sim)
                     scores_lg.append(lg_sim)
                     scores_a.append(a_sim)
Here you calculate lg_sim, a_sim, and scores and mention them as error_similarity, encoding similarity and influence when you display proponents and opponents for a particular test image.
lg_sim calculation is similar to the formula for calculating TracIN mentioned in the paper. so is the lg_sim score is equivalent to TracIN scores for differentiating proponents and opponents? Is my understanding correct? If so what are the significance of a_sim and scores parameters?
Thanks in Advance
In your FAQ page, you reply this question as
Aggregating Opponents over several test examples: The premise is that mislabelled training examples will oppose predictions of
correctly labelled test points in their vicinity. We therefore expect mislabelled examples to recur in the top opponent lists of several test examples, and aggregating the opponents across a test set will tend to identify incorrectly labelled examples.
I also think to handle it in this way.
The problem I encountered here is, top opponent or proponent lists of different test examples are all identical. So, I obtain the exactly same list of opponents for each test examples.
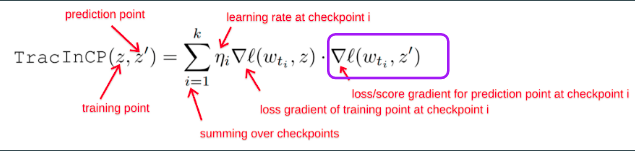
The reason of this is because only the loss of prediction point (test point) changes in the score calculation formula for different test points. When we sort TracinCP scores, we actually sort it based on the loss of training point. So we get exactly same lists of top opponents/proponent for each test point.
In the code,
scores.append(np.sum(trackin_train['loss_grads'][i] * loss_grad)
Can you confirm the case above? If this is true, what do you suggest?
Thanks.
Hello,
I adopt the code from https://github.com/frederick0329/TracIn/blob/master/imagenet/resnet50_imagenet_proponents_opponents.ipynb
to text classification.
The primary goal of my task is to rank the training samples based on their positive or negative impacts on the clean validation set. The core metrics can be accuracy or cross entropy loss for my task. Quite straightforward. Where the training samples could be 100-200 and validation set contains no more than 100 samples. This is a low-data regime.
Validation set is of no error. It Is clean.
Labels include politics business tech entertainment etc. Just a public news topic classification task: AG NEWS.
As for the classifier, similar to your resnet in the image example, I am using CMLM from tensorflow hub and vectorize all samples to 1024 sentence embeddings. Therefore the classifier is quite simple: a single layer network.
here is my implementation
https://github.com/yananchen1989/topic_classification_augmentation/blob/main/cmlm_proponents_opponents.py
I use AUC in the last, to test the effectiveness: high auc indicate that samples of no labelling noise get higher influence score, while samples wrongly labelled, get lower, negative score.
However, the auc is 0.55. Quite woeful.
I am not sure if there is a bug in my implementation, or I have not using TracIn in a appropriate manner.
Hi @frederick0329 !
I was wondering if you had considered sharing the 30th, 60th, and 90th Resnet 50 checkpoints you are using in the notebook. Without them, like karasepid in another issue/thread, I'm sometimes confused about the shape of some of the variables/fields used. If the checkpoints were made available, then it would be straightforward for us to just step through the notebook code and print out those shapes.
Could the checkpoints perhaps be shared from a Google drive, or whatever online storage works best for you?
Thanks for considering this request!
Best regards, -- Phil
Hi Frederick & Co,
Thank you for sharing your awesome work with us! I was wondering if you've already put some thought in how your approach can be extended to analyzing the quality of training data for object detection.
Your technique is fairly straightforward to understand in the context of image classification, where there is one classification head and one can easily find a layer close to the output (e.g., use the weights that connect the layer before the logit layer to the logit layer, as mentioned in the FAQ doc), allowing for the computation of a TracInCP score per frame. But how does one do this in the case of an object detector where there are typically two heads (one for classification, one for bounding box regression) and a varying number of objects per frame? Do you believe that object-level gradients for the objects in a training frame can be aggregated in a meaningful way (e.g., mean or max of gradients across objects for a frame?) such that one can still compute a meaningful dot product between aggregated loss gradients for a training frame and aggregated loss gradients for a test frame? Would this have to be done separately for classification and regression (e.g. a classification proponent may turn out to be a regression opponent, and that would be useful information to surface)?
Are you aware of similar attempts at extending your work to object detection?
Thank you for taking the time to share your thoughts on this, @frederick0329 !
Hi @frederick0329, for sequence tagging (e.g. NER) one would need to predict label for each token in the sequence per a test sample. In this case, the loss is averaged across tokens and gradients of the last FFN can still be computed. I have two questions:
Hello again, @frederick!
I have a question about a difference between the paper and the notebook you've kindly shared with us. To help capture the difference I'm interested in discussing here, I've rewritten the find() function in the notebook so it's more obvious:
def find_topk(tracin_train, eval_loss_grad=None, eval_activation=None, topk=50):
  """
  Find in the training set the topk proponents and opponents for ONE sample in the validation set
  - Use proponents to build a high-value training set much smaller than the original training set
  - Inspect opponents to surface samples that may have mis-labelling issues
  Args:
    loss_grad: loss gradients for this validation sample (1000 floats, num_ckpts)
      recall that tracking_dict["loss_grads"]: loss gradients (N, 1000 floats, num_ckpts)
    activation: activations for this validation sample (2048 floats, num_ckpts)
      recall that tracking_dict["activations"]: activations (N, 2048 floats, num_ckpts)
    topk: number of opponents and proponents to return
  Returns:
    op, pp: topk opponents, topk proponents
  Sample use:
    op, pp = find_topk(tracin_train, tracin_eval['loss_grads'][idx], tracin_eval['activations'][idx])
  """
  # In the original notebook, the authors mutliply two scores (loss_grad_sim and activation_sim)
  if eval_loss_grad is None and eval_activation is None:
    raise ValueError('loss grad and activation cannot both be None.')

  # Walk through the entire list of training samples and score them
  scores = []
  if eval_loss_grad is not None and eval_activation is not None:
    for i in range(len(tracin_train['loss_grads'])):
      # Compute loss gradient similarity
      lg_sim = np.sum(tracin_train['loss_grads'][i] * eval_loss_grad)
      # Compute activation similarity
      a_sim = np.sum(tracin_train['activations'][i] * eval_activation)
      # Save final score
      scores.append(lg_sim * a_sim)  # not paper implementation
  elif eval_loss_grad is not None:
    for i in range(len(tracin_train['loss_grads'])):
      scores.append(np.sum(tracin_train['loss_grads'][i] * eval_loss_grad))  # paper implementation
  elif eval_activation is not None:
    for i in range(len(tracin_train['loss_grads'])):
      scores.append(np.sum(tracin_train['activations'][i] * eval_activation))  # not paper implementation

  # Order the scores from smallest to largest (most negative to most positive)
  indices = np.argsort(scores)
...
Above, I've added a comment to the line that implements Equation (1) in the paper. What's interesting to me is that the formulation you shared in the notebook is different. It's the one where you compute both loss gradient similarity and activation similarity and compute the product between the two.
Would you mind sharing with us what's the motivation for using this formulation instead of the "regular" one?
Thanks again!
-- Phil
unlike the colab example of self influence where the gradient of the loss is clearly calculated using tape, i don't see where the loss_grad is being calculated in the proponent/opponent example
loss_grad = tf.one_hot(labels, 1000) - probs
this is just the loss with no gradients, and it's not calculated anywhere else
can someone clarify?
Hi,
thank you for a great work.
I was wondering.
Have you tried using influence scores to select most influential data points to reduce training set?
Thank you!
A declarative, efficient, and flexible JavaScript library for building user interfaces.
🖖 Vue.js is a progressive, incrementally-adoptable JavaScript framework for building UI on the web.
TypeScript is a superset of JavaScript that compiles to clean JavaScript output.
An Open Source Machine Learning Framework for Everyone
The Web framework for perfectionists with deadlines.
A PHP framework for web artisans
Bring data to life with SVG, Canvas and HTML. 📊📈🎉
JavaScript (JS) is a lightweight interpreted programming language with first-class functions.
Some thing interesting about web. New door for the world.
A server is a program made to process requests and deliver data to clients.
Machine learning is a way of modeling and interpreting data that allows a piece of software to respond intelligently.
Some thing interesting about visualization, use data art
Some thing interesting about game, make everyone happy.
We are working to build community through open source technology. NB: members must have two-factor auth.
Open source projects and samples from Microsoft.
Google ❤️ Open Source for everyone.
Alibaba Open Source for everyone
Data-Driven Documents codes.
China tencent open source team.