Prometheus Ping Exporter is a simple python script which utilize fping to probe endpoint through ICMP and parsing the output to Prometheus. The result can then be visualize through Grafana with ease.
Requirements
- Python 2.x
- fping 4.x
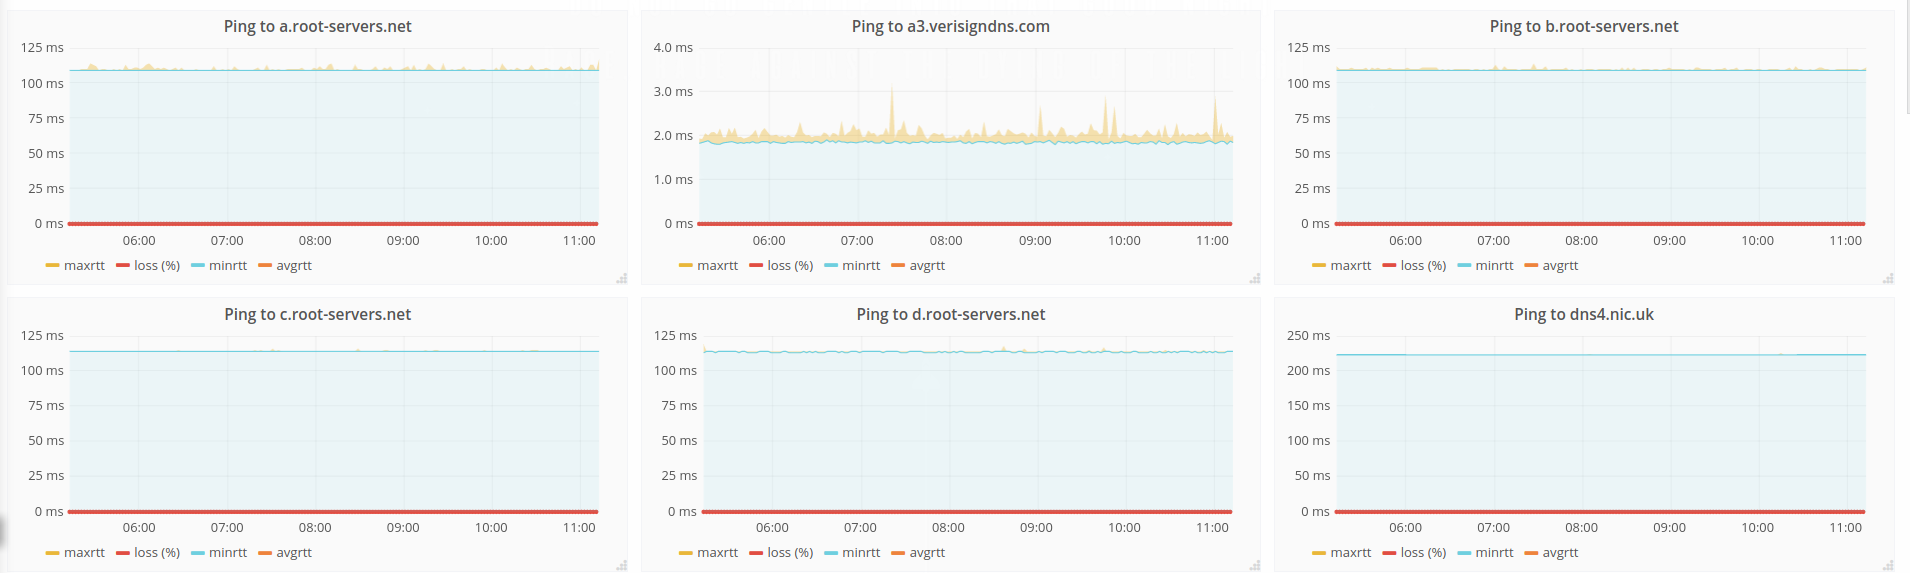
Screenshots
For Debian user, you can get the fping deb file from http://ftp.debian.org/debian/pool/main/f/fping/fping_4.0-1_armhf.deb
For docker user, you can build the container with the Docker file (based on alpine around 54M). For arm user, you can change FROM to "armhf/alpine:edge"
PS: The script is working fine with > 40 ping target in a PI 3B.
- Download ping-exporter.py and place it inside /opt/
# cd /opt/
# curl  -O https://raw.githubusercontent.com/frankiexyz/ping-exporter/master/ping-exporter.py
- Ensure Correct Permission on ping-exporter.py
# chmod 755 /opt/ping-exporter.py
- Running The Ping Exporter
# /usr/bin/python /opt/ping-exporter.py
- Testing The Script
# curl "127.0.0.1:8085/?target=8.8.8.8"
CentOS 7 (Using Systemd)
- Create a new ping_exporter.service file at /lib/systemd/system/
vi /lib/systemd/system/ping_exporter.service
- Paste The Following into ping_exporter.service
[Unit]
Description=Ping Exporter for Prometheus (Created By Frankie)
After=multi-user.target

[Service]
Type=idle
ExecStart=/usr/bin/python /opt/ping-exporter.py

[Install]
WantedBy=multi-user.target
- Save The File and Execute systemctl daemon-reload
# systemctl daemon-reload
- Start and Enable Ping Exporter Service
# systemctl start ping_exporter.service
# systemctl enable ping_exporter.service
Append the following in prometheus's config (Default is prometheus.yml)
  - job_name: 'ping-exporter'
    scrape_interval: 60s
    metrics_path: /probe
    params:
         prot: ['4']
    static_configs:
      - targets:
          - www.ifconfig.xyz
          - www.google.com
    relabel_configs:
      - source_labels: [__address__]
        target_label: __param_target
        replacement: ${1}
      - source_labels: [__param_target]
        regex: (.*)
        target_label: instance
        replacement: ${1}
      - source_labels: []
        regex: .*
        target_label: __address__
        replacement: <Your exporter IP>:8085
You might want to add or change the following parameters in params's section to match your requirements
    params:
         # Default Is IPv4, Can Be Changed To IPv6
         prot: ['4']

         # Ping Packet Size (Default value is 56)
         size: ['56']

         # Ping Count (Default value is 10 times)
         count: ['10']

         # Ping Interval (Default value is 500ms)
         interval: ['500']

         # Source address for ping (System default used if not specified)
         source: ['10.10.10.10']
Prometheus configuration example where the job pings a single destination (params:target) but from multiple source addresses (static_config:targets) to determine the quality of each route / path:
- job_name: 'ping-exporter'
  scrape_interval: 60s
  metrics_path: /probe
  params:
       prot: ['4']
       count: ['3']
       target: ['207.225.112.9']
  static_configs:
    - targets:
        - 192.168.101.2
        - 192.168.102.2
        - 192.168.103.2
        - 192.168.104.2
  relabel_configs:
    - source_labels: [__address__]
      target_label: __param_source
      replacement: ${1}
    - source_labels: [__param_target]
      regex: (.*)
      target_label: instance
      replacement: ${1}
    - source_labels: [__param_source]
      regex: (.*)
      target_label: source
      replacement: ${1}
    - source_labels: []
      regex: .*
      target_label: __address__
      replacement: localhost:8085