
💡 This project uses semantic versioning.
This plugin evolved from the Orchestra Cities Map Panel-Plugins. It extends the original version by the functionality of the intergration of an OGC Web Map Service (WMS version 1.3.0) as a base map layer. Additionally the plugin ships with an interactive filter tool to query data by spatial conditions. Also a minimal implementation of datalinks is provided to update dashboard variables by clicking on a map feature.
Due to Grafana Labs' plugin guidelines it was necessary to remove the Nextzen basemap layer, since it required to store the API key in the config, which should be avoided in panel plugins.
- Integration of OGC WMS 1.3.0 as base map layer
- Interactive spatial filter
- Minimal data links implementation
⚠️ Currently only WMS of version 1.3.0 is supported⚠️
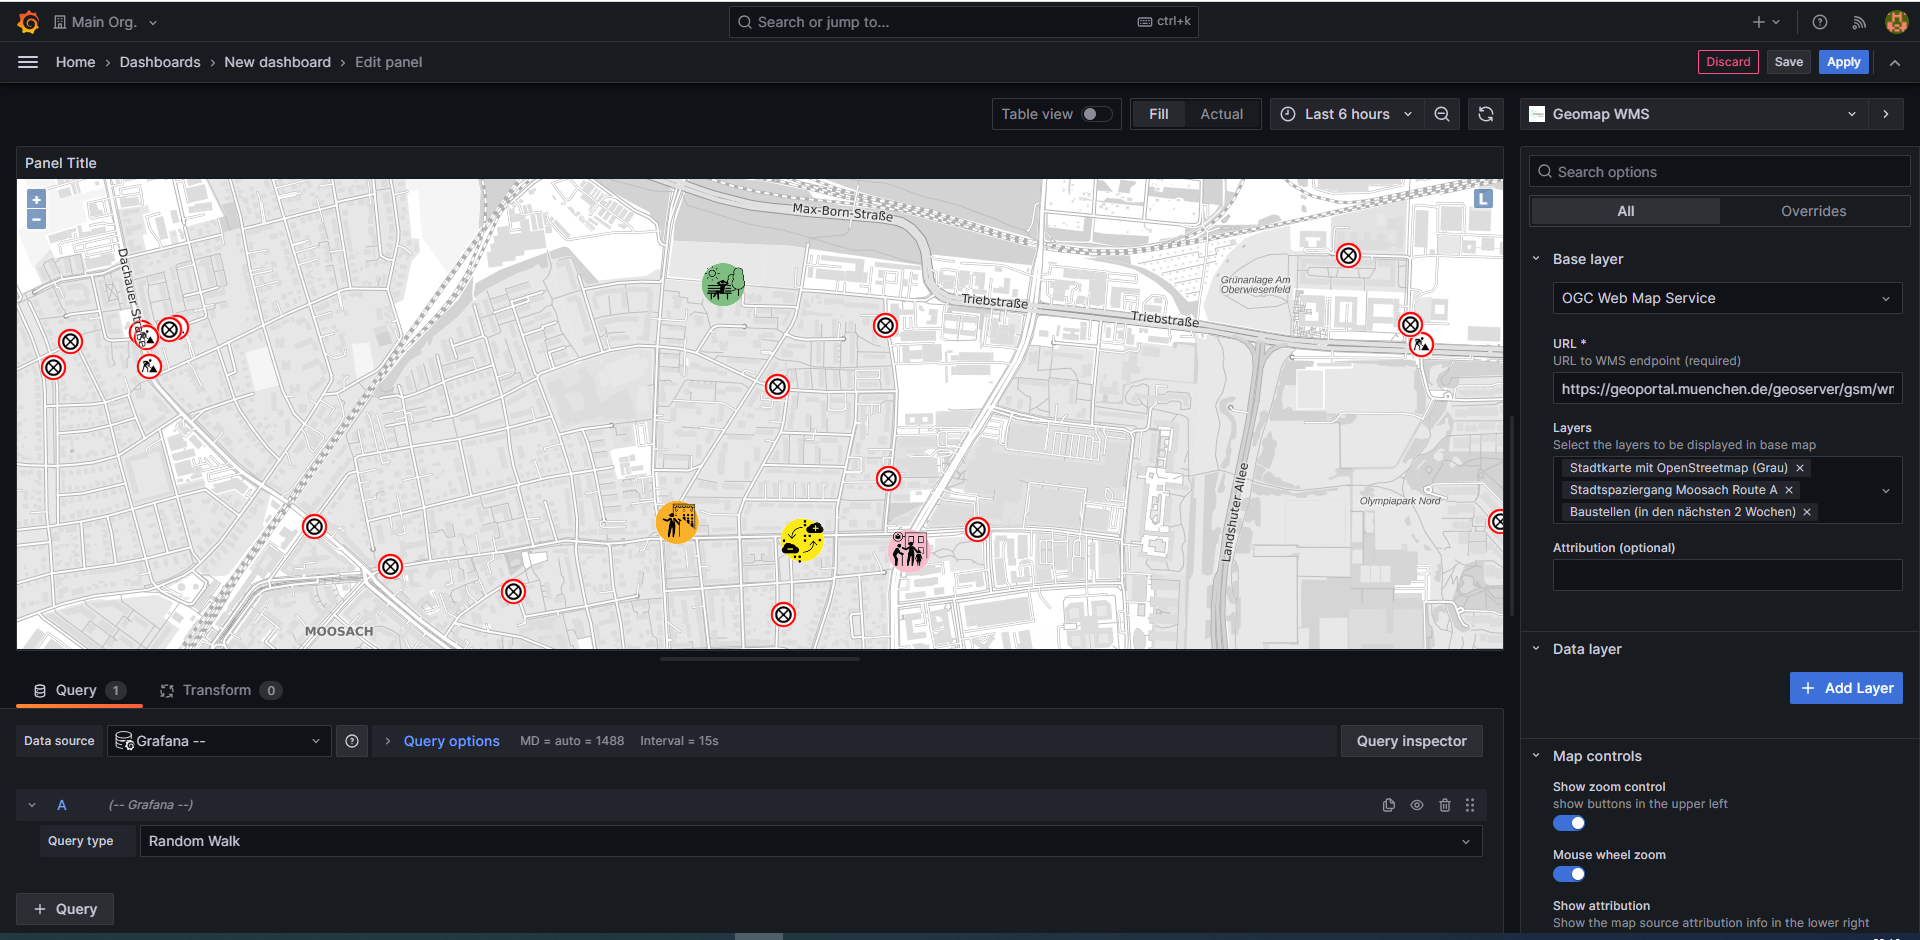
- In the selection Base layer choose the type OGC Web Map Sevice
- In the text field URL type in the base url of the WMS endpoint (NOTE: Only the URL of the service endpoint WITHOUT request parameters, z.B. https://geoportal.muenchen.de/geoserver/gsm/wms)
- Successively choose layers from the drop down list
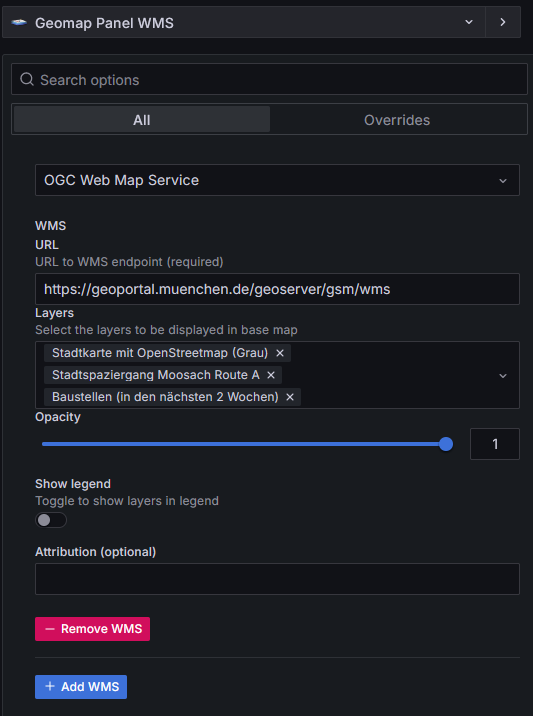
Layer names:
- g_stadtkarte_gesamt_gtay
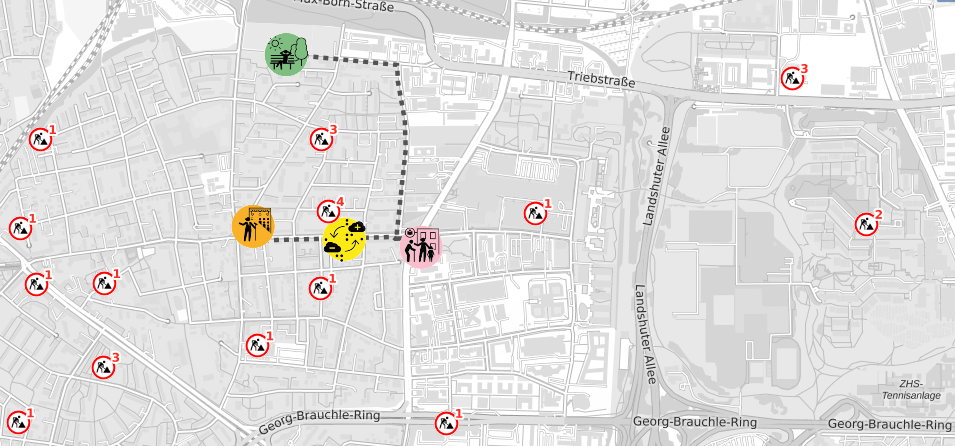
- g_stadtspaziergang_moosach_route_a
- baustellen_2_weeks
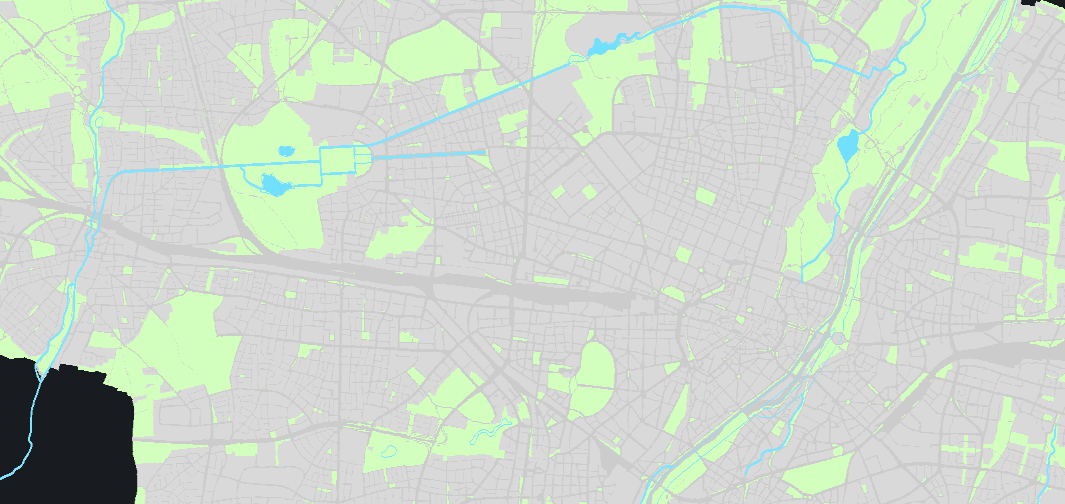
Layer names:
- Blöcke
- Linie_u_Stadtplanü. bis 150k
- stehende Gewässer generalisiert
In some occasions it might be necessary to join mutliple datasource queries into one output dataset to summarize information coming from different sources in a single map layer. This can be achieved by applying transformations on the returned data frames.


This often results in data structure like the following which might be inspected in the debug view in the transformations panel missing the metadata properties like query "name" and "refId".

The above data structure is not compatible with Geomap Panel Plugin's query input which expects either a data frame with metadata fields like "refId" or "meta".

A workaround to solve this problem is to use the prepare time series transformation with the setting "Wide time series" as last transformation in the processing chain.

This adds a "meta" field to the data object and therefore can now be processed by the Geomap Panel Plugin.

An additional feature of the Geomap WMS Plugin is the spatial filter tool that allows drawing a polygon on the map panel to be used as filter for a data query. The polygon is representated as Well-known-text (WKT) and stored in a dashboard variable "geomap_wms_spatial_filter_geometry".
⚠️ It is mandatory to name the dashbaord variable "geomap_wms_spatial_filter_geometry"⚠️
⚠️ The spatial filter tool uses the geographic coordinate system urn:ogc:def:crs:OGC::CRS84 with the axis order longitude, latitude. Openlayers (dependency of the geomap plugin) uses the CRS CSR:84 as alias for EPSG:4326 (source), even if the official axis order of EPSG:4326 defines latitude, longitude. This is because the Proj4Js-Library uses the order[x=longitude,y=latitude]by default.⚠️
To enable the spatial filter tool follow the steps below:
- Create a dashboard variable of type "Constant" and the name "geomap_wms_spatial_filter_geometry" (the spatial filter tool will update this variable internally and as for now does not provide the functionality of setting a different variable name externally). As initial value use e.g.
POLYGON((-180 -90,180 -90,180 90,-180 90,-180 -90)), to selec all, if no polygon is drawn.

- Use the dashboard variable in a datasource query, e.g. the SensorThings API, which allows the filtering by providing a WKT in the geometry function:
/Things?$expand=Locations&$filter=substringof(name,'${tree_sensor:csv}') and st_intersects(Locations/location, geography'${geomap_wms_spatial_filter_geometry}')

- Enable the tool in the panel editor, press save or apply and leave edit mode

- Activate the tool in the panel

- Draw a polygon as spatial filter geometry. To apply the geometry set the last point on the starting point. After that the panels and datasources which use the variable "geomap_wms_spatial_filter_geometry" are updated automatically. To delete the geometry click on the cross symbol.


The Geomap WMS Panel Plugin allows the use of dataLinks to update a dashboard variable with data of the clicked feature. This enables interactions between the map panel and other panels in the dashbaord, which use the same dashboard variable in their data queries. To make use of this functionality a datalink has to be created (see the official documentation) on how to do that.
⚠️ As of now the plugin is only able to handle 1 (the first) data link⚠️
This example demonstrates how to configure the Geomap WMS Panel Plugin to update a dashboard variable "ladestationen" with the value of the data field of name "name" by clicking on a feature on the map.


Clicking on a certain feature on the map results in both, updating the map as well as all the panels which use the dashboard variable "ladestationen" in their queries.
Before:

After:

This repository refers to the following version of its original: https://github.com/orchestracities/map-panel/tree/c0d3a19ce910b9c3ab8416f5a609afb10ff8c0fe
- Grafana >= 10.0.2 as Docker container with bind mounts to host filesystem mounting following conatiner directory /var/lib/grafana/plugins
- node v20.3.1
- npm 10.5.0
- Linux-based OS Windows with WSL
- Clone the repository
git clone https://github.com/felix-mu/geomap-wms-panel.git- Navigate in the directory geomap-wms-panel
cd ./geomap-wms-panel- Install the node modules
npm install- Run build script
npm run buildRepeat the steps 1 to 3 from Building the plugin.
Then run:
npm run devThe packed plugin (either production build or development build) is found in the output folder ./felixrelleum-geomapwms-panel.
To allow grafana to load an unsigned plugin the container environment variable GF_PLUGINS_ALLOW_UNSIGNED_PLUGINS=<comma separated list of plugin-ids> must be set to "felixrelleum-geomapwms-panel".
Additionally it is required to configure a bind mount of the plugins container directory to the host filesystem where the bundled Geomap WMS Panel Plugin is located.
Shortcut:
Run the docker-compose.yaml with docker compose up
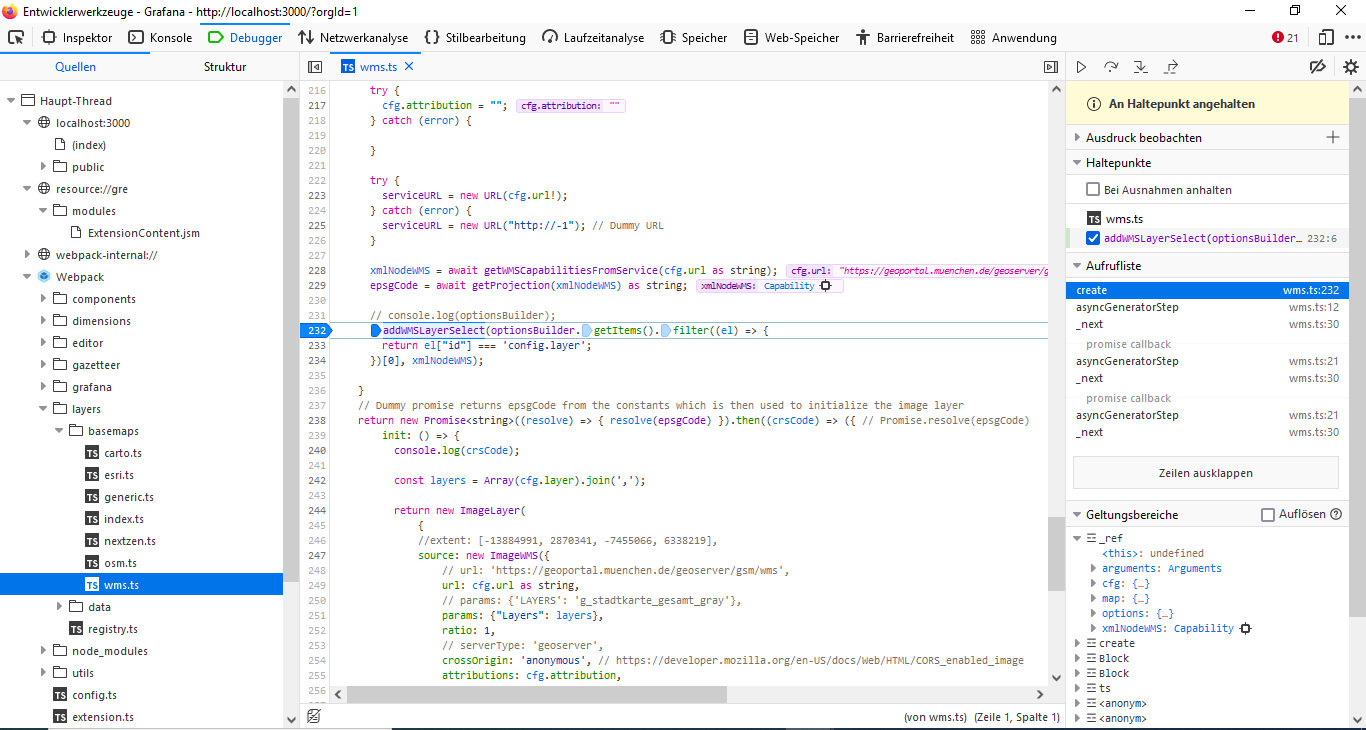
If the plugin was build with npm run dev the Webpack directories are loaded to the browser. This enables the use of developmer tools of the browser to set breakpoints and debug the plugin source code (it is recommended to deactivate the cache).
After each build the Docker-Container must be restarted to reload the new version of the plugin. If the changes of the plugin are not noticed it might help to clear the browser cache and refresh the page.
See Contributing guide for how to contribute to the project.
