Code Monkey home page Code Monkey logo

timeshap's Introduction

TimeSHAP

PyPI version Downloads

TimeSHAP is a model-agnostic, recurrent explainer that builds upon KernelSHAP and extends it to the sequential domain. TimeSHAP computes event/timestamp- feature-, and cell-level attributions. As sequences can be arbitrarily long, TimeSHAP also implements a pruning algorithm based on Shapley Values, that finds a subset of consecutive, recent events that contribute the most to the decision.

This repository is the code implementation of the TimeSHAP algorithm present in the paper TimeSHAP: Explaining Recurrent Models through Sequence Perturbations published at KDD 2021.

Links to the paper here, and to the video presentation here.

Install TimeSHAP

Via Pip
pip install timeshap
Via Github

Clone the repository into a local directory using:

git clone https://github.com/feedzai/timeshap.git

Move into the cloned repo and install the package:

cd timeshap
pip install .
Test your installation

Start a Python session in your terminal using

python

And import TimeSHAP

import timeshap

TimeSHAP in 30 seconds

Inputs

  • Model being explained;
  • Instance(s) to explain;
  • Background instance.

Outputs

  • Local pruning output; (explaining a single instance)
  • Local event explanations; (explaining a single instance)
  • Local feature explanations; (explaining a single instance)
  • Global pruning statistics; (explaining multiple instances)
  • Global event explanations; (explaining multiple instances)
  • Global feature explanations; (explaining multiple instances)

Model Interface

In order for TimeSHAP to explain a model, an entry point must be provided. This Callable entry point must receive a 3-D numpy array, (#sequences; #sequence length; #features) and return a 2-D numpy array (#sequences; 1) with the corresponding score of each sequence.

In addition, to make TimeSHAP more optimized, it is possible to return the hidden state of the model together with the score (if applicable). Although this is optional, we highly recommended it, as it has a very high impact. If you choose to return the hidden state, this hidden state should either be: (see notebook for specific examples)

  • a 3-D numpy array, (#rnn layers, #sequences, #hidden_dimension) (class ExplainedRNN on notebook);
  • a tuple of numpy arrays that follows the previously described characteristic (usually used when using stacked RNNs with different hidden dimensions) (class ExplainedGRU2Layer on notebook);
  • a tuple of tuples of numpy arrays (usually used when using LSTM's) (class ExplainedLSTM on notebook);; TimeSHAP is able to explain any black-box model as long as it complies with the previously described interface, including both PyTorch and TensorFlow models, both examplified in our tutorials (PyTorch, TensorFlow).

Example provided in our tutorials:

  • TensorFLow
model = tf.keras.models.Model(inputs=inputs, outputs=ff2)
f = lambda x: model.predict(x)
  • Pytorch - (Example where model receives and returns hidden states)
model_wrapped = TorchModelWrapper(model)
f_hs = lambda x, y=None: model_wrapped.predict_last_hs(x, y)
Model Wrappers

In order to facilitate the interface between models and TimeSHAP, TimeSHAP implements ModelWrappers. These wrappers, used on the PyTorch tutorial notebook, allow for greater flexibility of explained models as they allow:

  • Batching logic: useful when using very large inputs or NSamples, which cannot fit on GPU memory, and therefore batching mechanisms are required;
  • Input format/type: useful when your model does not work with numpy arrays. This is the case of our provided PyToch example;
  • Hidden state logic: useful when the hidden states of your models do not match the hidden state format required by TimeSHAP

TimeSHAP Explanation Methods

TimeSHAP offers several methods to use depending on the desired explanations. Local methods provide detailed view of a model decision corresponding to a specific sequence being explained. Global methods aggregate local explanations of a given dataset to present a global view of the model.

Local Explanations

Pruning

local_pruning() performs the pruning algorithm on a given sequence with a given user defined tolerance and returns the pruning index along the information for plotting.

plot_temp_coalition_pruning() plots the pruning algorithm information calculated by local_pruning().

Event level explanations

local_event() calculates event level explanations of a given sequence with the user-given parameteres and returns the respective event-level explanations.

plot_event_heatmap() plots the event-level explanations calculated by local_event().

Feature level explanations

local_feat() calculates feature level explanations of a given sequence with the user-given parameteres and returns the respective feature-level explanations.

plot_feat_barplot() plots the feature-level explanations calculated by local_feat().

Cell level explanations

local_cell_level() calculates cell level explanations of a given sequence with the respective event- and feature-level explanations and user-given parameteres, returing the respective cell-level explanations.

plot_cell_level() plots the feature-level explanations calculated by local_cell_level().

Local Report

local_report() calculates TimeSHAP local explanations for a given sequence and plots them.

Global Explanations

Global pruning statistics

prune_all() performs the pruning algorithm on multiple given sequences.

pruning_statistics() calculates the pruning statistics for several user-given pruning tolerances using the pruning data calculated by prune_all(), returning a pandas.DataFrame with the statistics.

Global event level explanations

event_explain_all() calculates TimeSHAP event level explanations for multiple instances given user defined parameters.

plot_global_event() plots the global event-level explanations calculated by event_explain_all().

Global feature level explanations

feat_explain_all() calculates TimeSHAP feature level explanations for multiple instances given user defined parameters.

plot_global_feat() plots the global feature-level explanations calculated by feat_explain_all().

Global report

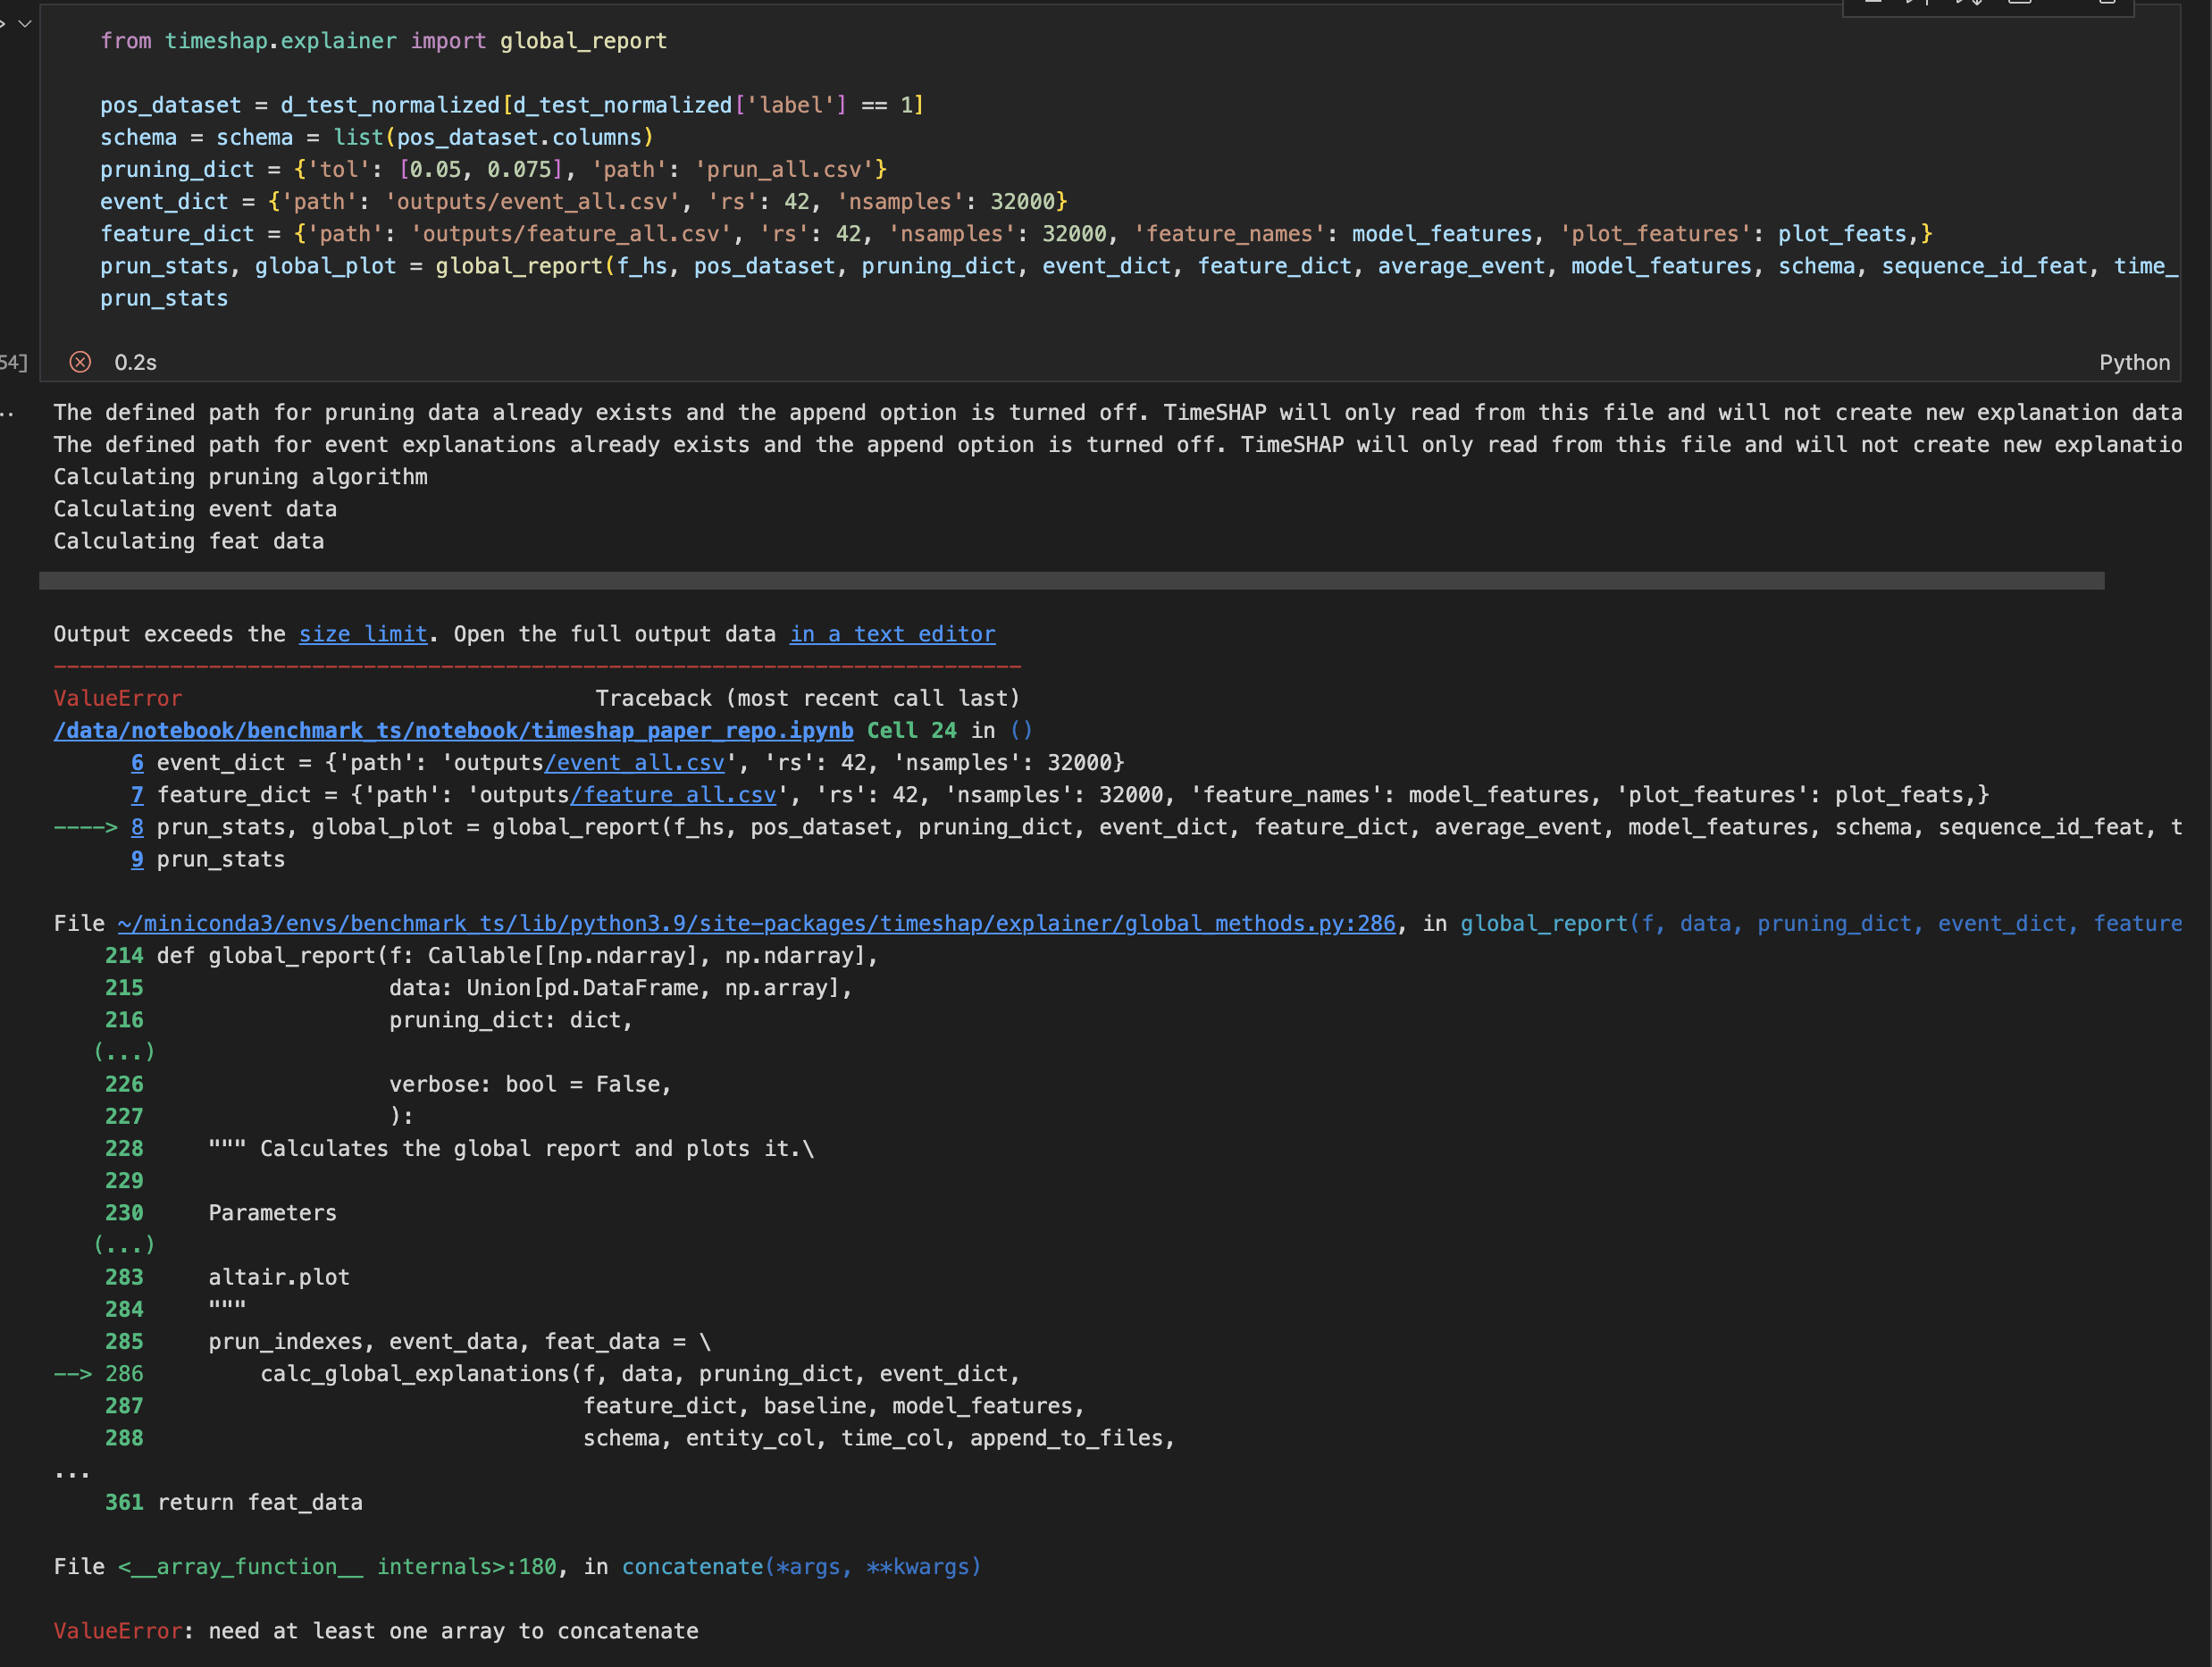
global_report() calculates TimeSHAP explanations for multiple instances, aggregating the explanations on two plots and returning them.

Tutorial

In order to demonstrate TimeSHAP interfaces and methods, you can consult AReM.ipynb. In this tutorial we get an open-source dataset, process it, train Pytorch recurrent model with it and use TimeSHAP to explain it, showcasing all previously described methods.

Additionally, we also train a TensorFlow model on the same dataset AReM_TF.ipynb.

Repository Structure

Citing TimeSHAP

@inproceedings{bento2021timeshap,
    author = {Bento, Jo\~{a}o and Saleiro, Pedro and Cruz, Andr\'{e} F. and Figueiredo, M\'{a}rio A.T. and Bizarro, Pedro},
    title = {TimeSHAP: Explaining Recurrent Models through Sequence Perturbations},
    year = {2021},
    isbn = {9781450383325},
    publisher = {Association for Computing Machinery},
    address = {New York, NY, USA},
    url = {https://doi.org/10.1145/3447548.3467166},
    doi = {10.1145/3447548.3467166},
    booktitle = {Proceedings of the 27th ACM SIGKDD Conference on Knowledge Discovery & Data Mining},
    pages = {2565–2573},
    numpages = {9},
    keywords = {SHAP, Shapley values, TimeSHAP, XAI, RNN, explainability},
    location = {Virtual Event, Singapore},
    series = {KDD '21}
}

timeshap's People

Contributors

andrefcruz avatar joaopbsousa avatar rma-rripken avatar saleiro avatar

Stargazers

 avatar  avatar  avatar  avatar  avatar  avatar  avatar  avatar  avatar  avatar  avatar  avatar  avatar  avatar  avatar  avatar  avatar  avatar  avatar  avatar  avatar  avatar  avatar  avatar  avatar  avatar  avatar  avatar  avatar  avatar  avatar  avatar  avatar  avatar  avatar  avatar  avatar  avatar  avatar  avatar  avatar  avatar  avatar  avatar  avatar  avatar  avatar  avatar  avatar  avatar  avatar  avatar  avatar  avatar  avatar  avatar  avatar  avatar  avatar  avatar  avatar  avatar  avatar  avatar  avatar  avatar  avatar  avatar  avatar  avatar  avatar  avatar  avatar  avatar  avatar  avatar  avatar  avatar  avatar  avatar  avatar  avatar  avatar  avatar  avatar  avatar  avatar  avatar  avatar  avatar  avatar  avatar  avatar  avatar  avatar  avatar  avatar  avatar  avatar  avatar

Watchers

 avatar  avatar  avatar  avatar  avatar  avatar  avatar  avatar  avatar  avatar  avatar  avatar  avatar

timeshap's Issues

TimeSHAP on regression sequence model

Hello again @JoaoPBSousa!
Thanks for your help last time.

With your help I was working on the implementation of TimeSHAP on my model.
However, I encountered another problem and I think it seems like I have to ask you about this before any continuation.

My model is a regression model with GRU.
It is a regression model predicting medicine concentration in patients' body with multiple injections and multiple check-ups.
For example, patient A might go through 4 concentration check-ups and before each check-up, this patient would go through medicine injections where the number of injections varies each time.
Below is an example of 4 checkups with different number of injections prior to each checkup.
(injection1 - injection2 - injection3 - checkup1 - injection4 - injection5 - checkup2 - injection6 - checkup3 - injection7 - injection8 - injection9 - injection10 - checkup4[end])

Then, my model would have predictions at each checkup, meaning that this sequence would have 4 regression results with the last one being the most important.
So, if only one regression output may be used, I can certainly take the last result.

If I am not mistaken, I believe both of your examples(bank account and AReM) are classification cases?
I want to ask if I could use TimeSHAP in my model under this condition.

One more thing to ask is while running the code, I received a message "Score difference between baseline and instance is too low < 0.1...Consider choosing another baseline."
I have seen another issue post with this and found that I could either Skip the pruning algorithm or Change the baseline sequence.
Would the change the baseline sequence be only possible with classification case?

I hope my explanations and questions are clear.
Thank you so much for your kind help.
I really appreciate it!

error reimplementing the pytorch jupyter example

Hello, thank you for sharing a detailed explanation of your work.
Currently, I am facing two issues.

  1. Running the Arem.ipynb results in the following error

스크린샷 2023-03-24 오후 2 46 05

  1. Does your TimeSHAP algorithm only work on binary classification? is there a reason for using only two class in the pytorch example?

Thank you for your time.

Intuition around pruning/baseline selection

While calculating a global report, I'm currently running into errors that "Score difference between baseline and instance is too low < 0.1...Consider choosing another baseline." My baselines have been the average_event and average_sequence. I also notice that occasionally the values in the error change with different pruning tolerance, but not in a consistent way. Do you have advice for dealing with this?
Thanks.

About part of input in the next step is the output of current step

Hi, thank you so much for your work. It inspires me a lot. As most of the LSTM use case is using the output of last time step and concatenate it with current features, which can lead to better performance. Especially in the infectious disease field, we concatenate the output of current time step (newly infected cases) with the covariates of the next time step. I want to ask in this case, how can I use timeshap? Thank you

Doubts on provided notebook: dataset format, model configuration

Hello again!

By following the notebook you provide and trying to adapt TimeSHAP to my use case, I have come across a few doubts.

1. Regarding the format of the dataset.

In the model interface provided, it is referred that

In order for TimeSHAP to explain a model, an entry point must be provided. This Callable entry point must receive a 3-D numpy array, (#sequences; #sequence length; #features) and return a 2-D numpy array (#sequences; 1) with the corresponding score of each sequence.

It is the sort of dataset I am using too.

Returning back to the notebook, I started to analyse how the data was arranged in order to use the framework (please correct me if there is something wrong):

  • There are two dataframes containing the manipulated data, d_train and d_test;
  • You use d_train to train the ExplainedRNN model and d_test to generate explanations (normalised when there is the need to it);
  • Each sequence is identified by a key, given by the all_id feature;
  • Each element of each sequence is identified by the feature named timestamp.
  • Each element of each sequence has got a label feature.

My doubt resides on this last point:

  • This label feature does not reflect the classification of each timestamp, but rather the classification attributed to the sequence as a whole (the intended use case), right?
    • this setting allows having different elements of one sequence classified differently? (not the intended use case, just curious)
    • one should propagate the classification of each sequence throughout all its elements?

2. Regarding one of the provided use cases

In the model interface, there is a reference to an ExplainedLSTM model

a tuple of tuples of numpy arrays (usually used when using LSTM's) (class ExplainedLSTM on notebook);;

So I found it on the API showcase notebook. This model is very similar to the ones I am using (LSTM + Linear layer; TransformerEncoder + Linear layer)

I tried to run the notebook selecting this model, but it failed to run on cell (sorry to paste the code here; notebook referencing on issues should be easier to do...)

from timeshap.utils import get_avg_score_with_avg_event
avg_score_over_len = get_avg_score_with_avg_event(f_hs, average_event, top=480)

with error
RuntimeError: For batched 3-D input, hx and cx should also be 3-D but got (2-D, 2-D) tensors

But if it runs with the ExplainedRNN model, it should only be a little issue with the ExplainedLSTM one.

3. Regarding model adaptation

I have developed my models using pytorch, however there is a small difference with yours: given that I am using torch's BCEWithLogitsLoss, my models lack the application of sigmoid inside the model, as you do with ExplainedRNN.
The solution I have been following with other explainability frameworks is to build a Wrapper around my models, where I apply the sigmoid function and convert to numpy.ndarray if necessary. I noticed that you too provide a wrapper to torch models, so I was wondering if it would be possible to integrate the two solutions.

Sorry for the long issue (I was almost willing to write each point in a separated issue) and thanks for reading!

PS: I am also using a variation of my models, where they handle variable-length sequences. Some explainability tools sometimes are a bit hard to use on this scenario, but I believe yours is not the case I took a look at #28 already):

  • Using a timestamp feature on your dataset allows for that use case - different sequences may have different lengths, where each element is identified by the pair (key, timestep) - in your notebooks the pair (all_id, timestamp).

(just wanting to be sure about it :) )

Function to get expected value

A utility function to get the expected value will be useful to cross verify that the obtained shap values of the model are correct. Currently it needs to be explicitly obtained from the timeshapkernel.

timeshap_kernel, synth_hidden_states issue

hello, great work but there just little thing really confuse me when reading your code, from line 688 to 690 in timeshap_kernel.py,

if not self.mode == 'pruning' and self.returns_hs:
hidden_sates = self.synth_hidden_states[self.nsamplesRun * self.N:self.nsamplesAdded * self.N,:, :]
modelOut, _ = self.model.f(data, hidden_sates)

since the second dimension of self.synth_hidden_states is directly linked to self.nsamples, to create space for nsamples of enumerated feature combinations, I think hidden_sates = self.synth_hidden_states[:, self.nsamplesRun * self.N:self.nsamplesAdded * self.N, :] makes more sense to me whereas your code is doing the indexing on the first dimension.

Could you guys let me know if I understand it correctly? thanks and great work agian.

local_event report

Hi,

  1. I tried to call the function local_event but I am wondering if you consider that the sequences are ordered in ascending order according to the time.
    In my case, sequences are ordered in descending order.
    Example: [event5, event4, event3, event2, event1] where event5 is the last event and event1 is the oldest event
    But when I get the output of local_event function, it looks to be in ascending order.

  2. One more thing, what about the padding? Is there a parameter for that, similar to mask_zero=True

Thank you for your help

Error in running the example notebook (AReM_TF)

Nice work!
I have been trying to run one of the tutorial notebooks in the repository (i.e., AReM_TF), but I faced an error. The notebook chunk that produces the error is:

from timeshap.explainer import local_report, local_pruning

pruning_dict = {'tol': 0.025}
event_dict = {'rs': 42, 'nsamples': 320}
feature_dict = {'rs': 42, 'nsamples': 320, 'feature_names': model_features, 'plot_features': plot_feats}
cell_dict = {'rs': 42, 'nsamples': 320, 'top_x_feats': 2, 'top_x_events': 2}
local_report(f, pos_x_data, pruning_dict, event_dict, feature_dict,cell_dict=cell_dict, entity_uuid=positive_sequence_id, entity_col='all_id', baseline=average_event)

and the produced error is as follows:
image
image

It would be great if you could help me with this error.

KeyError when defining top_x_feats less than feature count in dataset in feature_dict and caling plot_global_feat

Hi,

Referring to the code block below for Global feature-level adapted from AReM.ipynb

feature_dict = {'path': 'outputs/feature_all.csv', 'rs': 42, 'nsamples': 32000, 'feature_names': model_features, 'plot_features': plot_feats, 'top_x_feat': 3}
feat_data = feat_explain_all(f_hs, pos_dataset, sequence_id_feat, average_event, feature_dict, prun_indexes, model_features, time_feat)
feat_global_plot = plot_global_feat(feat_data, **feature_dict)
feat_global_plot

When I define top_x_feat as less than the number of features in the dataset, i.e: 3, in the feature_dict, there is an error KeyError: '(...)' when calling plot_global_feat.

Unable to install timeshap package

Hello @feedzaiadmin , @saleiro ,

I am unable to run command "pip install timeshap" on my ubuntu system. It throws me below error:

ERROR: Could not find a version that satisfies the requirement timeshap (from versions: none)
ERROR: No matching distribution found for timeshap

Seems to me a compatibility issue. I have tried with python versions - 3.6,3.8.
Is there any specific version which supports it? Will be waiting for response.

Thanks

Apply Timeshap without pruning

Hi,
I would like to use Timeshap on my LSTM model fitted on sequences of events (we are using one feature only).
Our model is working well but since it is a black box model, we want to find a way to explain it.
I want to know if we can apply Timeshap because the sequence of events we are using includes the last occurrence of each event
so we have sequences of distinct events.
As we are using distinct sequences of events only, we don't want to apply the pruning algorithm.
Could you show me how I can get local/global reports without using any pruning
Thank you

Tensorflow notebook, Local Report on positive instance error

Hi, thanks so much for the extensive documentation of your work.

When running the tensorflow notebook however, I get the following error for the shown cell of the notebook. The only modification to the notebook was retrieving the csv files from google drive where they are located. I saw this was similar to a closed issue, my pandas version is 1.4.4, it did however work when I installed pandas 1.3.2 so it does seem to be an issue with the pandas version as you suspected.

Thank you so much.

1
2
3

Timeshap for regression

I am working on a time series forecasting problem using LSTM. Can I use timeshap for such a regression problem? Do you by chance have a demo for regression?

Thanks

Issue in reproducing TimeSHAP Tutorial - TensorFlow - AReM dataset

Foremost, thanks for the library, really great job!

I am trying to reproduce your TimeSHAP Tutorial for TF and I am having an issue in the section for Global Explanations when running the global_report() function - screen below:

image

The error refers to encoding the \u2264 character which is a sign: <=. I was trying to solve that myself by modifying the pruning.py function according to the error by adding encoding="utf-8" in line 326 with open(file_path, 'a', newline='') as file:, however it didn't solve the problem. Any advice is very welcome!

Also, for consistency, I want to mention that I had a problem loading the data - showing the error screens below. I was able to solve the problem only by deleting 2 datasets: cycling/dataset9.csv and cycling/dataset14csv and the rest of the code worked.

1/2
image
2/2
image

BlockRNN for regression

Is it possible to apply this algorithm to BlockRNN regression? Is there some notebook with and example? I try to explain my BlockRNN regression model but I found several difficulties.

Array indexing with list of strings.

Hello! First of all thanks for your work on the development of this project. I have been trying to use your code to generate explanations for an LSTM model.

I have been following the notebook you provide and adapting it to my use case.

To generate global feature explanations, you make use of the function

def feat_explain_all(f: Callable,
data: Union[List[np.ndarray], pd.DataFrame, np.array],
feat_dict: dict,
pruning_data: pd.DataFrame,
baseline: Union[pd.DataFrame, np.array] = None,
model_features: List[Union[int, str]] = None,
schema: List[str] = None,
entity_col: Union[int, str] = None,
time_col: Union[int, str] = None,
append_to_files: bool = False,
verbose: bool = False,
) -> pd.DataFrame:

I have been calling with with the arguments suited to my use case, specifically providing it the model_features
argument (a list of strings)

model_features: List[str]
Features to be used by the model. Requires same order as training dataset

and it generates the following error:

line 327, in feat_explain_all
    sequence = sequence[:, :, model_features]
IndexError: only integers, slices (`:`), ellipsis (`...`), numpy.newaxis (`None`) and integer or boolean arrays are valid indices

This is the line of code:

if model_features:
sequence = sequence[:, :, model_features]

I have noticed that you create indices above and never use the variable model_features_index

model_features_index, entity_col_index, time_col_index = convert_to_indexes(model_features, schema, entity_col, time_col)

It makes sense that the array should be accessed with these indexes, rather than with a list of strings, is that it?

Is timeshap applicable to the DeepAR model of mxnet?

Hello.
I want to use TimeSHAP to get Feature Importance during multivariate time series predictive analysis with DeepAR model in GluonTS, based on mxnet.

According to the description, I need to use model wrapper, is it applicable to mxnet as well?

I tried TorchModelWrapper, TimeSHAPWrapper in base_wrapper. But I get an error in the parameters property of pytorch.
I was wondering if there is a workaround for this.

Thanks.

TIMESHAP without pruning

Will TimeSHAP without pruning and a single feature (like a time series) give the same results as KERNELSHAP?

global_explainer broken?

Hi,

I was running the example notebook: AReM_API_showcase. I made no modifications to the code, but it breaks when I get to the global explainer.
image

Problems adopting TimeSHAP in an attribution model

Hello,

First of all, great job! I am adopting your solution to my problem. In my case I have a regression model (lstm) that calculates a number of sales that I then have to distribute among each of the predictor features (according to their weight, given by the SHAP value).

At the point where I am at three questions arise.

  1. The example you show with your fraud detection data is about a classification example. Would there be any modifications to be made to bring it to our problem? Example: the shapley values that you obtain are between 0 and 1, because the prediction is always in this range in your case, and your plots are prepared for this scale. In my case, my target does not have a defined range and making a standardization of the target I do not know if it could disturb my current results. Moreover, standardizing the target does not ensure to have target values in that range for the test data.

  2. From the data you load I see that you use a fixed look_back (length of each sequence), while for me it is a parameter that I play with to include more or less information and that the lstm learns more or less from the past. Does this affect anything (prunning algorithm, etc.)?

  3. Another question I have is about the interpretability of the SHAP values. How, from the SHAP values obtained (both in the temporal dimension and at the feature level), could I make an attribution of the predicted quantity to each of the predictor features? Or in other words, how are these SHAP values interpreted quantitatively? Since I see that in most occasions the analyses only focus on seeing which characteristics influence more or less the prediction, but not how much more or less with respect to the rest.

Sorry for the extension and thank you very much for your contribution.
Antonio

TypeError: plot_global_event not propogating plot_parameters correctly

Hi,
First of all, awesome package!
I was able to already create interesting visualizations.

Currently, I run into an error concerning the plot_global_event method in src/timeshap/plot/event_level.py, which raises an TypeError when I pass a dictionary with plot_parameters, see snippet below,

plot_params = {'width': 500, 'height': 500}
event_global_plot = plot_global_event(event_global_data, plot_params)
event_global_plot

This raises the following error:

TypeError: plot() takes 2 positional arguments but 3 were given

The issue occurs at the following line in the multi_plot_wrapper method, where the plot method wrapped in plot_global_event is called:

param_plot = method(filtered_data, {}) if parameters is None else method(filtered_data, *parameters)

I have been trying some ideas to correctly pass the plot_parameters dictionary, but without success.
Do you have any suggestion for a solution?

Plot Coalition Pruning is not working

Hi,
I am doing a project as part of a Master Thesis: I was testing your introductory notebook with the Tensorflow implementation, but this is not working because of an error raised by one of yours plot functions. The funny thing is that your other notebook, i.e., the one with the torch model, is working fine. I managed to find the issue and it was raised by an inner method called solve_negatives_method in src/timeshap/plot/pruning.py which would raise an InvalidKeyError caused by this specific row:

    df.at[corresponding_row.index, 'Shapley Value'] = corresponding_row['Shapley Value'].values[0] + row['Shapley Value']

As far I understood, we are passing a list, usually made of only one value, to the pandas.DataFrame.at method which requires to pass an integer parameter and a column identifier. As such, one solution that works now could be:

    df.at[corresponding_row.index[0], 'Shapley Value'] = corresponding_row['Shapley Value'].values[0] + row['Shapley Value']

I want to thank you very much for the work done, and I will be happy to discuss further result of my thesis with you. :)
Hoping for the best and looking forward to hear from you,
Eric

TimeSHAP for text?

I'm working with a 1-layer GRU for text classification that takes BERT embeddings at the input. Each input sequence is of the shape (sequence length, bert-embedding-dimension). I'm looking for word level attribution scores for each sequence's prediction. Currently with the captum integrated gradients and occlusion explainers, I get attribution scores that are almost always the last few words of each sequence. This seems like it's stemming from the directional processing of GRU - any thoughts?

Do you think TimeSHAP would be applicable for my use case? I suppose I could consider each word as an event and each embedding dimension as a feature, then I could use the event level local explanations from the library?
However, note that in my case, the events (i.e words) from the beginning of the sequence could be more important than those at the end of the sequence (i.e. most recent ones) - this violates the assumptions you use for your approximation (i.e pruning), so perhaps it's not applicable to text?

will it work for Tensorflow

Hi, is this update issue "np.int was a deprecated alias for the builtin int. To avoid this error in existing code, use int by itself" resolved yet.

Lack support for shap > 0.42.1

Due to renaming of explainers in shap 0.43.0, TimeSHAP logic fails when the default pip install is used:

---------------------------------------------------------------------------
ImportError                               Traceback (most recent call last)
Cell In[24], line 1
----> 1 from timeshap.explainer import local_report
      3 pruning_dict = {'tol': 0.025}
      4 event_dict = {'rs': 42, 'nsamples': 32000}

File ~\anaconda3\envs\env\lib\site-packages\timeshap\explainer\__init__.py:15
      1 #  Copyright 2022 Feedzai
      2 #
      3 #  Licensed under the Apache License, Version 2.0 (the "License");
   (...)
     12 #  See the License for the specific language governing permissions and
     13 #  limitations under the License.
---> 15 from .kernel import *
     16 from .pruning import *
     17 from .event_level import *

File ~\anaconda3\envs\env\lib\site-packages\timeshap\explainer\kernel\__init__.py:15
      1 #  Copyright 2022 Feedzai
      2 #
      3 #  Licensed under the Apache License, Version 2.0 (the "License");
   (...)
     12 #  See the License for the specific language governing permissions and
     13 #  limitations under the License.
---> 15 from .timeshap_kernel import TimeShapKernel

File ~\anaconda3\envs\env\lib\site-packages\timeshap\explainer\kernel\timeshap_kernel.py:53
     51 from shap.utils._legacy import convert_to_link, IdentityLink
     52 from shap.utils._legacy import convert_to_instance, convert_to_model
---> 53 from shap.explainers._kernel import Kernel
     54 from scipy.special import binom
     55 from scipy.sparse import issparse

ImportError: cannot import name 'Kernel' from 'shap.explainers._kernel' (C:\Users\user\anaconda3\envs\env\lib\site-packages\shap\explainers\_kernel.py)

how to generate output/event_all.csv file or run event_explain_all?

Hi,
I am trying to use event_explain_all function of TimeSHAP with event_dict = {'rs': [42], 'nsamples': [32000]} and I get the error:
IndexError: only integers, slices (:), ellipsis (...), numpy.newaxis (None) and integer or boolean arrays are valid indices

If I add a path to the event dictionary, I can run the function without getting any error but then I get an empty output since the path I added doesn't exist
How do you generate the output/event_all.csv file?
Are you familiar with this error?
Thanks

"Pruned Events" vs "Other Events" vs "Other Features"

By looking at the cell_data dataframe, I am seeing two types of entry for the Event column, i.e., "Pruned Events" and "Other Events". Could you please explain how different they are?
image

My other question is that even if I set the top_x_feats in cell_dict to be total number of features in my data, still the cell_data data frame contains some rows in which there is a non-zero shap value for "Other Features", for example:
image
How is that possible? There shouldn't be any "Other Features" as I have all the features separately listed in the cell_data data frame.

CNN model

I currently have a CNN model, and previously had to do some strange hacking to get time series importance values. Your package now shines a better light on this issue. For multivariate forecasts CNNs still fair well, sometimes better than RNNs, from what I can see there is no reason why using CNNs won't working using your software. Let me know if I have that wrong.

How to adapt the transformation function to account for variable sequence length?

I am trying to use TimeSHAP on my use case. Per my understanding, in AReM example, the way you transform the data using the df_to_numpy function is to make a prediction for the last value of the sequence – see the screen below:

image
In the case of AReM tutorial data, the predictions are based on the whole sequence - all rows (rows ID 1-10) are being used for sequence ID 1 (light blue color) and the predictions are made for the Timestamp 10 (dark blue color; rows id 10). Later the light orange color is used (Row IDs 11-20) to predict a label marked as dark orange color (Row ID 20).

In the case of my use case, the model predicts on a rolling-window basis and I would need predictions for every row (not only for a sequence). See the screen and explanation below.
image
Let's say my rolling window is 6 and Row IDs 1-6 (light green) are used to predict row 7 (dark green), later Row IDs 2-7 (light grey) are being used to predict Row ID 8 (dark grey), etc. When a new Sequence starts, we repeat the process, so we take Row IDs 11-16 and predict Row ID 17, etc. For my use case, it's important to evaluate the predictions for every Row ID, not only for the whole sequence.

The problem which I am facing is that when I try to run the function get_avg_score_with_avg_event on the data defined as in the picture above I am getting the following error:
image

The way my data is transformed from 2D into 3D format is defined by the function below:
image

My question is whether it’s possible to make TimeSHAP work for the data which is transformed in a way described in my use case? When I use the transformation which is defined in your function df_to_numpy, I am not getting an error, however, it is not adapted to my use case.

How to speed up TIMESHAP computation

Hi all!

The package itself is really interesting and intuitive to use.
But I want to speed up TIMESHAP computation, Can I use gpu to calculate shapley values?
I used a device parameter in TorchModelWrapper, but efficiency of GPU is too low to accelerate TIMESHAP computation.
Any suggestion would be appreciated.

How to explain Scikit-learn logistic regression binary classification probability output using TimeSHAP?

Hi,

Thank you for the amazing work done in this repository. 🙂

In TimeSHAP documentation, it is written that the output that needs to be fed to TimeSHAP is of the shape (#sequences; 1). The PyTorch example uses a Linear layer with output dimension 1 and a Sigmoid layer at the end to generate a single value that conforms to TimeSHAP requirement.

I have a binary classification model where there is some initial processing done to a 3-D NumPy input, (#sequences; #sequence length; #features). In the last step, Scikit-learn Logistic Regression is used to make the predictions. The predictions are made through the predict_proba function in the Logistic Regression class. It returns (#sequences, 2) output where the probabilities of both the classes are returned as an array of two values where each row sums to a probability of 1. For instance, for sequence length of 3, the probabilities could be as following,

[
[0.3, 0.7],
[0.6, 0.4],
[0.2, 0.8],
]

How can the Scikit-learn Logistic Regression's probabilities be used for an explanation using TimeSHAP?

Thank you.

Circular Importing in ARem_TF.ipynb

It seems that there is some issue when calling the following import instruction (notebook AReM_TF.ipynb)

from timeshap.plot import plot_temp_coalition_pruning, plot_event_heatmap, plot_feat_barplot, plot_cell_level

ImportError Traceback (most recent call last)
Cell In[32], line 1
----> 1 from timeshap.plot import plot_temp_coalition_pruning, plot_event_heatmap, plot_feat_barplot, plot_cell_level
2 from timeshap.explainer import local_pruning, local_event, local_feat, local_cell_level
3 # select model features only

File ~/miniconda3/envs/tf_3_9/lib/python3.9/site-packages/timeshap/plot/init.py:20
18 from .feature_level import *
19 from .cell_level import *
---> 20 from .local_report import *
21 from .global_report import *

File ~/miniconda3/envs/tf_3_9/lib/python3.9/site-packages/timeshap/plot/local_report.py:16
14 import pandas as pd
15 from timeshap.plot import plot_temp_coalition_pruning, plot_event_heatmap, plot_feat_barplot, plot_cell_level
---> 16 from timeshap.explainer import prune_given_data
19 def plot_local_report(pruning_dict: dict,
20 event_dict: dict,
21 feature_dict: dict,
(...)
26 cell_data: pd.DataFrame = None,
27 ):
28 """Plots a local report given explanations
29
30 Parameters
(...)
54 Cell explanations to plot
55 """

File ~/miniconda3/envs/tf_3_9/lib/python3.9/site-packages/timeshap/explainer/init.py:20
18 from .feature_level import *
19 from .cell_level import *
---> 20 from .local_methods import *
21 from .global_methods import *

File ~/miniconda3/envs/tf_3_9/lib/python3.9/site-packages/timeshap/explainer/local_methods.py:18
16 import numpy as np
17 import pandas as pd
---> 18 from timeshap.plot import plot_local_report
19 from timeshap.explainer import local_pruning, local_event, local_feat, local_cell_level
20 from timeshap.utils import validate_input

ImportError: cannot import name 'plot_local_report' from partially initialized module 'timeshap.plot' (most likely due to a circular import)

Error when executing local_report on TF example: InvalidIndexError: Int64Index([1], dtype='int64')

Hi all!
When executing your TF example notebook without any changes, it fails at this line:
local_report(f, pos_x_data, pruning_dict, event_dict, feature_dict, cell_dict=cell_dict, entity_uuid=positive_sequence_id, entity_col='all_id', baseline=average_event)

with the following error: InvalidIndexError: Int64Index([1], dtype='int64')

Stack trace:

TypeError                                 Traceback (most recent call last)
File ~/opt/anaconda3/envs/timeshap/lib/python3.10/site-packages/pandas/core/indexes/base.py:3621, in Index.get_loc(self, key, method, tolerance)
   3620 try:
-> 3621     return self._engine.get_loc(casted_key)
   3622 except KeyError as err:

File pandas/_libs/index.pyx:136, in pandas._libs.index.IndexEngine.get_loc()

File pandas/_libs/index.pyx:142, in pandas._libs.index.IndexEngine.get_loc()

TypeError: 'Int64Index([1], dtype='int64')' is an invalid key

During handling of the above exception, another exception occurred:

InvalidIndexError                         Traceback (most recent call last)
Input In [27], in <cell line: 7>()
      5 feature_dict = {'rs': 42, 'nsamples': 32000, 'feature_names': model_features, 'plot_features': plot_feats}
      6 cell_dict = {'rs': 42, 'nsamples': 32000, 'top_x_feats': 2, 'top_x_events': 2}
----> 7 local_report(f, pos_x_data, pruning_dict, event_dict, feature_dict, cell_dict=cell_dict, entity_uuid=positive_sequence_id, entity_col='all_id', baseline=average_event)

File ~/temp/timeshap/src/timeshap/explainer/local_methods.py:139, in local_report(f, data, pruning_dict, event_dict, feature_dict, cell_dict, entity_uuid, entity_col, time_col, model_features, baseline, verbose)
    137 pruning_idx = data.shape[1] + coal_prun_idx
    138 plot_lim = max(abs(coal_prun_idx)+10, 40)
--> 139 pruning_plot = plot_temp_coalition_pruning(coal_plot_data, coal_prun_idx, plot_lim)
    141 event_data = local_event(f, data, event_dict, entity_uuid, entity_col, baseline, pruning_idx)
    142 event_plot = plot_event_heatmap(event_data)

File ~/temp/timeshap/src/timeshap/plot/pruning.py:53, in plot_temp_coalition_pruning(df, pruned_idx, plot_limit, solve_negatives)
     51 df = df[df['t (event index)'] >= -plot_limit]
     52 if solve_negatives:
---> 53     df = solve_negatives_method(df)
     55 base = (alt.Chart(df).encode(
     56     x=alt.X("t (event index)", axis=alt.Axis(title='t (event index)', labelFontSize=15,
     57                           titleFontSize=15)),
   (...)
     70 )
     71 )
     73 area_chart = base.mark_area(opacity=0.5)

File ~/temp/timeshap/src/timeshap/plot/pruning.py:47, in plot_temp_coalition_pruning.<locals>.solve_negatives_method(df)
     45 for idx, row in negative_values.iterrows():
     46     corresponding_row = df[np.logical_and(df['t (event index)'] == row['t (event index)'], ~(df['Coalition'] == row['Coalition']))]
---> 47     df.at[corresponding_row.index, 'Shapley Value'] = corresponding_row['Shapley Value'].values[0] + row['Shapley Value']
     48     df.at[idx, 'Shapley Value'] = 0
     49 return df

File ~/opt/anaconda3/envs/timeshap/lib/python3.10/site-packages/pandas/core/indexing.py:2281, in _AtIndexer.__setitem__(self, key, value)
   2278     self.obj.loc[key] = value
   2279     return
-> 2281 return super().__setitem__(key, value)

File ~/opt/anaconda3/envs/timeshap/lib/python3.10/site-packages/pandas/core/indexing.py:2236, in _ScalarAccessIndexer.__setitem__(self, key, value)
   2233 if len(key) != self.ndim:
   2234     raise ValueError("Not enough indexers for scalar access (setting)!")
-> 2236 self.obj._set_value(*key, value=value, takeable=self._takeable)

File ~/opt/anaconda3/envs/timeshap/lib/python3.10/site-packages/pandas/core/frame.py:3869, in DataFrame._set_value(self, index, col, value, takeable)
   3867 else:
   3868     series = self._get_item_cache(col)
-> 3869     loc = self.index.get_loc(index)
   3871 # setitem_inplace will do validation that may raise TypeError
   3872 #  or ValueError
   3873 series._mgr.setitem_inplace(loc, value)

File ~/opt/anaconda3/envs/timeshap/lib/python3.10/site-packages/pandas/core/indexes/base.py:3628, in Index.get_loc(self, key, method, tolerance)
   3623         raise KeyError(key) from err
   3624     except TypeError:
   3625         # If we have a listlike key, _check_indexing_error will raise
   3626         #  InvalidIndexError. Otherwise we fall through and re-raise
   3627         #  the TypeError.
-> 3628         self._check_indexing_error(key)
   3629         raise
   3631 # GH#42269

File ~/opt/anaconda3/envs/timeshap/lib/python3.10/site-packages/pandas/core/indexes/base.py:5637, in Index._check_indexing_error(self, key)
   5633 def _check_indexing_error(self, key):
   5634     if not is_scalar(key):
   5635         # if key is not a scalar, directly raise an error (the code below
   5636         # would convert to numpy arrays and raise later any way) - GH29926
-> 5637         raise InvalidIndexError(key)

InvalidIndexError: Int64Index([1], dtype='int64')

Error ''Score difference between baseline and instance ... is too low < 0.1.''

Hi!!
I have some questions about the code of timeshap kernel

I got several times the error:
''Score difference between baseline and instance ... is too low < 0.1.''

  1. I think you have a small mistake in the code. It is not very important since the explained score is the same but it should print
    "Baseline score: {self.fnull[0]} | Instance score: {self.fx[0]}." and not "Baseline score: {self.fx[0]} | Instance score: {self.fnull[0]}."

  2. I want to understand how you defined the value of the threshold 0.1
    In my case, I am getting this error pretty often since the scores are very low so the difference between the instance score and the baseline score is most of the time less than 0.1
    Should I change the value of this threshold? If yes, how?

Thank you for you help :)

[Question/Request] Input parameters of global_report for specific data sequence

Hey, thanks for the great work.

I have some questions about using this library for my own dataset (sorry if my questions might be easy to solve, I have been trying to solve them for three days, but no result).

I have an RNN model and an input dataset with the shape of (9517, 87, 37). It has a type of "np.ndarray" and each of the sequences (9517) has only one label (each sequence is an 87x37 table that has only one label).

First of all, I have a problem with the "calc_avg_event" function because its input is "pd.dataframe" which, in my case, each sequence (9517) is different from other sequences, and it doesn't have a meaning to convert it to a single dataframe. However, I can write a customized code that calculates the median and mode for each of the 9517 sequences and then calculate the median and mode again for all of the 9517 sequences.

The main problem, though, is the input parameters of the "global_report" function. More specifically, I don't know how to fill the "entity_col", "time_col", and "model_features" parameters of this function based on my dataset.

The example for TF has a different dataset, and I'm confused about whether the library can handle my dataset.

I really appreciate any help you can provide.

outputs at all time steps?

Is there a way to use timeshap, or to modify it, so that it will work for models that output at every time step and not just at the final step in the sequence?

Import Error: cannot import name 'Kernel'

Hello, i'm working on a project using timeSHAP (timeshap==1.0.4) and i'm getting ImportError when:

from timeshap.explainer import local_report

It says:

ImportError: cannot import name 'Kernel' from 'shap.explainers._kernel'

My shap version is (shap==0.43.0). Thanks in advance

UnicodeEncodeError: 'charmap' codec can't encode character '\u2264' in position 30: character maps to <undefined>

from timeshap.explainer import global_report
sequence_id_feat = 'id'
time_feat = 'Date'
#pos_dataset = d_test_normalized[d_test_normalized['label'] == 1]
schema = schema = list(trial.columns)
pruning_dict = {'tol': [ 0.025, 0.05],'path': 'prun_all_tf.csv'}
event_dict = {'path': 'event_all_tf.csv', 'rs': 42, 'nsamples': 32000}
feature_dict = {'path': 'feature_all_tf.csv','rs': 42, 'nsamples': 32000, 'feature_names': model_features, 'plot_features': plot_feats}
prun_stats, global_plot = global_report(f, trial, pruning_dict, event_dict, feature_dict, average_event, model_features, schema, sequence_id_feat, time_feat, )
prun_stats

While running the above code, I am getting the following error related to encoding:

UnicodeEncodeError Traceback (most recent call last)
~\AppData\Local\Temp\ipykernel_14916\4246322402.py in
7 event_dict = {'path': 'event_all_tf.csv', 'rs': 42, 'nsamples': 32000}
8 feature_dict = {'path': 'feature_all_tf.csv','rs': 42, 'nsamples': 32000, 'feature_names': model_features, 'plot_features': plot_feats}
----> 9 prun_stats, global_plot = global_report(f, trial, pruning_dict, event_dict, feature_dict, average_event, model_features, schema, sequence_id_feat, time_feat, )
10 prun_stats

c:\programdata\anaconda3\lib\site-packages\timeshap\explainer\global_methods.py in global_report(f, data, pruning_dict, event_dict, feature_dict, baseline, model_features, schema, entity_col, time_col, append_to_files, max_instances, verbose)
294 """
295 prun_indexes, event_data, feat_data =
--> 296 calc_global_explanations(f, data, pruning_dict, event_dict,
297 feature_dict, baseline, model_features,
298 schema, entity_col, time_col, append_to_files,

c:\programdata\anaconda3\lib\site-packages\timeshap\explainer\global_methods.py in calc_global_explanations(f, data, pruning_dict, event_dict, feature_dict, baseline, model_features, schema, entity_col, time_col, append_to_files, max_instances, verbose)
209 else:
210 print("Calculating pruning algorithm")
--> 211 prun_indexes = prune_all(f, data, pruning_dict, baseline,
212 model_features_index, schema, entity_col_index,
213 time_col_index, append_to_files, verbose)

c:\programdata\anaconda3\lib\site-packages\timeshap\explainer\pruning.py in prune_all(f, data, pruning_dict, baseline, model_features, schema, entity_col, time_col, append_to_files, verbose)
414 with open(file_path, 'a', newline='') as file:
415 writer = csv.writer(file, delimiter=',')
--> 416 writer.writerows(local_pruning_data.values)
417
418 prun_data = pd.DataFrame(np.concatenate(ret_prun_data), columns=names)

c:\programdata\anaconda3\lib\encodings\cp1252.py in encode(self, input, final)
17 class IncrementalEncoder(codecs.IncrementalEncoder):
18 def encode(self, input, final=False):
---> 19 return codecs.charmap_encode(input,self.errors,encoding_table)[0]
20
21 class IncrementalDecoder(codecs.IncrementalDecoder):

UnicodeEncodeError: 'charmap' codec can't encode character '\u2264' in position 30: character maps to

Is the issue while writing to the csv or vice versa? I am pretty lost here.

Adaptation of TimeShap for multi-label classification and event classification.

Hello, thanks for the great paper and code.

I'm exploring using timeshap for custom model and task. I reproduced the TensorFlow tutorial and all worked fine, but the AReM dataset was adapted from a multi-label to a binary classification so I'd like to know if there is the possibility to use timeshap for the original multi label setting. Also, if it is possible to use timeshap in the setting of classification of events, for a example given a sequence of length l classify each event between n labels. My question arrive from the limitation described in the README where the entry point should be a 3-D array (#sequences; #sequence length; #features) and output (#sequence; 1).

facing issue while unwrapping already trained model

Hi @AndreFCruz , @feedzaiadmin , @saleiro @JoaoPBSousa

I am trying to interpret an already trained LSTM model for time series which gives prediction in the form of probability.
I have a doubt about hidden state variable. Is it the dimension of the hidden layer or something else?
Also my model outputs only one value which is prediction, but the below code in the torch wrappers function outputs two values. Does this mean I will have to customize this code based on my use case?

        if hidden_states is not None:
            hidden_states_tensor = torch.from_numpy(hidden_states)
            predictions, hs = self.model(data_tensor, hidden_states_tensor)
        else:
            predictions, hs = self.model(data_tensor)

How does TimeShap handle missing values (NA)?

Hi,

I have a question regarding how TimeShap handles missing values (NA). To calculate the baseline, TimeShap uses the numerical average of the features, but doing this causes an error in the Shap Value estimation since the NA values in my features are informative for the model's performance. What would you recommend in this case? Should I attempt to impute these values or use a different method than TimeShap?

TimeSHAP with different sequence length?

Hello!
Thank you very much for your great work.

While reading your paper and going through the sample code using AReM dataset and trying to implement TimeSHAP in my own dataset, I came across some questions.

Please let me know if my understanding is not correct.
It seems that the bank fraud detection dataset in your paper has different sequence lengths if I am not mistaken.
So, in your example, there would be 32000 samples (number of clients?) with various sequence lengths or time lengths (with different number of transactions, logins, and enrollments per each client or sample), but with same number of features?

So, with that thought, I was going to use TimeSHAP in my dataset which has a different sequence length or time length but with the same number of features being used in each sequence.
Like the dimension of my dataset would be:

  • number of samples : 611
  • number of sequences: varies (approximately from 5 to 30)
  • number of features: 18

In bank fraud case

  • number of samples : 32000
  • number of sequences: varies?
  • number of features: ?

Would my scenario be used in TimeSHAP or does it have to have same length across the time?

Thank you very much and hope you could give some answers!
And please let me know if any part of my understanding is wrong.
Thank you!

Values instead of plots

I need the values of the event/feature contributions as variables, instead of plots. Is it possible to get that?

Recommend Projects

  • React photo React

    A declarative, efficient, and flexible JavaScript library for building user interfaces.

  • Vue.js photo Vue.js

    🖖 Vue.js is a progressive, incrementally-adoptable JavaScript framework for building UI on the web.

  • Typescript photo Typescript

    TypeScript is a superset of JavaScript that compiles to clean JavaScript output.

  • TensorFlow photo TensorFlow

    An Open Source Machine Learning Framework for Everyone

  • Django photo Django

    The Web framework for perfectionists with deadlines.

  • D3 photo D3

    Bring data to life with SVG, Canvas and HTML. 📊📈🎉

Recommend Topics

  • javascript

    JavaScript (JS) is a lightweight interpreted programming language with first-class functions.

  • web

    Some thing interesting about web. New door for the world.

  • server

    A server is a program made to process requests and deliver data to clients.

  • Machine learning

    Machine learning is a way of modeling and interpreting data that allows a piece of software to respond intelligently.

  • Game

    Some thing interesting about game, make everyone happy.

Recommend Org

  • Facebook photo Facebook

    We are working to build community through open source technology. NB: members must have two-factor auth.

  • Microsoft photo Microsoft

    Open source projects and samples from Microsoft.

  • Google photo Google

    Google ❤️ Open Source for everyone.

  • D3 photo D3

    Data-Driven Documents codes.