Code Monkey home page Code Monkey logo

action-units-heatmaps's Introduction

Joint Action Unit localisation and intensity estimation

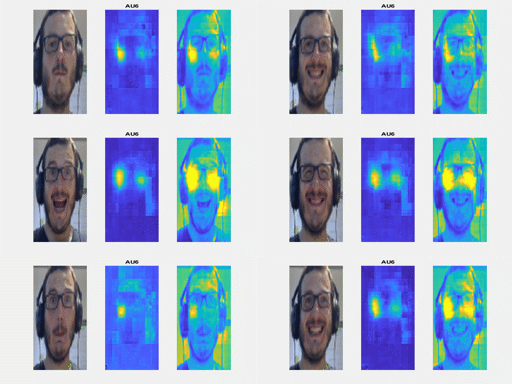
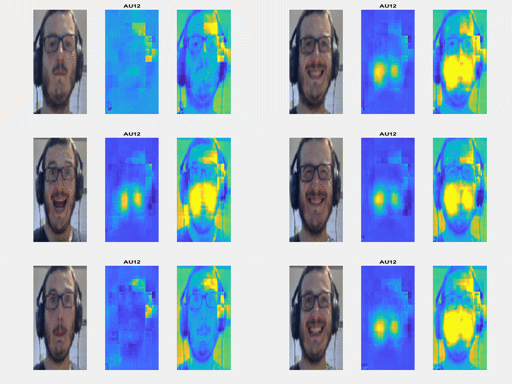
This is a built-in class for Action Unit intensity estimation with heatmap regression, adapted from the code used for the BMVC paper "Joint Action Unit localisation and intensity estimation through heatmap regression" (see citation below)

Alt Text

Alt Text

This class takes an image and returns the heatmaps and the AU predictions from them. In order to create a standalone class the points are detected using the dlib facial landmark detector. This will be shortly replaced by the iCCR tracker, whose Python implementation is underway (you can check the Matlab code here).

An example of usage is included in the first release. Full scripts for folder and csv reading will follow soon.

The Hourglass model has been kindly adapted from the FAN network. You can check Adrian's amazing code here

Requirements

dlib --> pip install dlib Link

OpenCV --> pip install cv2 Link

PyTorch --> follow the steps in https://pytorch.org/

It also requires scipy and matplotlib, and the Python version to be 3.X

pip install dlib
pip install cv2

Use

To use the code you need to download the dlib facial landmark detector from here and add it to your folder.

This all you need to run the detector (the visualisation in this script is really poor, I will work on improving it)

import AUmaps
import glob
import dlib
import matplotlib.pyplot as plt
AUdetector = AUmaps.AUdetector('shape_predictor_68_face_landmarks.dat',enable_cuda=False)
path_imgs = 'example_video'
files = sorted(glob.glob(path_imgs + '/*.png'))
fig = plt.figure(figsize=plt.figaspect(.5))
for names in files:
    print(names)
    img = dlib.load_rgb_image(names)
    pred,map,img = AUdetector.detectAU(img)
    for j in range(0,5):
        resized_map = dlib.resize_image(map[j,:,:].cpu().data.numpy(),rows=256,cols=256)
        ax = fig.add_subplot(5,2,2*j+1)
        ax.imshow(img)
        ax.axis('off')
        ax = fig.add_subplot(5, 2, 2*j+2)
        ax.imshow(resized_map)
        ax.axis('off')
    plt.pause(.1)
    plt.draw()

Contributions

All contributions are welcome

Citation

@inproceedings{sanchez2018bmvc,
  title = {Joint Action Unit localisation and intensity estimation through heatmap regression},
  author = {Enrique Sánchez-Lozano and Georgios Tzimiropoulos and Michel Valstar},
  booktitle = {BMVC},
  year = 2018
}

action-units-heatmaps's People

Contributors

esanchezlozano avatar pietromasur avatar timur-almaev avatar

Stargazers

 avatar  avatar  avatar  avatar  avatar  avatar  avatar  avatar  avatar  avatar  avatar  avatar  avatar  avatar  avatar  avatar  avatar  avatar  avatar  avatar  avatar  avatar  avatar  avatar  avatar  avatar  avatar  avatar  avatar  avatar  avatar  avatar  avatar  avatar  avatar  avatar  avatar  avatar  avatar  avatar  avatar  avatar  avatar  avatar  avatar  avatar  avatar  avatar  avatar  avatar  avatar  avatar  avatar  avatar  avatar  avatar  avatar  avatar  avatar  avatar  avatar  avatar  avatar  avatar  avatar  avatar  avatar  avatar  avatar  avatar  avatar  avatar  avatar  avatar  avatar  avatar  avatar  avatar  avatar  avatar  avatar  avatar  avatar  avatar  avatar

Watchers

 avatar  avatar

action-units-heatmaps's Issues

Heatmap generation

Hello ESanchezLozano

I'm trying to generate Heatmap for new AU is this a correct way ?

import numpy as np
import matplotlib.pyplot as plt
from scipy.stats import multivariate_normal

# create a grid of (x,y) coordinates at which to evaluate the kernels
xlim = (0, 63)
ylim = (0, 63)
xres = 64
yres = 64

x = np.linspace(xlim[0], xlim[1], xres)
y = np.linspace(ylim[0], ylim[1], yres)
xx, yy = np.meshgrid(x,y)

x_1 = 10
y_1 = 10

x_2 = 40
y_2 = 40

o_x_1 = 5
o_y_1 = 5
o_x_2 = 5
o_y_2 = 5

A = 1
B = 0.5
f1 = A  *   np.exp( -( (np.power((xx - x_1),2) / (2*o_x_1**2)) + (np.power((yy - y_1),2) / (2*o_y_1**2)) ) )

f2 = B   *  np.exp( -( (np.power((xx - x_2),2) / (2*o_x_2**2)) + (np.power((yy - y_2),2) / (2*o_y_2**2)) ) )


zz = f1 + f2

# reshape and plot image
img = zz.reshape((xres,yres))
plt.imshow(img); plt.show()

image

Disfa Partition

Hello, thanks for the sharing codes

Could you please tell me the partition of the Disfa dataset you used in the journal parper "A Transfer Learning approach to Heatmap Regression for Action Unit intensity estimation"?

Thank you very much

train code and ground-truth target heatmap

I would like to ask if the training code will be made public. At the same time, I would like to ask how to generate the ground truth heat map of the DISFA dataset. Its face landmarks are 66. How to deal with the inconsistency with the 68 facial landmarks generated by the previous face feature point detection?

unexpected EOF, expected 2784 more bytes. The file might be corrupted.

Hi, and thank you for making this code available.

I have cloned the repo and downloaded the shape_predictor_68_face_landmarks.dat file.

running >python demo.py

gives me this error:

Python3.7\lib\site-packages\torch\serialization.py", line 709, in _legacy_load
    deserialized_objects[key]._set_from_file(f, offset, f_should_read_directly)
RuntimeError: unexpected EOF, expected 2784 more bytes. The file might be corrupted.

what am i doing wrong here?

Thanks!

how to add the AU name

Hello
thanks a lot for sharing this code.

Could you please tell me how we can add the name of each Action Unit above each one?

Thanks

Grouth-truth AU heatmap generation

Hi @ESanchezLozano ,
Is it possible to upload the code of generating the ground-truth AU heatmap?

I am trying to implement your code to generate ground-truth AU heatmap, but did not find it in this repository. (I am not quite sure about equation 1 in the paper: why i, j should be smaller or equal to 6*Intensity?)

Thanks a lot!

Could you please explain the label perturbation more clearly?

In 3.4 Data augmentation, you mentioned the label perturbation.
Here, you write: Ik = 0.2 * Ik * abs(z), where z belongs to N(0,1)

I think, Ik can be 0,1,2,3,4,5, so after this formula computing, Ik pretend to be 0,0.2,0.4,0.6,0.8,1.0.?

Do you mean to make the Ik in range (0,1) from range (0,5)? Why?

But in the Huber loss function in 3.3 Loss Function, may I know what range do you think the y(i,j) should be? ragne (0, 1) or range (0,5)?

Add Training Code

Great work ESanchezLozano
But could you please please add training code so I can trained with new AUs?
Thank You

Recommend Projects

  • React photo React

    A declarative, efficient, and flexible JavaScript library for building user interfaces.

  • Vue.js photo Vue.js

    🖖 Vue.js is a progressive, incrementally-adoptable JavaScript framework for building UI on the web.

  • Typescript photo Typescript

    TypeScript is a superset of JavaScript that compiles to clean JavaScript output.

  • TensorFlow photo TensorFlow

    An Open Source Machine Learning Framework for Everyone

  • Django photo Django

    The Web framework for perfectionists with deadlines.

  • D3 photo D3

    Bring data to life with SVG, Canvas and HTML. 📊📈🎉

Recommend Topics

  • javascript

    JavaScript (JS) is a lightweight interpreted programming language with first-class functions.

  • web

    Some thing interesting about web. New door for the world.

  • server

    A server is a program made to process requests and deliver data to clients.

  • Machine learning

    Machine learning is a way of modeling and interpreting data that allows a piece of software to respond intelligently.

  • Game

    Some thing interesting about game, make everyone happy.

Recommend Org

  • Facebook photo Facebook

    We are working to build community through open source technology. NB: members must have two-factor auth.

  • Microsoft photo Microsoft

    Open source projects and samples from Microsoft.

  • Google photo Google

    Google ❤️ Open Source for everyone.

  • D3 photo D3

    Data-Driven Documents codes.