dwavesystems / dwave-inspector Goto Github PK
View Code? Open in Web Editor NEWD-Wave Problem Inspector
Home Page: https://docs.ocean.dwavesys.com/projects/inspector/
License: Apache License 2.0
D-Wave Problem Inspector
Home Page: https://docs.ocean.dwavesys.com/projects/inspector/
License: Apache License 2.0


To display broken chains, the Inspector must have access to samples in physical, not logical, space.
During SampleSet unembedding information about individual qubit values in a chain is lost -- due to chain break resolution.
To handle inspection of (bqm, sampleset), low-level data logging will be implemented in dwave-cloud-client.
If you don’t put the import for inspector before submitting the problem, it prints this unhelpful message:
Leap IDE /workspace/maze $ /usr/local/bin/python /workspace/maze/demo.py
       Traceback (most recent call last):
         File “/workspace/maze/demo.py”, line 36, in <module>
           dwave.inspector.show(result)
         File “/usr/local/lib/python3.7/site-packages/dwave/inspector/__init__.py”, line 140, in show
           data = from_objects(*args, **kwargs)
         File “/usr/local/lib/python3.7/site-packages/dwave/inspector/adapters.py”, line 590, in from_objects
           pd = storage.get_problem(problem_id)
         File “/usr/local/lib/python3.7/site-packages/dwave/inspector/storage.py”, line 92, in get_problem
           return problemdata[problem_id]
       KeyError: ‘6e393d77-1ddb-442c-a880-13d59e1d3e6e’
Example problem:
import dwave.cloud
import dwave.inspector

# define problem
h = {0: 1}
J = {}

# get solver
client = dwave.cloud.Client.from_config()
solver = client.get_solver(qpu=True)

# sample
response = solver.sample_ising(h, J)
print(response.sampleset)

# inspect
dwave.inspector.show((h, J), response)
Error:
>       dwave.inspector.show((h, J), response)

test_problem_details.py:43:
_ _ _ _ _ _ _ _ _ _ _ _ _ _ _ _ _ _ _ _ _ _ _ _ _ _ _ _ _ _ _ _ _ _ _ _ _ _ _ _
/Library/Frameworks/Python.framework/Versions/3.7/lib/python3.7/site-packages/dwave/inspector/__init__.py:153: in show
    data = from_objects(*args, **kwargs)
/Library/Frameworks/Python.framework/Versions/3.7/lib/python3.7/site-packages/dwave/inspector/adapters.py:776: in from_objects
    params=pd.problem['params'], sampleset=sampleset)
/Library/Frameworks/Python.framework/Versions/3.7/lib/python3.7/site-packages/dwave/inspector/adapters.py:399: in from_qmi_response
    "answer": _answer_dict(solutions, active_variables, energies, num_occurrences, timing, num_variables),
/Library/Frameworks/Python.framework/Versions/3.7/lib/python3.7/site-packages/dwave/inspector/adapters.py:92: in _answer_dict
    "solutions": [list(map(int, s)) for s in solutions],
_ _ _ _ _ _ _ _ _ _ _ _ _ _ _ _ _ _ _ _ _ _ _ _ _ _ _ _ _ _ _ _ _ _ _ _ _ _ _ _

.0 = <list_iterator object at 0x119730710>

>       "solutions": [list(map(int, s)) for s in solutions],
        "active_variables": list(map(int, active_variables)),
        "energies": list(map(float, energies)),
        "num_occurrences": list(map(int, num_occurrences)),
        "timing": timing,
        "num_variables": int(num_variables)
    }
E   TypeError: 'int' object is not iterable

/Library/Frameworks/Python.framework/Versions/3.7/lib/python3.7/site-packages/dwave/inspector/adapters.py:92: TypeError
Removing anneal_offset_ranges (unused for display) cuts the payload in half.
Current encoded properties size:
{'anneal_offset_ranges': 90990,
 'anneal_offset_step': 20,
 'anneal_offset_step_phi0': 22,
 'annealing_time_range': 9,
 'category': 5,
 'chip_id': 12,
 'couplers': 77235,
 'default_annealing_time': 2,
 'default_programming_thermalization': 4,
 'default_readout_thermalization': 1,
 'extended_j_range': 11,
 'h_gain_schedule_range': 11,
 'h_range': 11,
 'j_range': 11,
 'max_anneal_schedule_points': 2,
 'max_h_gain_schedule_points': 2,
 'num_qubits': 4,
 'num_reads_range': 10,
 'parameters': 1501,
 'per_qubit_coupling_range': 11,
 'problem_run_duration_range': 12,
 'programming_thermalization_range': 10,
 'qubits': 11142,
 'quota_conversion_rate': 1,
 'readout_thermalization_range': 10,
 'supported_problem_types': 17,
 'tags': 15,
 'topology': 41,
 'vfyc': 5}
Induced by #39, we want to support inspection of problems generated by multiple/nested embedding composites, in the implicit data collection mode.
Currently, only the outermost embedding is returned (see dwavesystems/dwave-system#251), so we're unable to provide the correct (composed) embedding to the problem inspector.
A workaround for now is to explicitly provide the composed embedding (via compose_embeddings()).
The planned solution is to implement the dashboard-style inspection, where intermediate problems will be captured and inspected on demand.
Start the underlying listener on dwave.inspector.server.WSGIAsyncServer.start(), not init.
I am using Windows 10 and Chrome Browser.
When I call dwave.inspector.show(sampleset) from the Jupyter Notebook, I am getting the error
"Error: Unexpected token < in JSON at position 0".
Solver properties on some older systems have not yet been updated. Until they are, we can fall back in the inspector to the old default topology type -- Chimera. (Note: this only applies to structured solvers.)
Sometimes the problem/solution is not explicitly available in user's code. Thanks to low-level data capturing we still have access to these (in dwave.inspector.storage), but the interface is quite awkward. For example to visualize one QMI:
dwave.inspector.storage.index_resolved_problems()
problem_id = list(dwave.inspector.storage.problemdata.keys())[0]
dwave.inspector.show(problem_id)
Few fixes possible:
show to accept problem_index: int (or maybe even strings like "last" and "first"?)Note this can handle only QMIs for now. For fully automated logical problem inspection, we need to extend data capture to samplesets.
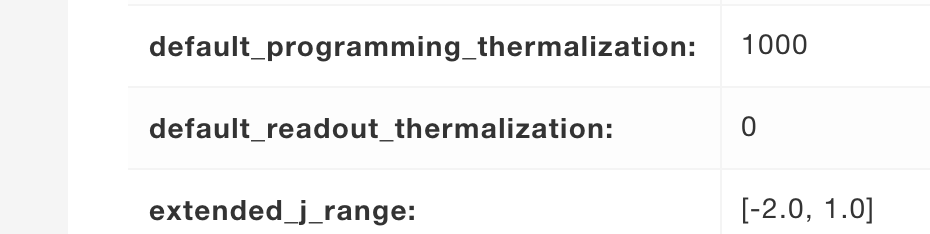
Default readout thermalization displayed as N/A instead of 0 in the Solver Details menu.

From qubist:
During data encoding for the visualizer (to JSON), most fields are handled by casting non-primary type to primary, but a general solution would be to support JSON serialization of all NumPy types by default.

I believe the issue may be coming from these lines in the adapters
    if params is None:
        params = {'num_reads': len(solutions)}
Since the visualizer supports only Chimera and Pegasus graphs, make sure we're not passing in incompatible problem graphs.
I noticed with grief that popular browser Microsoft Edge does not work too well with the inspector
Currently we only check the basic structure and data types of the passed in embedding (see _validated_embedding() -- which makes sense because an embedding in this phase (prior to inspection) is already vetted by the sampler/embedding composite.
However, not all cases are handled right now by the embedding composites (like are all chains disjoint?, see dwavesystems/dwave-system#260), so it would be useful to do more checks of the embedding before passing it to the inspector app.
As a user it would be nice to be able to click and drag the vertices in the graph for easier viewing.
When I run dwave.inspector.show((h, J), response), my Chrome browser keeps loading indefinitely. If I stop the load, and click refresh, it immediately visualizes the problem.
If my problem assigns a 0 bias to a non-working qubit, the inspector fails to start up due to this check assert set(active) == set(active_variables) in the adapters.
Example code:
import dwave.inspector
import networkx as nx
import dwave_networkx as dnx

# get solver
client = dwave.cloud.Client.from_config()
solver = client.get_solver(qpu=True)

num_qubits = solver.properties['num_qubits']
qubits = solver.properties['qubits']
couplers = solver.properties['couplers']

cg = dnx.chimera_graph(4, 2, 8, None, qubits, couplers)
sp = nx.shortest_path(cg, source=0, target=2047)

h = [0] * num_qubits
for q in sp:
    h[q] = 2

J = {}
i = 0
while i < len(sp)-1:
    J.update({(sp[i], sp[i+1]): -1.0})
    i += 1

params = {
    "num_reads": 10,
}


# sample
response = solver.sample_ising(h, J, **params)

print(response.sampleset)

# inspect
dwave.inspector.show((h, J), response)
The issue is originated at h = [0] * num_qubits, but note that this is a valid problem as it gets solved by the solver.
Here is the stacktrace:
  File "/Library/Frameworks/Python.framework/Versions/3.7/lib/python3.7/site-packages/IPython/core/interactiveshell.py", line 3326, in run_code
    exec(code_obj, self.user_global_ns, self.user_ns)
  File "<ipython-input-2-7f9d36da0f78>", line 1, in <module>
    runfile('/Users/mdecandia/Documents/inspector tests/test_graph_path.py', wdir='/Users/mdecandia/Documents/inspector tests')
  File "/Applications/PyCharm.app/Contents/helpers/pydev/_pydev_bundle/pydev_umd.py", line 197, in runfile
    pydev_imports.execfile(filename, global_vars, local_vars)  # execute the script
  File "/Applications/PyCharm.app/Contents/helpers/pydev/_pydev_imps/_pydev_execfile.py", line 18, in execfile
    exec(compile(contents+"\n", file, 'exec'), glob, loc)
  File "/Users/mdecandia/Documents/inspector tests/test_graph_path.py", line 42, in <module>
    dwave.inspector.show((h, J), response)
  File "/Library/Frameworks/Python.framework/Versions/3.7/lib/python3.7/site-packages/dwave/inspector/__init__.py", line 98, in show
    data = from_objects(*args, **kwargs)
  File "/Library/Frameworks/Python.framework/Versions/3.7/lib/python3.7/site-packages/dwave/inspector/adapters.py", line 498, in from_objects
    embedding_context=embedding_context, warnings=warnings)
  File "/Library/Frameworks/Python.framework/Versions/3.7/lib/python3.7/site-packages/dwave/inspector/adapters.py", line 166, in from_qmi_response
    assert set(active) == set(active_variables)
AssertionError```
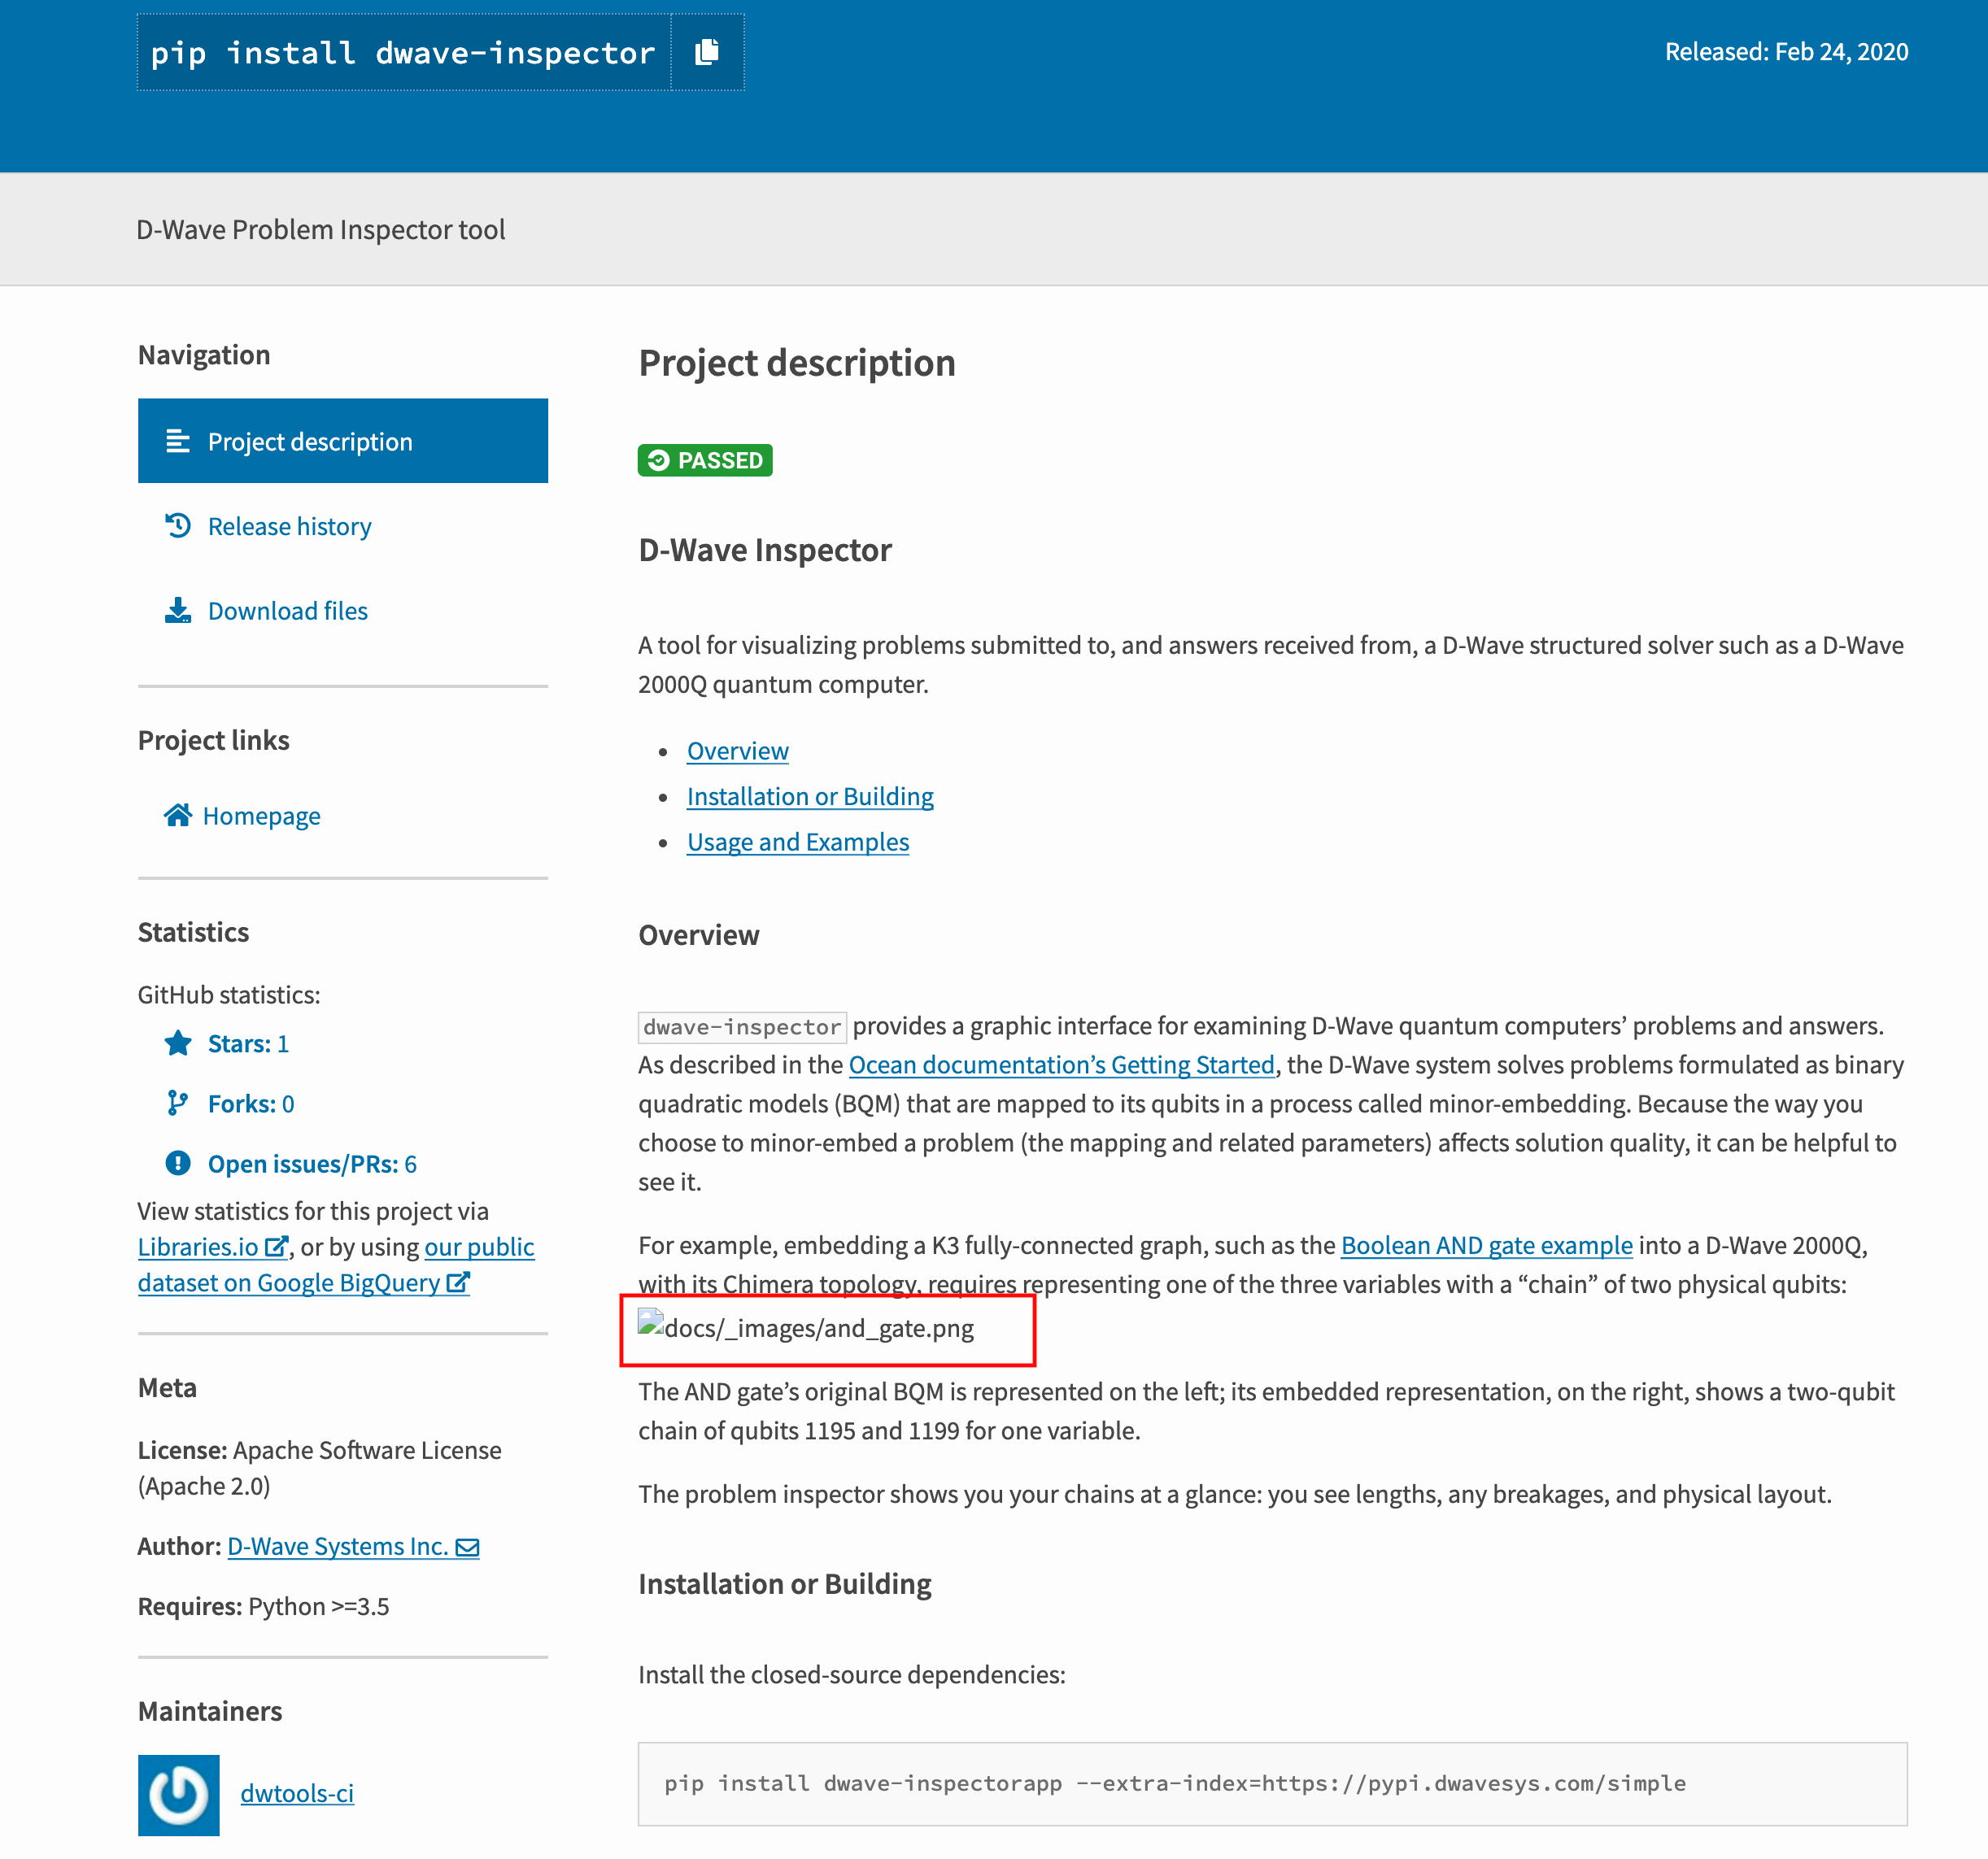
Images from the readme of dwave-inspector are not displayed in the project description on the PyPi webpage: https://pypi.org/project/dwave-inspector/
When submitting a problem with raw answer mode, trying to inspect it throws error KeyError: 'num_occurrences is not a property of response object' (stack trace below).
I believe this is because the inspector only supports histogram mode. A more user-friendly/comprehensive error should be thrown indicating that raw answer mode is not supported for inspection.
sampling
inspecting
Traceback (most recent call last):
  File "/Applications/PyCharm.app/Contents/helpers/pydev/pydevd.py", line 1741, in <module>
    main()
  File "/Applications/PyCharm.app/Contents/helpers/pydev/pydevd.py", line 1735, in main
    globals = debugger.run(setup['file'], None, None, is_module)
  File "/Applications/PyCharm.app/Contents/helpers/pydev/pydevd.py", line 1135, in run
    pydev_imports.execfile(file, globals, locals)  # execute the script
  File "/Applications/PyCharm.app/Contents/helpers/pydev/_pydev_imps/_pydev_execfile.py", line 18, in execfile
    exec(compile(contents+"\n", file, 'exec'), glob, loc)
  File "/Users/mdecandia/Documents/viz-test/dwave-inspector/examples/qmi.py", line 82, in <module>
    dwave.inspector.show_qmi(problem, response)
  File "/Library/Frameworks/Python.framework/Versions/3.7/lib/python3.7/site-packages/dwave_inspector-0.0.1-py3.7.egg/dwave/inspector/__init__.py", line 34, in show_qmi
    problem = from_qmi_response(problem, response, embedding)
  File "/Library/Frameworks/Python.framework/Versions/3.7/lib/python3.7/site-packages/dwave_inspector-0.0.1-py3.7.egg/dwave/inspector/adapters.py", line 104, in from_qmi_response
    num_occurrences = response['num_occurrences']
  File "/Library/Frameworks/Python.framework/Versions/3.7/lib/python3.7/site-packages/dwave/cloud/computation.py", line 778, in __getitem__
    raise KeyError('{} is not a property of response object'.format(key))
KeyError: 'num_occurrences is not a property of response object'

Process finished with exit code 1
For the code below, the inspector returns a not very helpful error message "Error: Unexpected token < in JSON at position 0". Replace line "h = 0" with "h = 0.0" and inspector works.
import dimod
import dwave.inspector
import numpy as np
from dwave.system import DWaveSampler

h = 0
# change to h = 0.0 to fix error

sampler = DWaveSampler(solver={'qpu': True})
bqm = dimod.BQM.from_ising({key: np.random.choice([h, h]) for key in sampler.nodelist},
                           {key: np.random.choice([-1.0,1.0]) for key in sampler.edgelist})
# sample
sampleset = sampler.sample(bqm)
# inspect
dwave.inspector.show(bqm, sampleset)
Although this will make inspector opening slower (on average), make sure the http and app servers are started before calling web browser page open.
test
Proxy requests for solvers not included in the dwave-inspectorapp package to SAPI (maybe cache them along the way).
The reason being static (host, port) binding. Change to dynamic.
The following suspends my Windows CMD terminal:
exit command in iPython or CNTL-Z in Python)Python is not exited and the CMD window hangs until brutally killed.
I think it's keeping some connection to or process of the webserver open, and if that does time out at all it does not happen quickly.
Currently, the Chain Break Warning reads "a chain is broken in the lowest energy samples found", and the User Warning reads "all samples had broken chains"
This is to propose that we change them to "Lowest-energy samples contain a broken chain" (credits: Joel P.)
and
"All samples have broken chains" changing it to the present tense to match the other warnings.

Static files lookup is broken in py39 due to change in behaviour of importlib.resources.path when the resource is a directory.
dwave-inspector/dwave/inspector/server.py
Lines 207 to 212 in db3eade
See: https://gitlab.com/python-devs/importlib_resources/-/issues/58
Blocking #99.
An else statement could be added here in case the user specifies a value that is not Once, Forever, or True:
Steps:
block=FalseFalse is no longer a valid option :)
embedding = {'x1': {1}, 'x2': {5}, 'z': {0, 4}}
This (AND gate) works for embedding = {'x1': [1], 'x2': [5], 'z': [0, 4]}:

Sometimes "pipe broken" messages seep through. Seems like it has to do with browser keeping the connection alive.
User should be able to click on a node in the graph and get the nice coordinates
From @boothby
"Qubit addresses are of the form (t, y, x, u, k). The t coordinate addresses a chimera-structured subgraph -- the remaining coordinates are traditional chimera coordinates, and address qubits within that subgraph."
Would be nice to be able to see the version of the problem inspector from the visualized problem in the browser (say under the lefthand menu that shows references, features, and keyboard shortcuts) rather than having to check in the terminal. Low priority.
Currently,
ANSWER MODE,
MAX ANSWERS,
NUMBER OF SPIN REVERSAL TRANSFORMS,
ANNEALING TIME,
ANNEAL SCHEDULE,
REINITIALIZED STATES,
H GAIN SCHEDULE,
POST PROCESS,
PROGRAMMING THERMALIZATION,
READOUT THERMALIZATION,
MAX CHAIN LENGTH,
NUMBER OF VARIABLES,
CHAIN STRENGTH RATIO
are displayed as N/A
AUTO SCALE,
FLUX DRIFT COMPENSATION,
REDUCE INTERSAMPLE CORRELATION,
FLUX BIASES,
ANNEAL OFFSETS,
INITIAL STATE
are displayed as "false"
NUMBER OF READS displays 1 when no value is specified by the user, which is correct.
Here is a list of default solver values provided by Josiah:
anneal_offsets
    default is unset (I think unset means the same as all 0s, but not sure; it is not required by qpapi)
anneal_schedule
    no default, but effectively [[0, 0], [default_annealing_time, 1]]
annealing_time
    default is default_annealing_time
answer_mode
    default is histogram
auto_scale
    if no flux_biases default is True
    otherwise default is False
    (this could be clearer in docs)
beta
    default is 10 for vfyc solvers
    otherwise default is 1
    (docs don't say this and it isn't in the solver properties)
chains
    default is unset
flux_biases
    default is unset (I think this means the same as all 0s, but not sure; it is not required by qpapi)
flux_drift_compensation
    default is True
(docs list h as a parameter, which it isn't really.  not sure if this is too confusing)
h_gain_schedule
    default is [[0, 1], [annealing_time, 1]]
    (or final time point of anneal_schedule)
initial_state
    default is unset (but required for reverse annealing)
(docs list J as a parameter, which it isn't really.  not sure if this is too confusing)
max_answers
    default is num_reads (which means it has no effect, so could be considered unset)
num_reads
    default is 1
num_spin_reversal_transforms
    default is 0 (I didn't see this in the docs, also some weird font size issues here)
postprocess
    default is 'sampling' for vfyc solvers
    otherwise default is '' (no postprocessing)
programming_thermalization
    default is default_programming_thermalization
(docs list Q as a parameter, which it isn't really.  not sure if this is too confusing)
readout_thermalization
    default is default_readout_thermalization (docs don't say this)
reduce_intersample_correlation
    default is False
reinitialize_state
    default is True if initial_state is set (from docs, doesn't happen in sapi/qpapi)
    otherwise default is unset
Pending dwavesystems/dwave-system#234 et al.
Problem Inspector fails to start up for the below problem. It shows a blue screen and an error in the console. Unfortunately, I have not found what exactly causes the issue in this problem.
Problem:
import sys
import dimod
import dwave.inspector
from minorminer import find_embedding
from dwave.cloud import Client
from dwave.embedding import embed_bqm, unembed_sampleset
from dwave.embedding.utils import edgelist_to_adjacency
import networkx as nx
import dwave_networkx as dnx
import numpy as np
from dwave.system import DWaveSampler, EmbeddingComposite,FixedEmbeddingComposite

sampler = EmbeddingComposite(DWaveSampler(solver=dict(qpu=True)))
Q = {('x', 'x'): -1, ('x', 'z'): 2, ('z', 'x'): 0, ('z', 'z'): -1}

sampler_embedded = FixedEmbeddingComposite(sampler, {'x': [4], 'z': [0, 128, 256, 384, 512, 640, 768]})
sampleset = sampler_embedded.sample_qubo(Q, num_reads=5000, chain_strength=1)
sampleset.info["embedding"] = {'x': [4], 'z': [0, 128, 256, 384, 512, 640, 768]}

dwave.inspector.show(dimod.BQM.from_qubo(Q), sampleset, sampler_embedded)
Console Error:
Uncaught TypeError: Cannot read property 'length' of undefined
    at main.8f0edd8b.chunk.js:1
    at main.8f0edd8b.chunk.js:1
    at Map.forEach (<anonymous>)
    at c.iterateNodes (main.8f0edd8b.chunk.js:1)
    at Object.layoutVars (main.8f0edd8b.chunk.js:1)
    at Object.<anonymous> (main.8f0edd8b.chunk.js:1)
    at v.applyLayoutFunction (main.8f0edd8b.chunk.js:1)
    at main.8f0edd8b.chunk.js:1
    at main.8f0edd8b.chunk.js:1
    at Array.forEach (<anonymous>)
Screenshot:

When submitting a problem that specifies an initial_state, the inspector fails to start up as the below error is thrown:
ERROR    dwave.inspector.server:app.py:1891 Exception on /api/problems/d6684f12-cc17-4ba3-a4bf-74c3e2dc31db [GET]
Traceback (most recent call last):
  File "/Library/Frameworks/Python.framework/Versions/3.7/lib/python3.7/site-packages/flask/app.py", line 2446, in wsgi_app
    response = self.full_dispatch_request()
  File "/Library/Frameworks/Python.framework/Versions/3.7/lib/python3.7/site-packages/flask/app.py", line 1952, in full_dispatch_request
    return self.finalize_request(rv)
  File "/Library/Frameworks/Python.framework/Versions/3.7/lib/python3.7/site-packages/flask/app.py", line 1967, in finalize_request
    response = self.make_response(rv)
  File "/Library/Frameworks/Python.framework/Versions/3.7/lib/python3.7/site-packages/flask/app.py", line 2111, in make_response
    rv = jsonify(rv)
  File "/Library/Frameworks/Python.framework/Versions/3.7/lib/python3.7/site-packages/flask/json/__init__.py", line 370, in jsonify
    dumps(data, indent=indent, separators=separators) + "\n",
  File "/Library/Frameworks/Python.framework/Versions/3.7/lib/python3.7/site-packages/flask/json/__init__.py", line 211, in dumps
    rv = _json.dumps(obj, **kwargs)
  File "/Library/Frameworks/Python.framework/Versions/3.7/lib/python3.7/json/__init__.py", line 238, in dumps
    **kw).encode(obj)
  File "/Library/Frameworks/Python.framework/Versions/3.7/lib/python3.7/json/encoder.py", line 199, in encode
    chunks = self.iterencode(o, _one_shot=True)
  File "/Library/Frameworks/Python.framework/Versions/3.7/lib/python3.7/json/encoder.py", line 257, in iterencode
    return _iterencode(o, 0)
  File "/Library/Frameworks/Python.framework/Versions/3.7/lib/python3.7/site-packages/flask/json/__init__.py", line 100, in default
    return _json.JSONEncoder.default(self, o)
  File "/Library/Frameworks/Python.framework/Versions/3.7/lib/python3.7/json/encoder.py", line 179, in default
    raise TypeError(f'Object of type {o.__class__.__name__} '
TypeError: Object of type int8 is not JSON serializable
The browser window shows a blue screen with Error: Unexpected token < in JSON at position 0
Example problem:
        h = {}
        J = {(0, 4): 1}

        # get solver properties
        anneal_offset_ranges = solver.properties['anneal_offset_ranges']
        num_qubits = solver.properties['num_qubits']
        anneal_offset = [0] * num_qubits

        for i in solver.nodes:
            anneal_offset[i] = anneal_offset_ranges[i][0]

        forward_answer = solver.sample_ising(h, J, annealing_time=25)
        i5 = int(5.0 / 95 * len(forward_answer.samples))
        initial = dict(zip(forward_answer.variables, forward_answer.sampleset._record[i5].sample))

        params = {
            "anneal_offsets": anneal_offset,
            "anneal_schedule": [[0.0, 1.0], [10.0, 1.0]],
            "h_gain_schedule": [[0.0, 1.0], [10.0, 1.0]],
            "initial_state": initial,
            "reinitialize_state": True
        }

        # sample
        response = solver.sample_ising(h, J, **params)

        # inspect
        dwave.inspector.show((h, J), response)
With dwavesystems/dwave-cloud-client#455 merged, we'll have to start filtering out non-QPU sampling events (or stop storing hybrid jobs), as inspecting them is not supported.
The energies shown in the Problem Inspector, as of 1/22/2020, are energies on the target problem, or also known as "raw". This means that they have not been "converted" or "reconstructed" back to the original Source problem.
Consider, for example, the attached piece of code. When I run it from the command-line, and print the energies from the Response object, the ground state energy is -64. This is as I designed the code, with an energy offset so that the Ising energy would be easily interpretable. When I run it in the Problem Inspector, the ground state energy may be different, depending on the embedding that the program found. There is a conversion between the ground-state energy as shown in the Inspector, and the ground-state energy we get back in the Response, involving the number of links used in the embedding, and the value of the chainstrength. This conversion is not a simple formula. But I believe all the information to make that conversion for the user is available in the Ocean internals.
My concern is that users might notice that the energy is changing signficantly between runs of the Problem Inspector.
My first suggestion is to modify the returned energy so that it is the "source problem" energy.
Failing that, if it isn't possible in the needed timeframe, I suggest adding verbiage to indicate to the user that she is seeing "raw energy," coming directly back from the hardware, and that the conversion has not been performed.
Another suggestion is to return both energies somehow, so that the user can see both of them next to each other.
Users who are not concerned about the magnitude of the problem's energy won't notice this. It is an issue for users who try to understand/compute the problem's energy.
Specifically, support new BQM classes like dimod.AdjVectorBQM.
If I try from a CMD terminal of a Win 10 OS running iPython to use dwave.inspector.show(sampleset) twice, the second attempt causes the terminal to hang and it needs to be closed (CNTR-C and closing the browser window do not end the task).
This happens for both Pegasus and Chimera graphs.
Brower: Chrome version Version 88.0.4324.182 (Official Build) (64-bit)
Few users reported they have issues when using the inspector installed with Conda.
They report inspector.show() blocks until manually interrupted:
File "/home/.../anaconda3/.../lib/python3.7/site-packages/dwave/inspector/__init__.py", line 180, in show
    return open_problem(id_, block=block)
File "/home/.../anaconda3/.../lib/python3.7/site-packages/dwave/inspector/__init__.py", line 94, in open_problem
    app_server.wait_problem_accessed(problem_id)
File "/home/.../anaconda3/.../lib/python3.7/site-packages/dwave/inspector/server.py", line 198, in wait_problem_accessed
    problem_access_sem[problem_id].acquire(blocking=True, timeout=timeout)
File "/home/.../anaconda3/.../lib/python3.7/threading.py", line 427, in acquire
    self._cond.wait(timeout)
File "/home/.../anaconda3/.../lib/python3.7/threading.py", line 296, in wait
    waiter.acquire()
KeyboardInterrupt
In order for the inspector show function to work properly, the import statement must be called before the sampler sample function call, followed by which the inspector show function can be called.
i.e.:
import dwave.inspector
...
sampler.sample(Q)
...
dwave.inspector.show(Q, response)
This is not entirely obvious based on context and current documentation.
Invoking the inspector from the IDE using dwave.inspector.show((h, J), response, block=False) yields the following error message:

I understand that this is by design because the IDE will not wait for the Problem Inspector to be rendered before shutting down the process. But if we are to expose the block parameter to the general public, we should make sure they know not to use it in the Inspector. Perhaps it should be mentioned in the docs?
A workaround is to add a time.sleep() statement after dwave.inspector.show() so that the inspector has time to render before the process is killed.
Currently, a simple "heuristic" is being used to detect one full load of the inspector app (page).
We want to have a reliable way of determining that, and one way is to add an "on finish" callback in the app js code.
Currently, non-daemon thread is used to the background web server, which prevents gracious exit (unless server explicitly stopped). See #3.
In production, we want to use a daemon thread for the server, but also enable user some control over shutdown. I.e. dwave.inspector.show() et al. should introduce optional blocking. Perhaps via block kwarg, with values from {once, never, always}.
Blocking for just one problem load in the browser looks like a nice default behavior.
Calling dwave.inspector.show() on results from dwave.system.testing.MockDWaveSampler should work.
See #86, and this error in particular.

Parameters such as answer mode, number of reads, auto scale, post process, etc. are not displayed in the Problem Details menu even though they have been set when submitting the problem.
A declarative, efficient, and flexible JavaScript library for building user interfaces.
🖖 Vue.js is a progressive, incrementally-adoptable JavaScript framework for building UI on the web.
TypeScript is a superset of JavaScript that compiles to clean JavaScript output.
An Open Source Machine Learning Framework for Everyone
The Web framework for perfectionists with deadlines.
A PHP framework for web artisans
Bring data to life with SVG, Canvas and HTML. 📊📈🎉
JavaScript (JS) is a lightweight interpreted programming language with first-class functions.
Some thing interesting about web. New door for the world.
A server is a program made to process requests and deliver data to clients.
Machine learning is a way of modeling and interpreting data that allows a piece of software to respond intelligently.
Some thing interesting about visualization, use data art
Some thing interesting about game, make everyone happy.
We are working to build community through open source technology. NB: members must have two-factor auth.
Open source projects and samples from Microsoft.
Google ❤️ Open Source for everyone.
Alibaba Open Source for everyone
Data-Driven Documents codes.
China tencent open source team.