Code Monkey home page Code Monkey logo

learn-machine-learn's Introduction

Learn-Machine-Learn

Contributors Forks Issues Pull Request

A one-stop repository for new-comers in Machine Learning and A.I.

Contents

  1. Description
  2. Project structure
  3. Project roadmap
  4. Getting started
  5. Preview Notebooks
  6. Built with
  7. Contributing
  8. Authors
  9. License
  10. Acknowledgments

Description

What are the projects?

This repository has two projects -

  • Classification based project on Cancer prediction Cancer_prediction.ipynb
  • Regression based project on Stock price prediction L&T_Stock_Price_prediction.ipynb

How can this project help?

  • Cancer Prediction

    Machine learning is not new to cancer research. Artificial neural networks (ANNs) and decision trees (DTs) have been used in cancer detection and diagnosis for nearly 20 years.The fundamental goals of cancer prediction and prognosis are distinct from the goals of cancer detection and diagnosis.

  • Stock price Prediction

    Stock market prediction aims to determine the future movement of the stock value of a financial exchange. The accurate prediction of share price movement will lead to more profit investors can make.

The idea

  • Cancer Prediction

    The idea is to predict whether a cell is cancerous or non-cancerous based on different features of cell using different Machine learning algorithms or Deep learning techniques

  • Stock Prediction

    The idea is to predict the future stock pricing based on different dependencies of a stock using different Machine learning algorithms or Deep learning techniques

Project structure

.
├── Classification
│   ├── Cancer_prediction.ipynb                   Jupyter notebook for Cancer prediction
│   ├── Datasets                                  Dataset for Cancer prediction
│   │   ├── cancer_data.csv
│   │   └── dataset.txt
│   └── classification.txt                        Basic information about Classification
├── Regression
│   ├── Datasets                                  Dataset for L&T stock price prediction
│   │   ├── LT.csv
│   │   └── dataset.txt
│   ├── L&T_Stock_Price_prediction.ipynb          Jupyter notebook for Stock price prediction
│   └── regression.txt                            Basic information about Regression
├── LICENSE
├── code_of_conduct.md
├── contributing.md
└── readme.md

Project roadmap

The project currently does the following things-

  • Data cleaning
  • Data preprocessing
  • Already implemented a very few machine learning algorithms or deep learning techniques

Following things can be implemented -

  • Data augmentation or manipulation
  • Better data visualization
  • Implementation of different Machine learning algorithms or deep learning techniques to achieve better prediction results

Getting started

Prerequisites

  • Very basic understanding of git and github:

    1. What are repositories (local - remote - upstream), issues, pull requests
    2. How to clone a repository, how to fork a repository, how to set upstreams
    3. Adding, committing, pulling, pushing changes to remote repositories
  • For EDA and Visualisation

    1. Basic syntax and working of python.(This is a must)
    2. Basic knowledge of pandas library. Reading this blog might help.
    3. Basic knowledge of matplotlib library. Reading this blog might help.
    4. Basic knowledge of seaborn library. Reading this blog might help.
    5. Basic knowledge of scikit learn library. Reading this blog might help.
    6. Basic knowledge of tensorflow library. Reading this blog might help.

    However the code is well explained, so anyone knowing the basics of Python can get a idea of what's happenning and contribute to this.

Installing

A step by step series of examples that tell you how to get a development env running.

There are two ways of running the code.

  1. Running the code on web browser.(Google Colab) [Recommended]

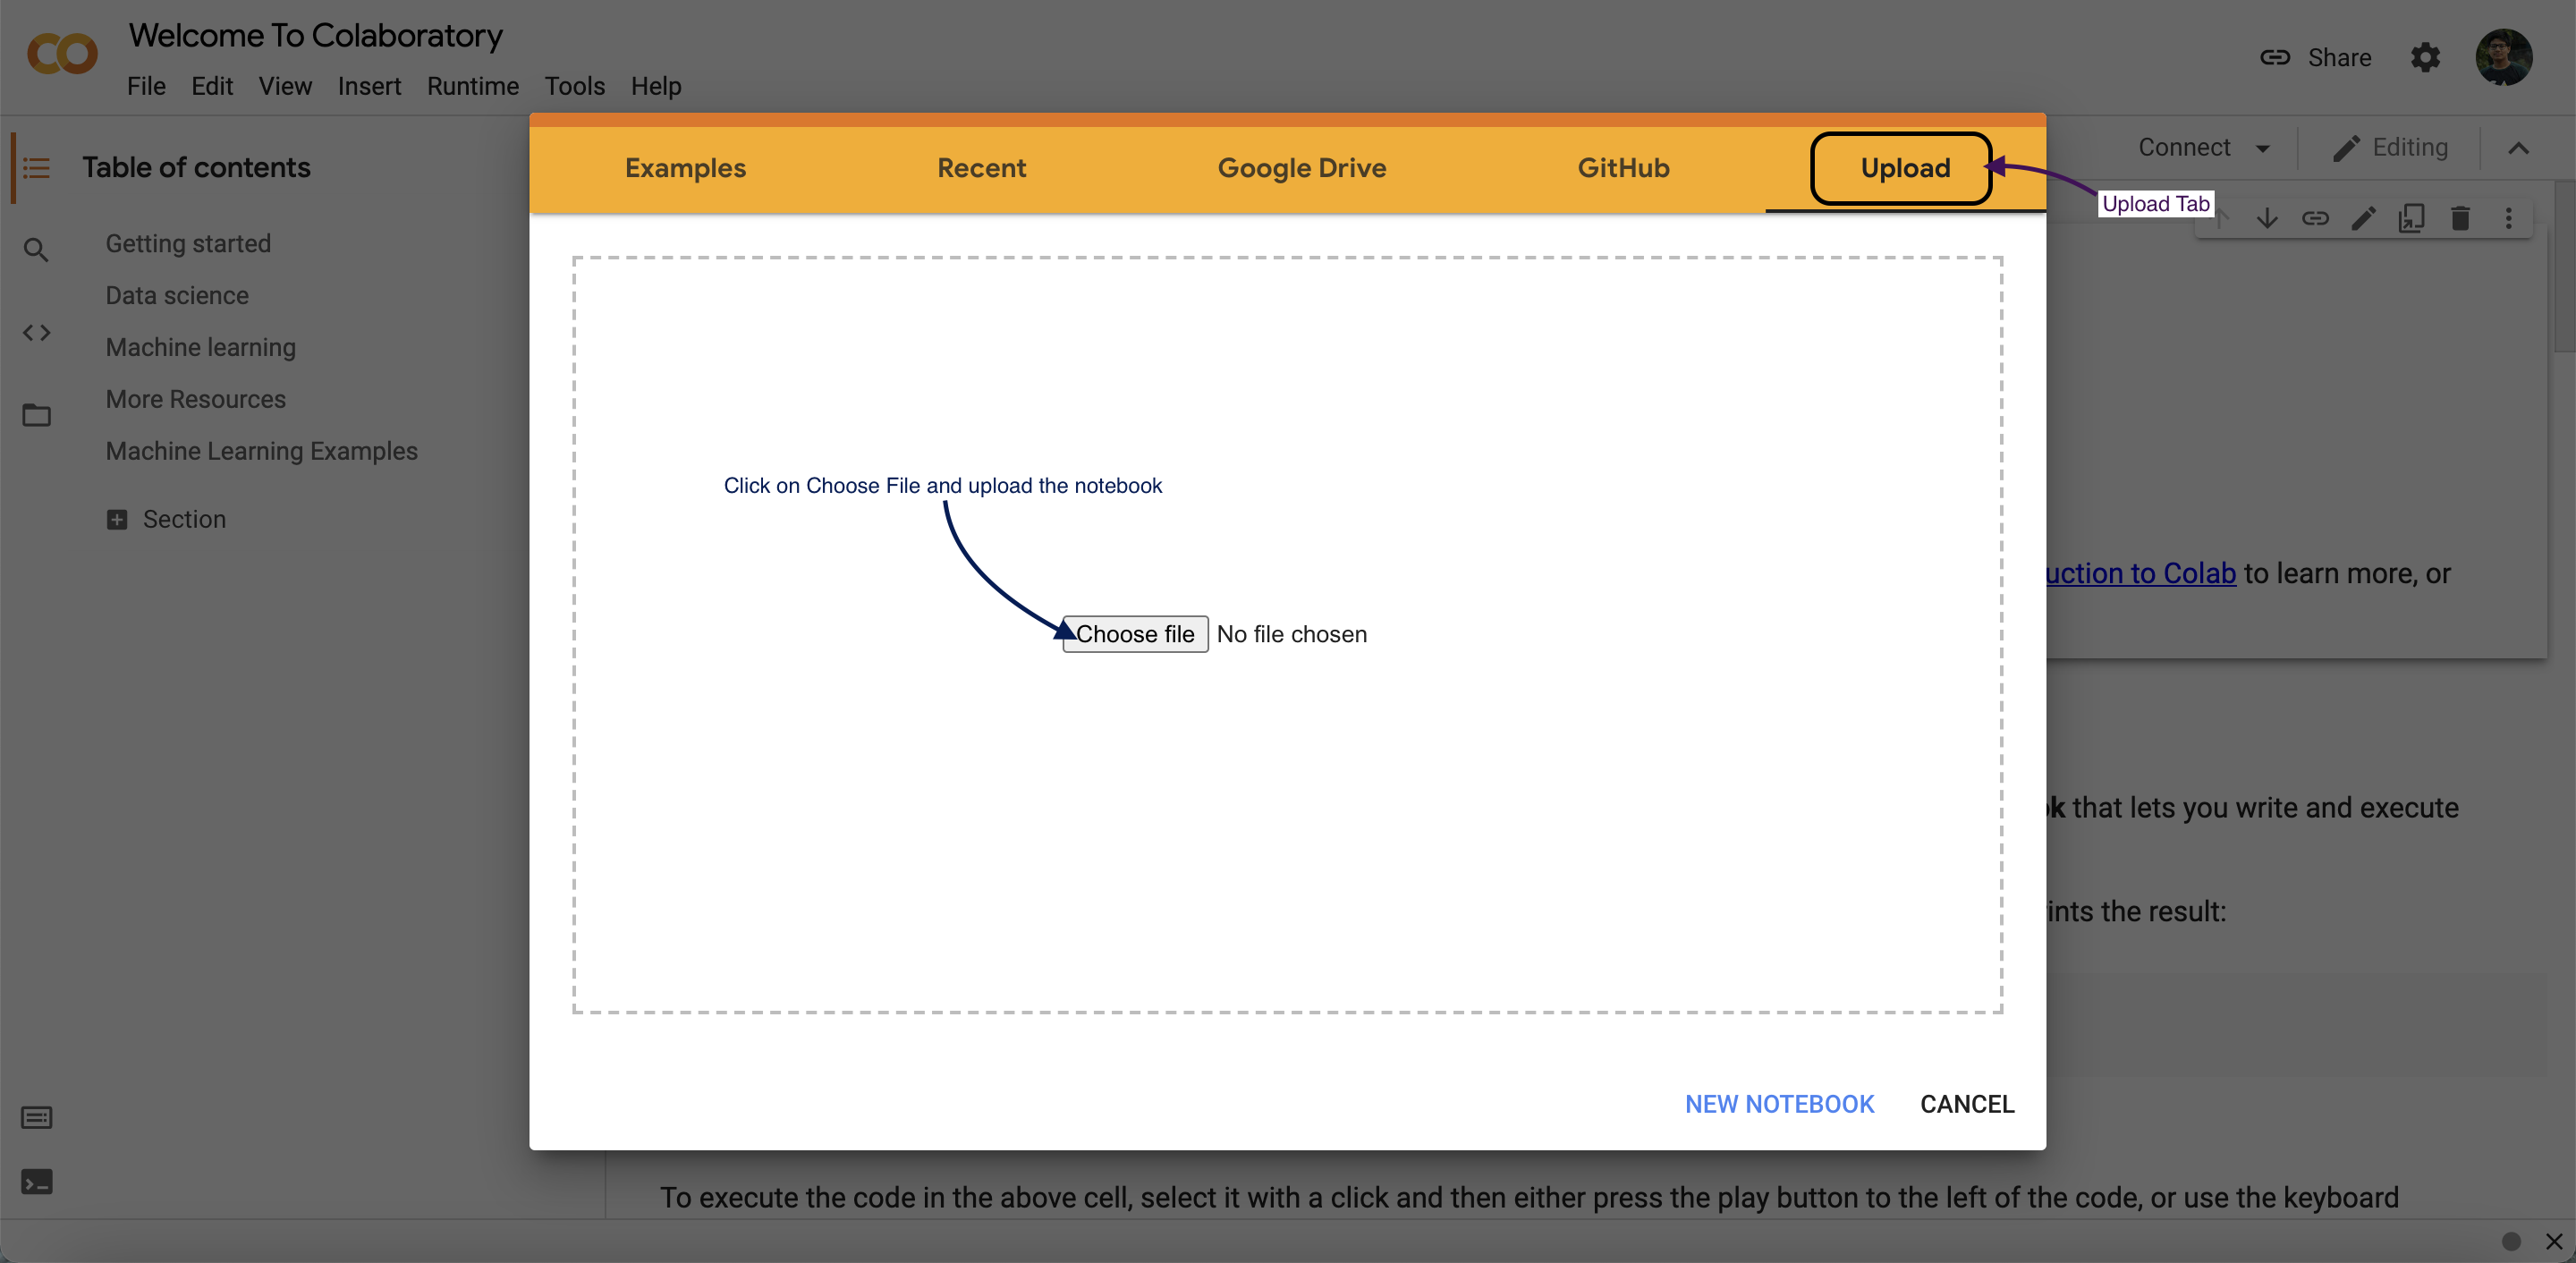
    • Head on to Google colab
    • Then click on Upload Notebook Tab.
    • Upload the notebook that you got from this repo. Colab-1
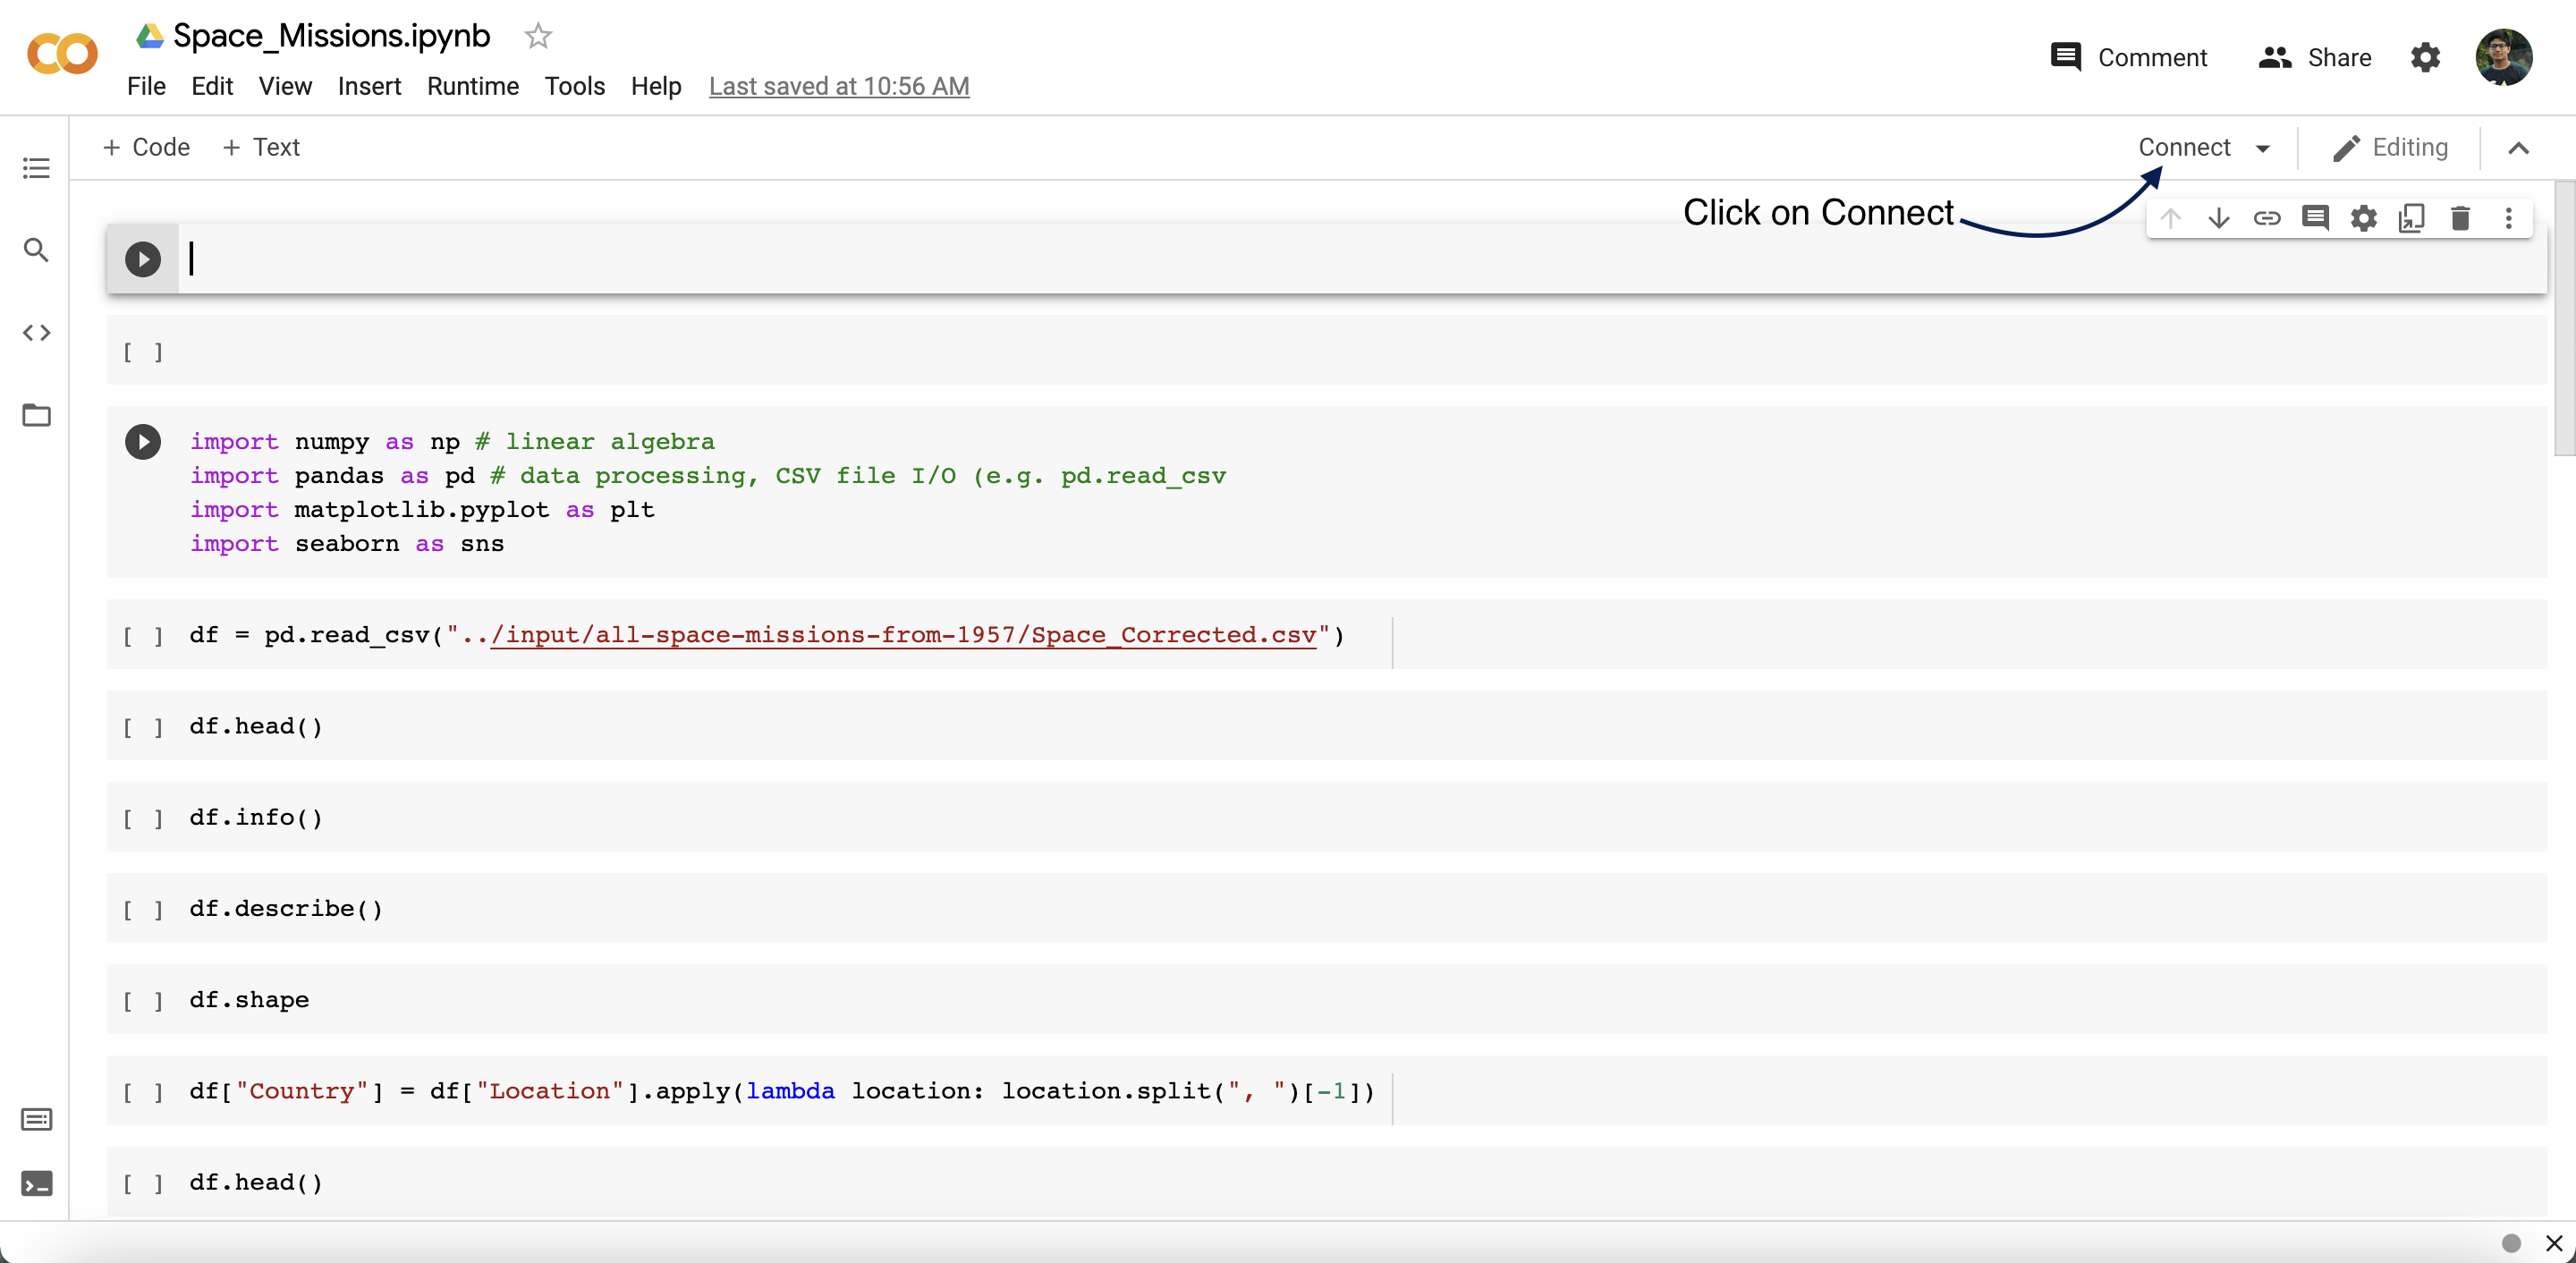
    • Connect with the runtime. Colab-2
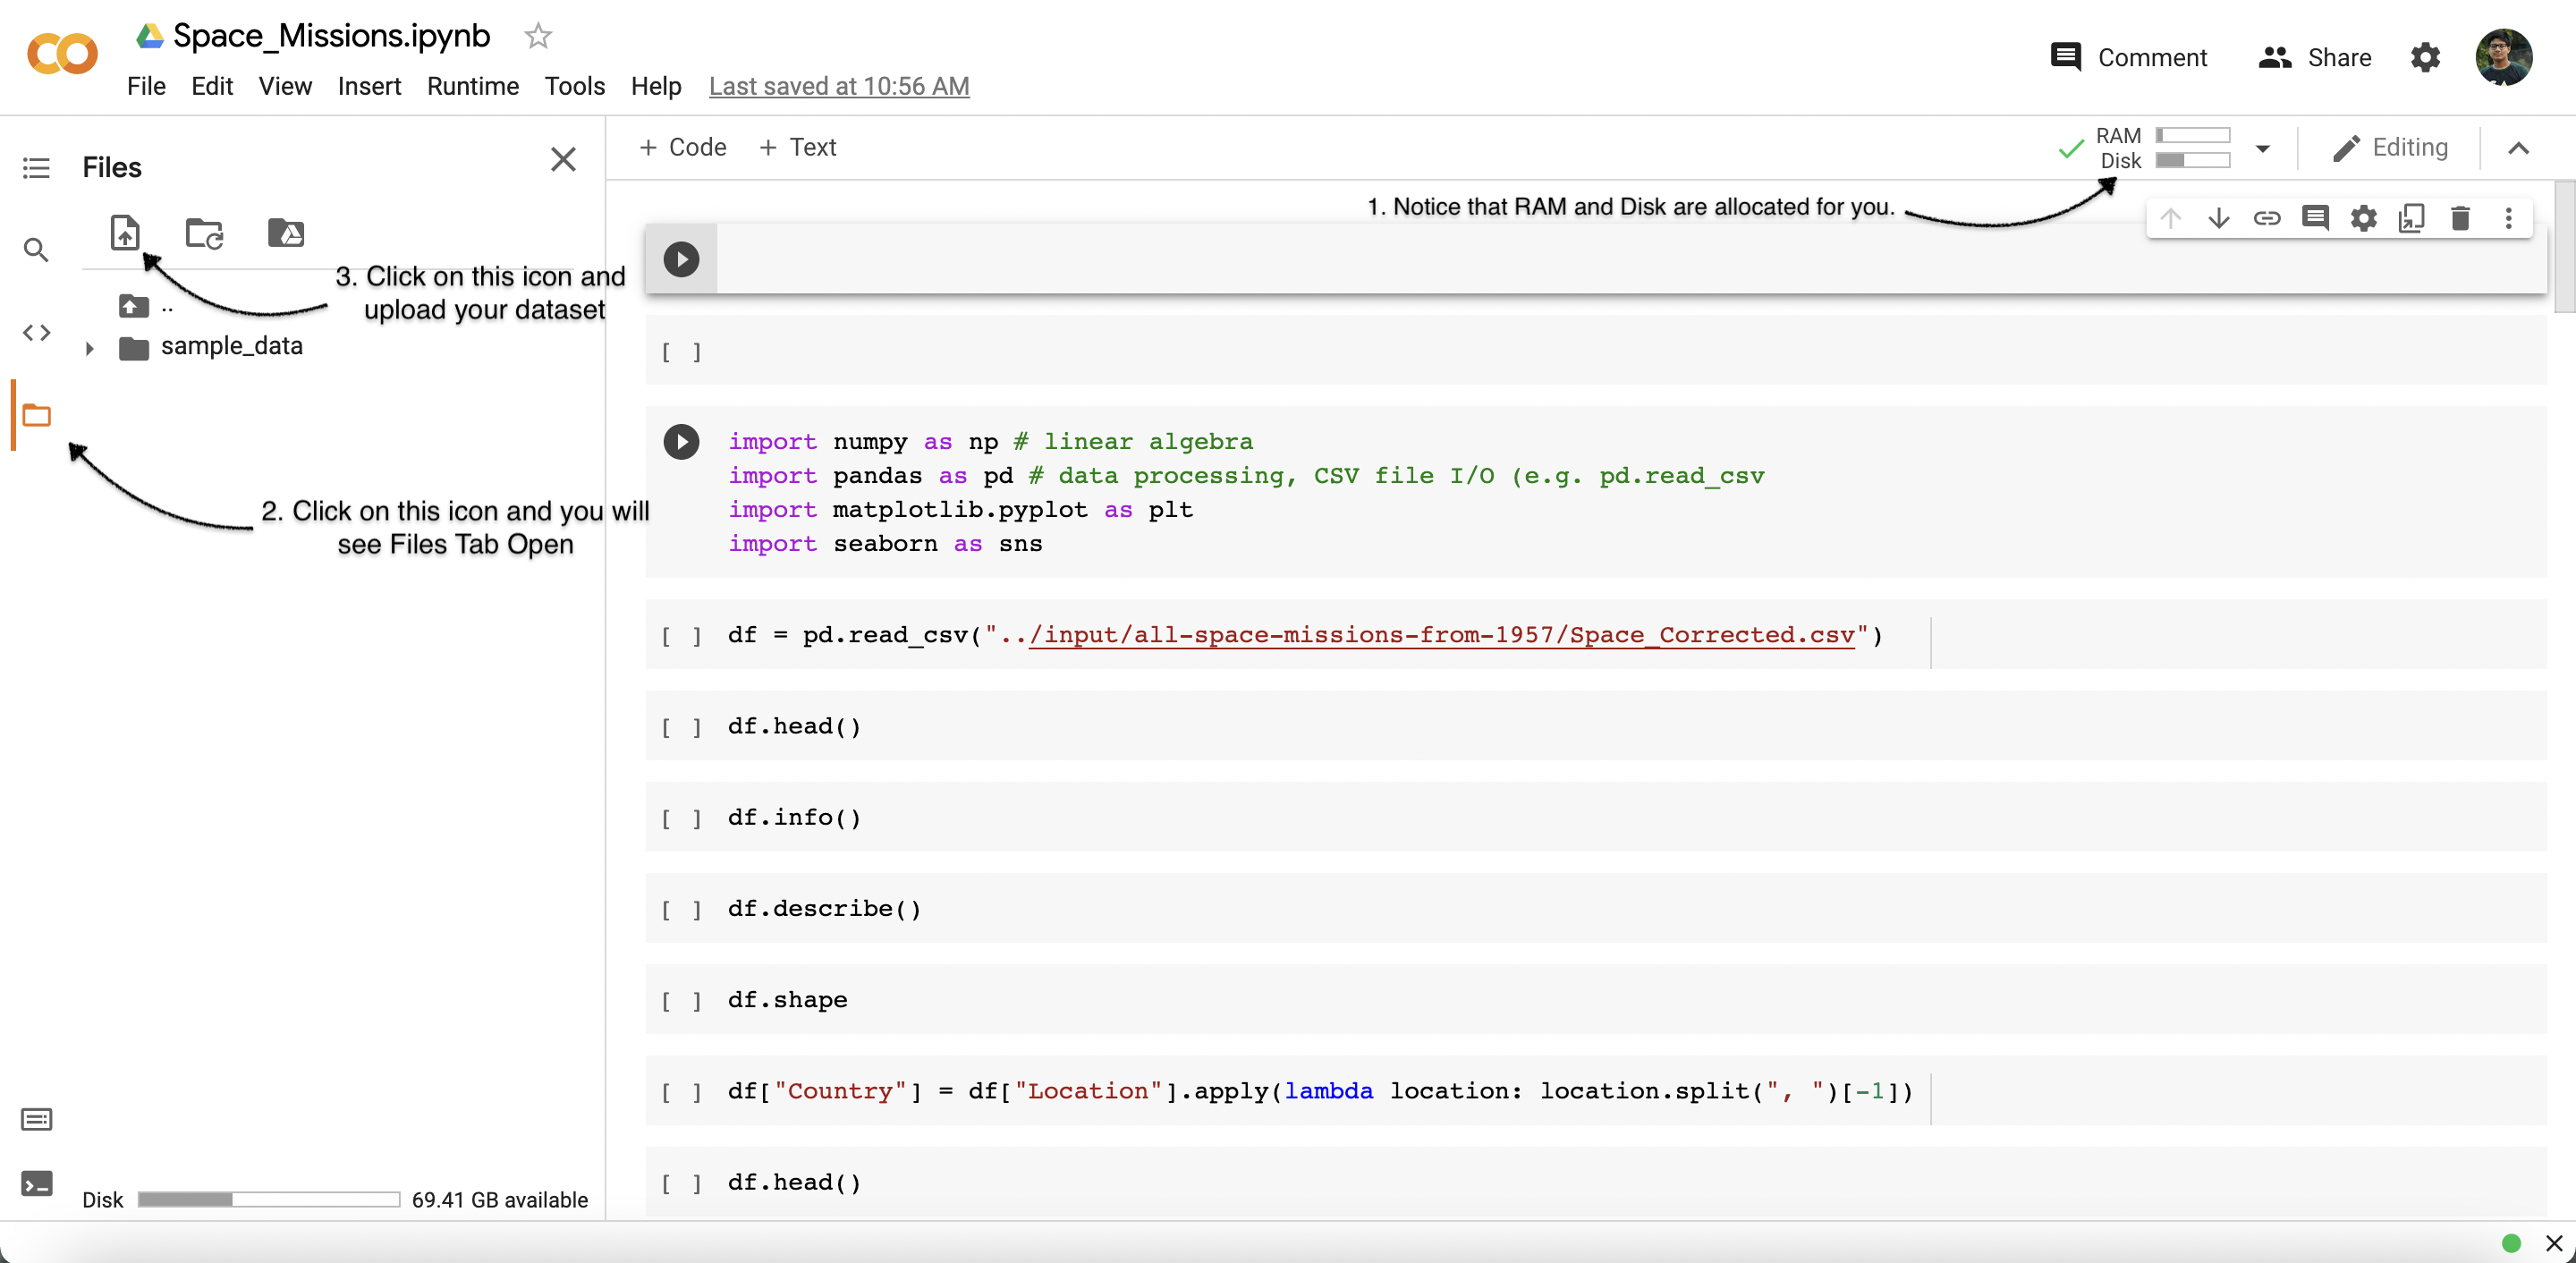
    • Upload your dataset.
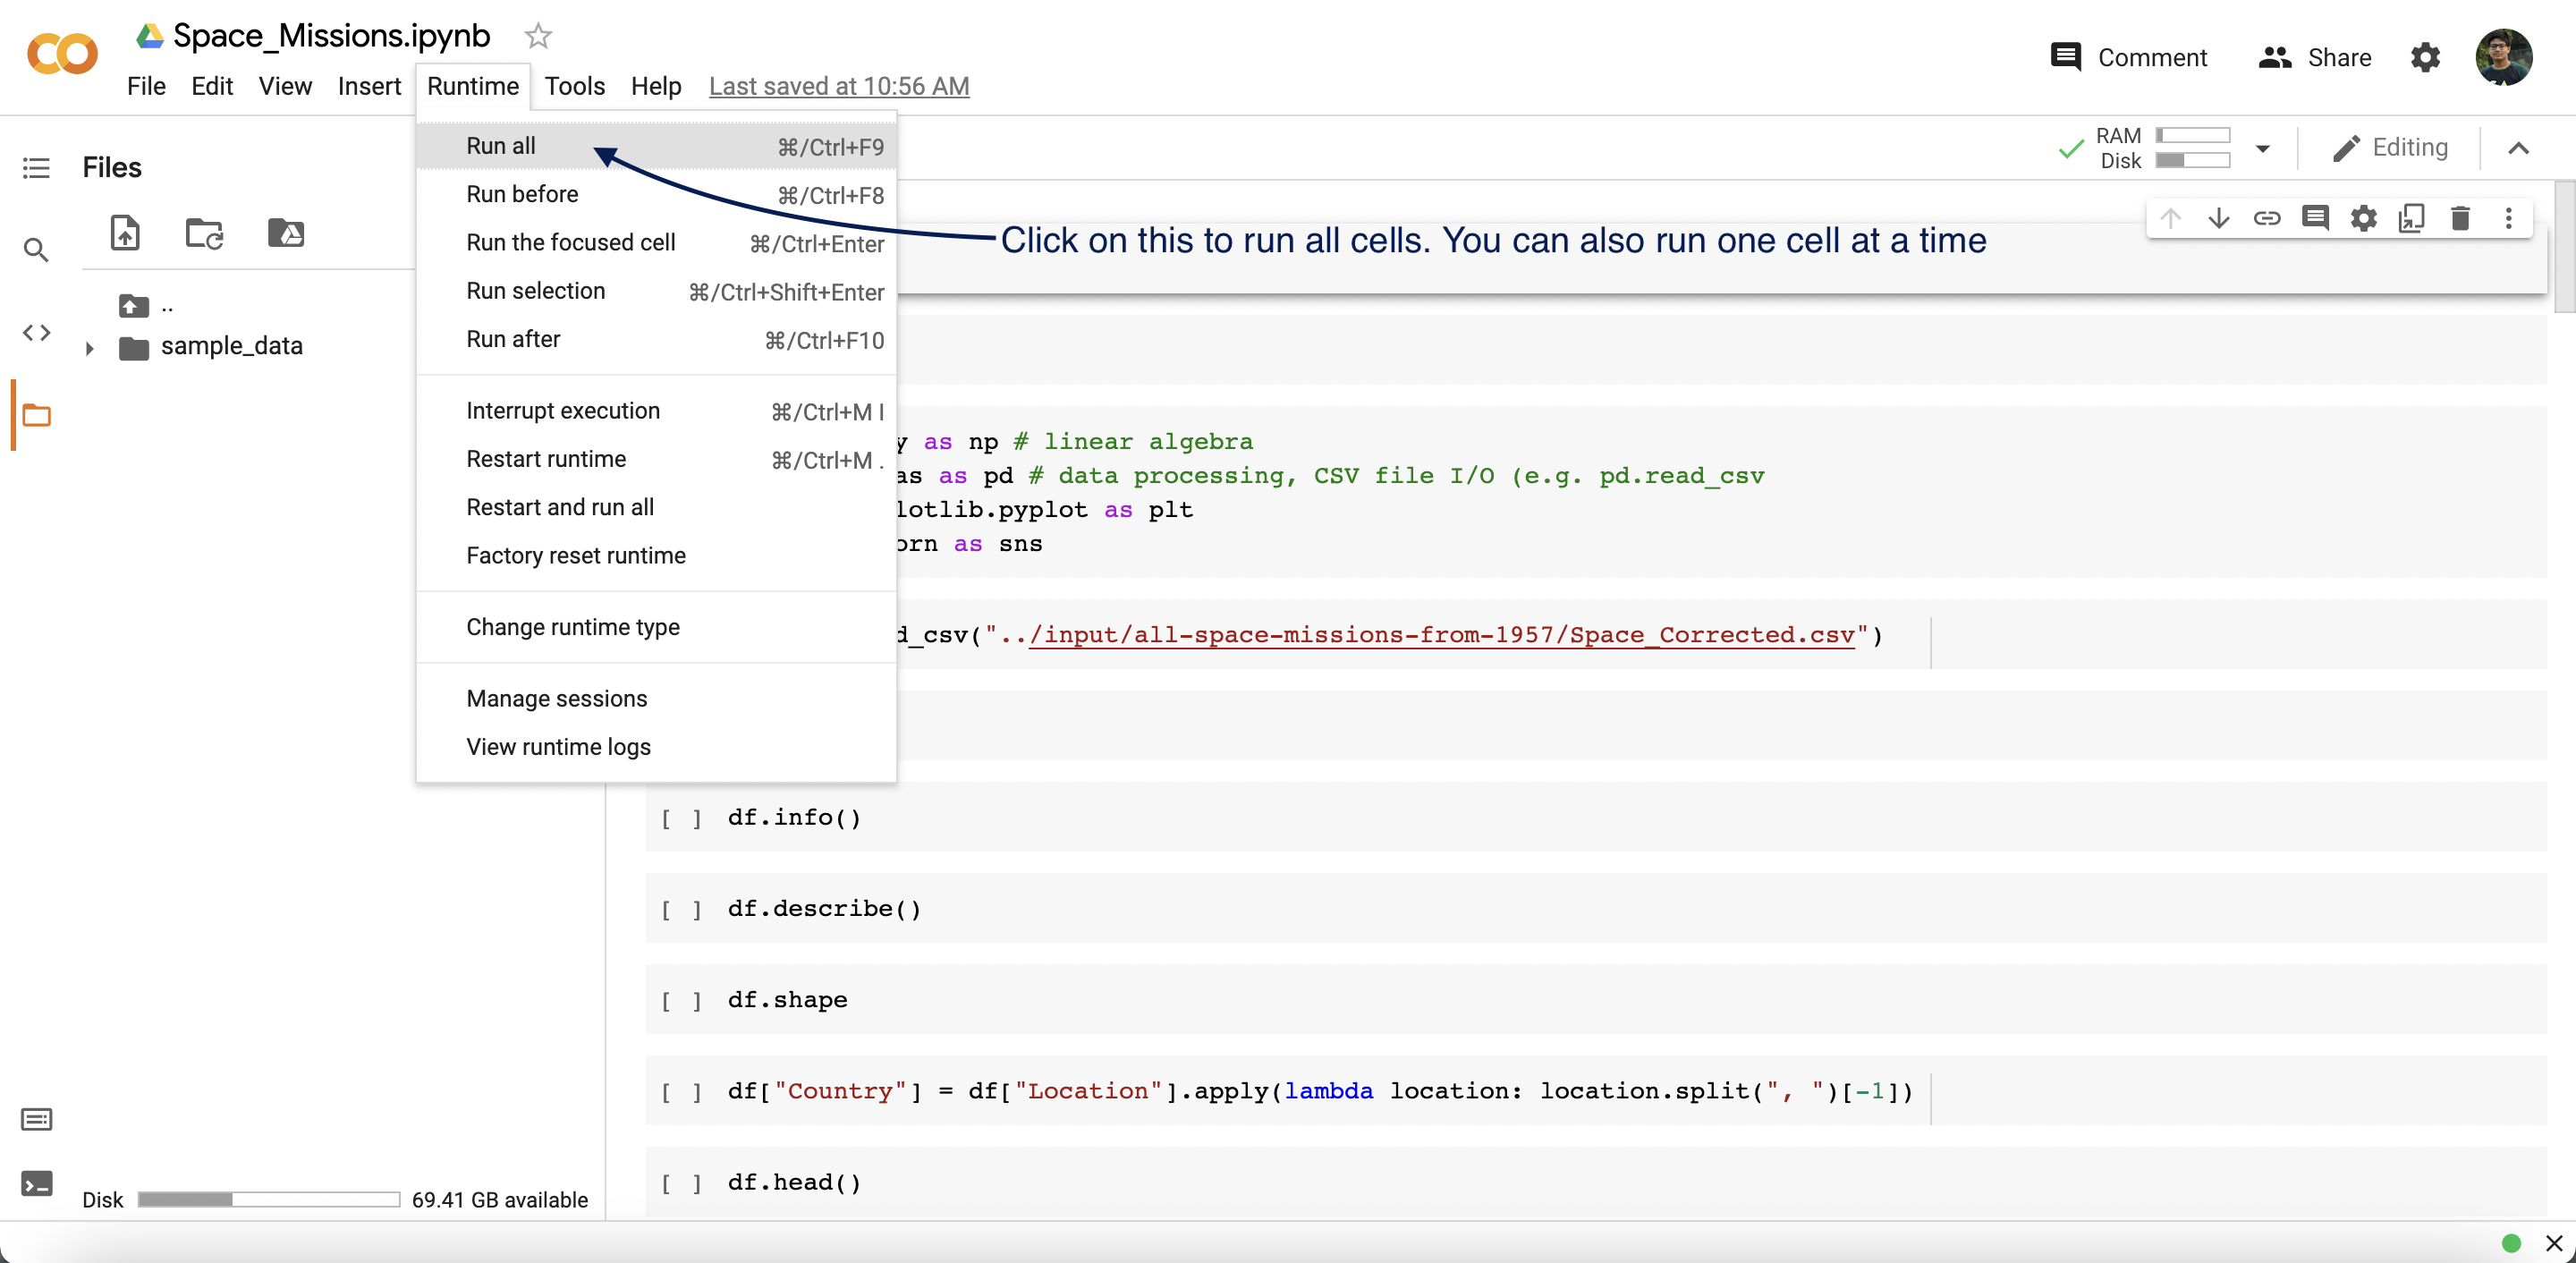
 Colab-3
    • Then Click on Run All. Colab-4
    • Start Editing.
  2. You can also run the code locally in your computer by installing Anaconda.

Preview Notebooks

Notebook will be opened in Google Colab

Built with

Contributing

Please read contributing.md for details on our code of conduct, and the process for submitting pull requests to us.

Authors

License

This project is licensed under the MIT License - see the LICENSE file for details.

Acknowledgments

learn-machine-learn's People

Contributors

kaneki-ken-7 avatar krishnendudakshi2002 avatar anuragc2001 avatar muhammadanas0716 avatar rohanhbtu avatar adiii1436 avatar srini047 avatar

Stargazers

 avatar

learn-machine-learn's Issues

Add Random Forest Classifier

A random forest is a meta estimator that fits a number of decision tree classifiers on various sub-samples of the dataset and uses averaging to improve the predictive accuracy and control over-fitting.

Requested Feature

Build a Random Forest classifier and in the output, f1-score, accuracy and confusion matrix must be printed, there is a function named metrics for printing the accuracy and confusion matrix.
Hyperparameter tuning can be done to improve the accuracy. As the dataset is imbalanced, do prefer f1 score as metric while training.

Add R_2 scores for all the models respectively

Is your feature request related to a problem? Please describe.
The R_2 scores block has been left incomplete. This feature will further help us to visualize the accuracies of all the models at a glance and will help us to pick up the better fitted algorithm on the dataset.

Describe the solution you'd like
Implement R_2 scores on the given dataset given with the predicted model values

Add Polynomial Linear Regression

Is your feature request related to a problem? Please describe.
The polynomial linear regression block has been left incomplete. This feature will further help us to implement another regression model with which we can predict the model with more accuracy.

Describe the solution you'd like
Implement Polynomial Regression on the given dataset given with the required preprocessed entities

Add Logistic Regression

###Requested Feature

Build a Logistic Regression model and in the output, f1-score, accuracy and confusion matrix must be printed, there is a function named metrics for printing the accuracy and confusion matrix.
Hyperparameter tuning can be done to improve the accuracy. As the dataset is imbalanced, do prefer f1 score as metric while training.

Add Ridge Classifier

The Ridge Classifier, based on Ridge regression method, converts the label data into [-1, 1] and solves the problem with regression method. The highest value in prediction is accepted as a target class.

Requested Feature

Build a Ridge classifier and in the output, f1-score, accuracy and confusion matrix must be printed, there is a function named metrics for printing the accuracy and confusion matrix.
Hyperparameter tuning can be done to improve the accuracy. As the dataset is imbalanced, do prefer f1 score as metric while training.

Add Support Vector Regression

Is your feature request related to a problem? Please describe.
The Support Vector Regression block has been left incomplete. This feature will further help us to implement another regression model with which we can predict the model with more accuracy.

Describe the solution you'd like
Implement Support Vector Regression on the given dataset given with the required preprocessed entities

Add KNN classifier

The k-nearest neighbors algorithm, also known as KNN or k-NN, is a non-parametric, supervised learning classifier, which uses proximity to make classifications or predictions about the grouping of an individual data point.

###Requested Feature

Build a KNN classifier and in the output, f1-score, accuracy and confusion matrix must be printed, there is a function named metrics for printing the accuracy and confusion matrix.
Hyperparameter tuning can be done to improve the accuracy. As the dataset is imbalanced, do prefer f1 score as metric while training.

Improvement in Naive Bayes model

A Naive Bayes model is already present in the classification notebook.

Confusion Matrix
True positive (TP): Prediction is +ve and X is Cancerous, we want that
True negative (TN): Prediction is -ve and X is healthy, we want that too
False positive (FP): Prediction is +ve and X is healthy, false alarm, bad
False negative (FN): Prediction is -ve and X is Cancerous, the worst

Requested Feature

improvement in model prediction ( less False positive and less false negative(need more attention and improvement))
Cross validation or hyper parameter tuning can be done to improve the model.

About metrics

Choose Recall if the idea of false positives is far better than false negatives, in other words, if the occurrence of false negatives is unaccepted/intolerable, that you’d rather get some extra false positives(false alarms) over saving some false negatives, like in our cancerous example.

Improve the Random Forest Regression model already implemented on the dataset

Is your feature request related to a problem? Please describe.
The Random Forest Regression code is not predicting results with much accuracy. This feature will further help us to implement another regression model with which we can predict the model with more accuracy.

Describe the solution you'd like
Improve the accuracy of the Random Forest Regression on the given dataset given with the required preprocessed entities

Add Decision Tree Regression

Is your feature request related to a problem? Please describe.
The Decision Tree Regression block has been left incomplete. This feature will further help us to implement another regression model with which we can predict the model with more accuracy.

Describe the solution you'd like
Implement Decision Tree Regression on the given dataset given with the required preprocessed entities

Build a Feed-forward-neural-network for classification using Tensorflow

###Requested Feature

Build a Feed-forward-neural-network, compile and fit on data and in the output, f1-score, accuracy and confusion matrix must be printed, there is a function named metrics for printing the accuracy and confusion matrix. plot accuracy and loss curve for train data and validation data
Hyperparameter tuning or scalling can be done to improve the accuracy. As the dataset is imbalanced, prefer f1 score as metric while training.
Avoid under fitting and over fitting of the model.

Recommend Projects

  • React photo React

    A declarative, efficient, and flexible JavaScript library for building user interfaces.

  • Vue.js photo Vue.js

    🖖 Vue.js is a progressive, incrementally-adoptable JavaScript framework for building UI on the web.

  • Typescript photo Typescript

    TypeScript is a superset of JavaScript that compiles to clean JavaScript output.

  • TensorFlow photo TensorFlow

    An Open Source Machine Learning Framework for Everyone

  • Django photo Django

    The Web framework for perfectionists with deadlines.

  • D3 photo D3

    Bring data to life with SVG, Canvas and HTML. 📊📈🎉

Recommend Topics

  • javascript

    JavaScript (JS) is a lightweight interpreted programming language with first-class functions.

  • web

    Some thing interesting about web. New door for the world.

  • server

    A server is a program made to process requests and deliver data to clients.

  • Machine learning

    Machine learning is a way of modeling and interpreting data that allows a piece of software to respond intelligently.

  • Game

    Some thing interesting about game, make everyone happy.

Recommend Org

  • Facebook photo Facebook

    We are working to build community through open source technology. NB: members must have two-factor auth.

  • Microsoft photo Microsoft

    Open source projects and samples from Microsoft.

  • Google photo Google

    Google ❤️ Open Source for everyone.

  • D3 photo D3

    Data-Driven Documents codes.