Code Monkey home page Code Monkey logo

benchmarkdotnet's Introduction

NuGet MyGet Downloads Stars License Twitter

BenchmarkDotNet helps you to transform methods into benchmarks, track their performance, and share reproducible measurement experiments. It's no harder than writing unit tests! Under the hood, it performs a lot of magic that guarantees reliable and precise results thanks to the perfolizer statistical engine. BenchmarkDotNet protects you from popular benchmarking mistakes and warns you if something is wrong with your benchmark design or obtained measurements. The results are presented in a user-friendly form that highlights all the important facts about your experiment. BenchmarkDotNet is already adopted by 19100+ GitHub projects including .NET Runtime, .NET Compiler, .NET Performance, and many others.

It's easy to start writing benchmarks, check out the following example (copy-pastable version is here):

[SimpleJob(RuntimeMoniker.Net472, baseline: true)]
[SimpleJob(RuntimeMoniker.NetCoreApp30)]
[SimpleJob(RuntimeMoniker.NativeAot70)]
[SimpleJob(RuntimeMoniker.Mono)]
[RPlotExporter]
public class Md5VsSha256
{
    private SHA256 sha256 = SHA256.Create();
    private MD5 md5 = MD5.Create();
    private byte[] data;

    [Params(1000, 10000)]
    public int N;

    [GlobalSetup]
    public void Setup()
    {
        data = new byte[N];
        new Random(42).NextBytes(data);
    }

    [Benchmark]
    public byte[] Sha256() => sha256.ComputeHash(data);

    [Benchmark]
    public byte[] Md5() => md5.ComputeHash(data);
}

BenchmarkDotNet automatically runs the benchmarks on all the runtimes, aggregates the measurements, and prints a summary table with the most important information:

BenchmarkDotNet=v0.12.0, OS=Windows 10.0.17763.805 (1809/October2018Update/Redstone5)
Intel Core i7-7700K CPU 4.20GHz (Kaby Lake), 1 CPU, 8 logical and 4 physical cores
  [Host]       : .NET Framework 4.7.2 (4.7.3468.0), X64 RyuJIT
  Net472       : .NET Framework 4.7.2 (4.7.3468.0), X64 RyuJIT
  NetCoreApp30 : .NET Core 3.0.0 (CoreCLR 4.700.19.46205, CoreFX 4.700.19.46214), X64 RyuJIT
  NativeAot70  : .NET 7.0.0-preview.4.22172.7, X64 NativeAOT
  Mono         : Mono 6.4.0 (Visual Studio), X64


| Method |       Runtime |     N |       Mean |     Error |    StdDev | Ratio |
|------- |-------------- |------ |-----------:|----------:|----------:|------:|
| Sha256 |    .NET 4.7.2 |  1000 |   7.735 us | 0.1913 us | 0.4034 us |  1.00 |
| Sha256 | .NET Core 3.0 |  1000 |   3.989 us | 0.0796 us | 0.0745 us |  0.50 |
| Sha256 | NativeAOT 7.0 |  1000 |   4.091 us | 0.0811 us | 0.1562 us |  0.53 |
| Sha256 |          Mono |  1000 |  13.117 us | 0.2485 us | 0.5019 us |  1.70 |
|        |               |       |            |           |           |       |
|    Md5 |    .NET 4.7.2 |  1000 |   2.872 us | 0.0552 us | 0.0737 us |  1.00 |
|    Md5 | .NET Core 3.0 |  1000 |   1.848 us | 0.0348 us | 0.0326 us |  0.64 |
|    Md5 | NativeAOT 7.0 |  1000 |   1.817 us | 0.0359 us | 0.0427 us |  0.63 |
|    Md5 |          Mono |  1000 |   3.574 us | 0.0678 us | 0.0753 us |  1.24 |
|        |               |       |            |           |           |       |
| Sha256 |    .NET 4.7.2 | 10000 |  74.509 us | 1.5787 us | 4.6052 us |  1.00 |
| Sha256 | .NET Core 3.0 | 10000 |  36.049 us | 0.7151 us | 1.0025 us |  0.49 |
| Sha256 | NativeAOT 7.0 | 10000 |  36.253 us | 0.7076 us | 0.7571 us |  0.49 |
| Sha256 |          Mono | 10000 | 116.350 us | 2.2555 us | 3.0110 us |  1.58 |
|        |               |       |            |           |           |       |
|    Md5 |    .NET 4.7.2 | 10000 |  17.308 us | 0.3361 us | 0.4250 us |  1.00 |
|    Md5 | .NET Core 3.0 | 10000 |  15.726 us | 0.2064 us | 0.1930 us |  0.90 |
|    Md5 | NativeAOT 7.0 | 10000 |  15.627 us | 0.2631 us | 0.2461 us |  0.89 |
|    Md5 |          Mono | 10000 |  30.205 us | 0.5868 us | 0.6522 us |  1.74 |

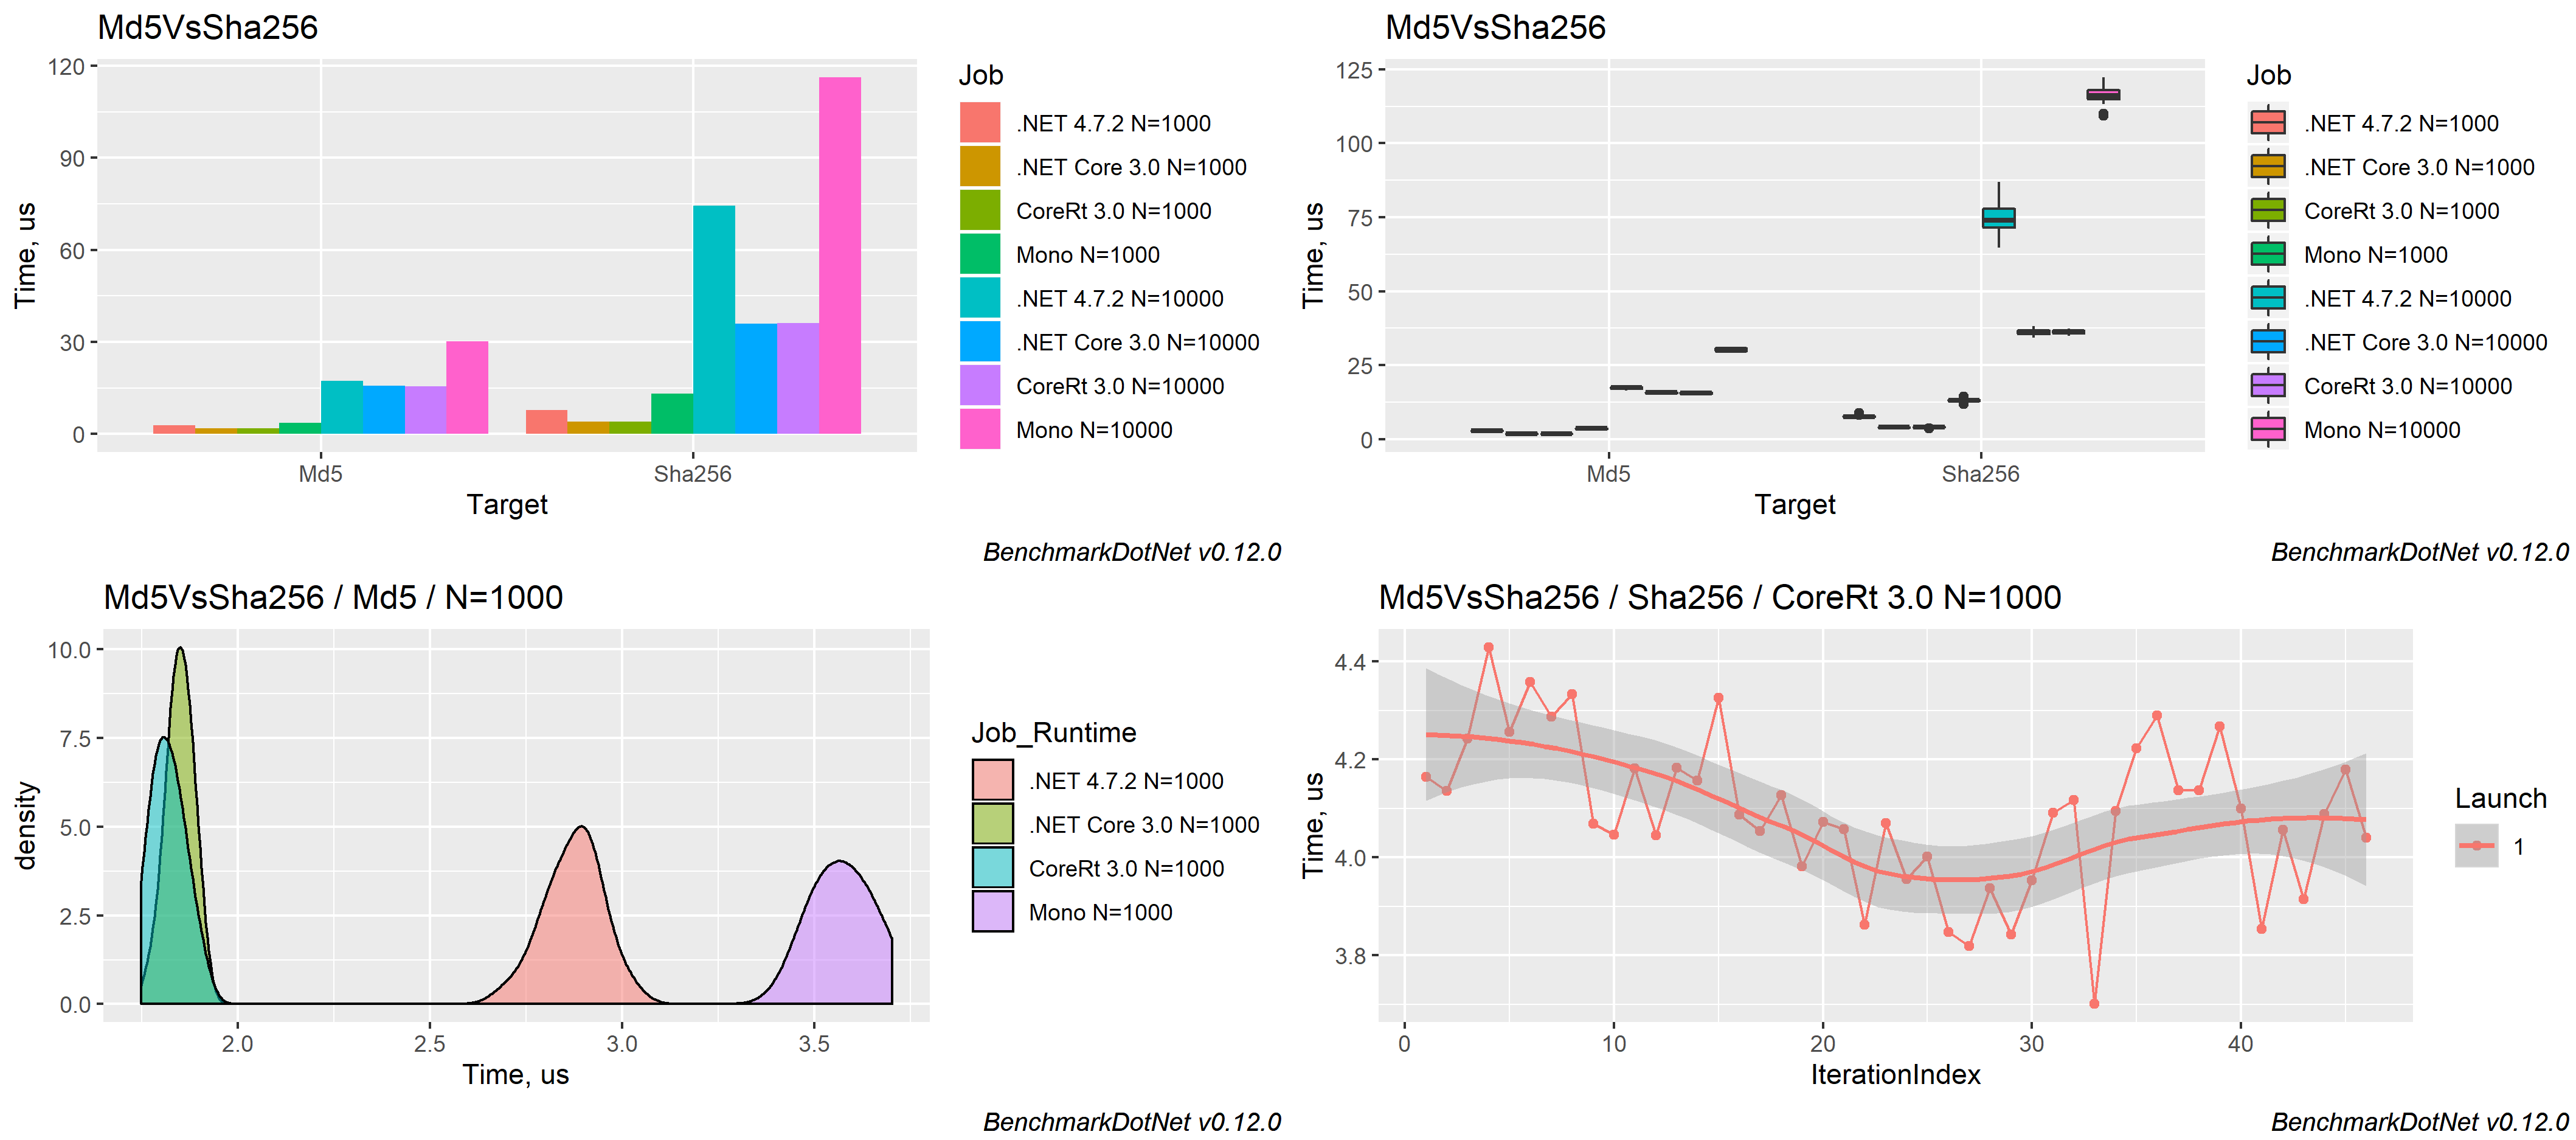
The measured data can be exported to different formats (md, html, csv, xml, json, etc.) including plots:

Supported runtimes: .NET 5+, .NET Framework 4.6.1+, .NET Core 2.0+, Mono, NativeAOT
Supported languages: C#, F#, Visual Basic
Supported OS: Windows, Linux, macOS
Supported architectures: x86, x64, ARM, ARM64, Wasm and LoongArch64

Features

BenchmarkDotNet has tons of features that are essential in comprehensive performance investigations. Four aspects define the design of these features: simplicity, automation, reliability, and friendliness.

Simplicity

You shouldn't be an experienced performance engineer if you want to write benchmarks. You can design very complicated performance experiments in the declarative style using simple APIs.

For example, if you want to parameterize your benchmark, mark a field or a property with [Params(1, 2, 3)]: BenchmarkDotNet will enumerate all of the specified values and run benchmarks for each case. If you want to compare benchmarks with each other, mark one of the benchmarks as the baseline via [Benchmark(Baseline = true)]: BenchmarkDotNet will compare it with all of the other benchmarks. If you want to compare performance in different environments, use jobs. For example, you can run all the benchmarks on .NET Core 3.0 and Mono via [SimpleJob(RuntimeMoniker.NetCoreApp30)] and [SimpleJob(RuntimeMoniker.Mono)].

If you don't like attributes, you can call most of the APIs via the fluent style and write code like this:

ManualConfig.CreateEmpty() // A configuration for our benchmarks
    .AddJob(Job.Default // Adding first job
        .WithRuntime(ClrRuntime.Net472) // .NET Framework 4.7.2
        .WithPlatform(Platform.X64) // Run as x64 application
        .WithJit(Jit.LegacyJit) // Use LegacyJIT instead of the default RyuJIT
        .WithGcServer(true) // Use Server GC
    ).AddJob(Job.Default // Adding second job
        .AsBaseline() // It will be marked as baseline
        .WithEnvironmentVariable("Key", "Value") // Setting an environment variable
        .WithWarmupCount(0) // Disable warm-up stage
    );

If you prefer command-line experience, you can configure your benchmarks via the console arguments in any console application (other types of applications are not supported).

Automation

Reliable benchmarks always include a lot of boilerplate code.

Let's think about what you should do in a typical case. First, you should perform a pilot experiment and determine the best number of method invocations. Next, you should execute several warm-up iterations and ensure that your benchmark achieved a steady state. After that, you should execute the main iterations and calculate some basic statistics. If you calculate some values in your benchmark, you should use it somehow to prevent dead code elimination. If you use loops, you should care about the effect of the loop unrolling on your results (which may depend on the processor architecture). Once you get results, you should check for some special properties of the obtained performance distribution like multimodality or extremely high outliers. You should also evaluate the overhead of your infrastructure and deduct it from your results. If you want to test several environments, you should perform the measurements in each of them and manually aggregate the results.

If you write this code from scratch, it's easy to make a mistake and spoil your measurements. Note that it's a shortened version of the full checklist that you should follow during benchmarking: there are a lot of additional hidden pitfalls that should be handled appropriately. Fortunately, you shouldn't worry about it because BenchmarkDotNet will perform this boring and time-consuming stuff for you.

Moreover, the library can help you with some advanced tasks that you may want to perform during the investigation. For example, BenchmarkDotNet can measure the managed and native memory traffic and print disassembly listings for your benchmarks.

Reliability

A lot of hand-written benchmarks produce wrong numbers that lead to incorrect business decisions. BenchmarkDotNet protects you from most of the benchmarking pitfalls and allows achieving high measurement precision.

You shouldn't worry about the perfect number of method invocation, the number of warm-up and actual iterations: BenchmarkDotNet tries to choose the best benchmarking parameters and achieve a good trade-off between the measurement prevision and the total duration of all benchmark runs. So, you shouldn't use any magic numbers (like "We should perform 100 iterations here"), the library will do it for you based on the values of statistical metrics.

BenchmarkDotNet also prevents benchmarking of non-optimized assemblies that were built using DEBUG mode because the corresponding results will be unreliable. The library will print a warning if you have an attached debugger, if you use a hypervisor (HyperV, VMware, VirtualBox), or if you have any other problems with the current environment.

During 6+ years of development, we faced dozens of different problems that may spoil your measurements. Inside BenchmarkDotNet, there are a lot of heuristics, checks, hacks, and tricks that help you to increase the reliability of the results.

Friendliness

Analysis of performance data is a time-consuming activity that requires attentiveness, knowledge, and experience. BenchmarkDotNet performs the main part of this analysis for you and presents results in a user-friendly form.

After the experiments, you get a summary table that contains a lot of useful data about the executed benchmarks. By default, it includes only the most important columns, but they can be easily customized. The column set is adaptive and depends on the benchmark definition and measured values. For example, if you mark one of the benchmarks as a baseline, you will get additional columns that will help you to compare all the benchmarks with the baseline. By default, it always shows the Mean column, but if we detected a vast difference between the Mean and the Median values, both columns will be presented.

BenchmarkDotNet tries to find some unusual properties of your performance distributions and prints nice messages about it. For example, it will warn you in case of multimodal distribution or high outliers. In this case, you can scroll the results up and check out ASCII-style histograms for each distribution or generate beautiful png plots using [RPlotExporter].

BenchmarkDotNet doesn't overload you with data; it shows only the essential information depending on your results: it allows you to keep the summary small for primitive cases and extend it only for complicated cases. Of course, you can request any additional statistics and visualizations manually. If you don't customize the summary view, the default presentation will be as much user-friendly as possible. :)

Learn more about benchmarking

BenchmarkDotNet is not a silver bullet that magically makes all of your benchmarks correct and analyzes the measurements for you. Even if you use this library, you still should know how to design benchmark experiments and how to make correct conclusions based on the raw data. If you want to know more about benchmarking methodology and good practices, it's recommended to read a book by Andrey Akinshin (the BenchmarkDotNet project lead): "Pro .NET Benchmarking". Use this in-depth guide to correctly design benchmarks, measure key performance metrics of .NET applications, and analyze results. This book presents dozens of case studies to help you understand complicated benchmarking topics. You will avoid common pitfalls, control the accuracy of your measurements, and improve the performance of your software.

Contributions are welcome!

BenchmarkDotNet is already a stable full-featured library that allows performing performance investigation on a professional level. And it continues to evolve! We add new features all the time, but we have too many new cool ideas. Any help will be appreciated. You can develop new features, fix bugs, improve the documentation, or do some other cool stuff.

If you want to contribute, check out the Contributing guide and up-for-grabs issues. If you have new ideas or want to complain about bugs, feel free to create a new issue. Let's build the best tool for benchmarking together!

Code of Conduct

This project has adopted the code of conduct defined by the Contributor Covenant to clarify expected behavior in our community. For more information, see the .NET Foundation Code of Conduct.

Sponsors

BenchmarkDotNet is supported by the AWS Open Source Software Fund.

benchmarkdotnet's People

Contributors

adamsitnik avatar alinasmirnova avatar andreyakinshin avatar caaavik-msft avatar dlemstra avatar epeshk avatar fransbouma avatar gigi81 avatar gsomix avatar ig-sinicyn avatar kant2002 avatar ky7m avatar lahma avatar lukasz-pyrzyk avatar martincostello avatar mattwarren avatar mawosoft avatar michalstrehovsky avatar morgan-kn avatar naricc avatar radekdoulik avatar radical avatar redknightlois avatar rizzen avatar tebeco avatar teknikaali avatar timcassell avatar wojciechnagorski avatar yegorstepanov avatar yohdeadfall avatar

Stargazers

 avatar  avatar  avatar  avatar  avatar  avatar  avatar  avatar  avatar  avatar  avatar  avatar  avatar  avatar  avatar  avatar  avatar  avatar  avatar  avatar  avatar  avatar  avatar  avatar  avatar  avatar  avatar  avatar  avatar  avatar  avatar  avatar  avatar  avatar  avatar  avatar  avatar  avatar  avatar  avatar  avatar  avatar  avatar  avatar  avatar  avatar  avatar  avatar  avatar  avatar  avatar  avatar  avatar  avatar  avatar  avatar  avatar  avatar  avatar  avatar  avatar  avatar  avatar  avatar  avatar  avatar  avatar  avatar  avatar  avatar  avatar  avatar  avatar  avatar  avatar  avatar  avatar  avatar  avatar  avatar  avatar  avatar  avatar  avatar  avatar  avatar  avatar  avatar  avatar  avatar  avatar  avatar  avatar  avatar  avatar  avatar  avatar  avatar  avatar  avatar

Watchers

 avatar  avatar  avatar  avatar  avatar  avatar  avatar  avatar  avatar  avatar  avatar  avatar  avatar  avatar  avatar  avatar  avatar  avatar  avatar  avatar  avatar  avatar  avatar  avatar  avatar  avatar  avatar  avatar  avatar  avatar  avatar  avatar  avatar  avatar  avatar  avatar  avatar  avatar  avatar  avatar  avatar  avatar  avatar  avatar  avatar  avatar  avatar  avatar  avatar  avatar  avatar  avatar  avatar  avatar  avatar  avatar  avatar  avatar  avatar  avatar  avatar  avatar  avatar  avatar  avatar  avatar  avatar  avatar  avatar  avatar  avatar  avatar  avatar  avatar  avatar  avatar  avatar  avatar  avatar  avatar  avatar  avatar  avatar  avatar  avatar  avatar  avatar  avatar  avatar  avatar  avatar  avatar  avatar  avatar  avatar  avatar  avatar  avatar  avatar  avatar

benchmarkdotnet's Issues

Missing final tick reporting

I am using BenchmarkDotNet for very fast code blocks, so milliseconds precision is not enough for appropriate comparison in my case. Usually in such cases people use ticks for micro-benchmarks.

Now in BenchmarkDotNet you can get ticks statistics per-task if DetailedMode and DefaultPrintBenchmarkBodyToConsole are set. But unfortunately, it is quite hard to find that numbers in a bunch of text in competition output and compare them, especially when you have many tasks in one competition.

From my point of view, it will be very useful to add median tick count to the final competition result (either only if DetailedMode is true, or independently from it).

Displaying MSBuild output

A few times I've run into issues where the MSBuild task doesn't work and // OveralResult = Failure is printed. I'll post a separate issue for the exact problem, but I wondered if having a cut-down version of the MSBuild output is valuable? This would help diagnose why the build is failing, otherwise it's not obvious.

With a bit of playing around I've been able to get something like this working, note that all the text between // Build: and // OveralResult = Failure is coming from MSBuild.

image

What do you think? I can get it to display build errors and/or warnings if needed.

For comparison, this is a successful compile with only the warning(s) shown (but these could be hidden if desired, so that only errors are printed):

image

Something isn't right with metrics

So I've been running the Math_DoubleSqrtAvx as a matter of course and I noticed something very strange started to happen on my machine -- the metrics are completely wrong.

I think this was introduced in 66cce47.

Example:

Running with 52acca1 (previous commit):

// BenchmarkDotNet=v0.7.6.0
// OS=Microsoft Windows NT 6.2.9200.0
// Processor=Intel(R) Core(TM) i7-3770 CPU @ 3.40GHz, ProcessorCount=4
// CLR=MS.NET 4.0.30319.42000, Arch=64-bit  [RyuJIT]
Common:  Type=Math_DoubleSqrtAvx  Mode=Throughput  Platform=X64  Jit=RyuJit  .NET=Current

 Method |  AvrTime |     StdDev |           op/s |
------- |--------- |----------- |--------------- |
 Sqrt13 | 58.23 ns | 0.11300 ns |  17,171,847.17 |
 Sqrt14 |  1.56 ns | 0.00402 ns | 641,502,698.72 |

Running with 66cce47 (potential bad commit):

// BenchmarkDotNet=v0.7.6.0
// OS=Microsoft Windows NT 6.2.9200.0
// Processor=Intel(R) Core(TM) i7-3770 CPU @ 3.40GHz, ProcessorCount=4
// Host CLR=MS.NET 4.0.30319.42000, Arch=64-bit  [RyuJIT]
Common:  Type=Math_DoubleSqrtAvx  Mode=Throughput  Platform=X64  Jit=RyuJit  .NET=Current


 Method |     AvrTime |     StdDev |                   op/s |
------- |------------ |----------- |----------------------- |
 Sqrt13 |    58.08 ns |   0.111 ns |          17,216,262.42 |
 Sqrt14 | 0.000000 ns | 0.00712 ns | 27,161,311,692,613,400 |

Clearly there is something wrong here.

Another observation: benchmarks take absolutely ages to run after this commit.

I haven't looked into this in detail, but where it seems to go wrong, we get lines like this:

Target 1: 8200000000 op, 237.3 ms, 237279581.2 ns, 786056 ticks, 0.0289 ns/op, 34558388715.3 op/s
Target 2: 8200000000 op, 29.7 ms, 29687115.1 ns, 98347 ticks, 0.0036 ns/op, 276214107191.9 op/s
Target 3: 8200000000 op, 0 ms, 301.9 ns, 1 ticks, 0 ns/op, 27164828800000000 op/s
Target 4: 8200000000 op, 59.2 ms, 59171077.9 ns, 196021 ticks, 0.0072 ns/op, 138581217318.6 op/s
Target 5: 8200000000 op, 0 ms, 301.9 ns, 1 ticks, 0 ns/op, 27164828800000000 op/s
Target 6: 8200000000 op, 0 ms, 301.9 ns, 1 ticks, 0 ns/op, 27164828800000000 op/s
Target 7: 8200000000 op, 0 ms, 301.9 ns, 1 ticks, 0 ns/op, 27164828800000000 op/s
Target 8: 8200000000 op, 0 ms, 301.9 ns, 1 ticks, 0 ns/op, 27164828800000000 op/s
Target 9: 8200000000 op, 0 ms, 301.9 ns, 1 ticks, 0 ns/op, 27164828800000000 op/s
Target 10: 8200000000 op, 0 ms, 301.9 ns, 1 ticks, 0 ns/op, 27164828800000000 op/s

I have captured the logs in a separate gist to keep this short:

Add JIT benchmarks for struct promotion

I'm actually thiking of doing this myself, but I thought I'd put it up here until I get to actually do it.

I'd like to verify the RyuJIT does indeed provide the optimization describes here:
Lies, damn lies, and benchmarks...

I'm referring namely to struct-promotion.

There's even a link to some code that should demonstrate this in RyuJIT here

It would be nice to actually verify this in reality... hence this issue

Command line argument handling

@AndreyAkinshin

I imagine that over time we're going to need more and more command line switches for different modes.

So that everything is handled in a clean way I propose that we use Mono.Options, it's main advantage is that it's a single file that can easily be embedded in BenchmarkDotNet.

I've used it before and it's easy to work with, you end up with a single class that contains all the options as properties and then you can use that throughout the rest of the code.

Unless there are any objections or alternative suggestions I'll go ahead and integrate it over the next week or so.

F# requiring assembly binding redirects for FSharp.Core

I'm trying to benchmark some F# code. However, to work properly, the F# application requires an assembly binding redirect (App.config):

<?xml version="1.0" encoding="utf-8" ?>
<configuration>
  <runtime>
    <assemblyBinding xmlns="urn:schemas-microsoft-com:asm.v1">
      <dependentAssembly>
        <assemblyIdentity name="FSharp.Core" publicKeyToken="b03f5f7f11d50a3a" culture="neutral" />
        <bindingRedirect oldVersion="0.0.0.0-999.999.999.999" newVersion="4.4.0.0" />
      </dependentAssembly>
    </assemblyBinding>
  </runtime>
  <startup>
    <supportedRuntime version="v4.0" sku=".NETFramework,Version=v4.5.2" />
  </startup>
</configuration>

The supportedRuntime parts are not desirable of course, but if the assembly binding isn't done, the auto generated application will fail at runtime. The app.config generated won't include anything like this.

I'm not sure how to work around it, or suggest it could be fixed. Taking the app.config from the host app if one exists seems vaguely possible, but a bit random and risky, there's no reason why it should really be correct. Being able to specify app.config elements might be possible I guess...

Add a "Delta v. Baseline" column

As per this benchmark, it would be nice if we could automatically produce the "% Delta v..." column, rather than users having to add it by hand.

image

If could either be a '%' or an absolute value in ms/ns. Also the baseline benchmark would need to be specified, probably via an attribute, such as [BenchmarkBaseline] or maybe [Benchmark(baseline: true)]

TaskAttribute name is ambigous

With System.Threading.Tasks.Task. Yes, we can use full name like [TaskAttribute] or [BenchmarkDotNet.Tasks.Task], but it maybe better to rename attribute to resolve this frequently occurring naming conflict.

Dependent assemblies are not copied or added to the project file.

When benchmarking complex operations you may end up with situations like the following:

On assembly assembly1.dll

public class A
{}

On assembly benchmark.dll

public class Program : A
{
   [Benchmark]
   public void Method ()
   {
       // calling some method of A for initialization.  
   }
}

In this case benchmark.dll will be referenced while assembly1.dll is not causing a build failure like the following:

// **************************
// Benchmark: Program_Method (Throughput_HostPlatform_HostJit_NET-HostFramework_ArraySize) [-w=5 -t=10]
// Generated project: G:\Src\ravendb-3.5-git\Raven.Voron\Voron.Tryout\bin\Release\Program_InsertInTable_Throughput_HostPlatform_HostJit_NET-HostFramework_ArraySize
// Build:
// Program.cs(14,18): error CS0012: The type 'Voron.Tests.Tables.TableStorageTest' is defined in an assembly that is not  referenced. You must add a reference to assembly 'Voron.Tests, Version=1.0.0.0, Culture=neutral, PublicKeyToken=37f41c7f99471593'.
// OverallResult = Failure
// ***** Competition: Finish  *****

BenchmarkDotNet Out-of-box experience and "getting started" documentation

I just wanted to put together a list of things that I think could be done to make it easier for new users to get started with BenchmarkDotNet.

  • Getting started guide on the github repo
    • at the moment the front page mostly covers "Why is microbenchmarking hard?", which is really valuable, but I think it should be put elsewhere and linked to.
    • I think the first thing people should see is a list of features (there already), plus a really brief "getting started" guide, showing how to write a simple benchmark and how to run it (some of this already exists).
  • Use NuGet to automatically add a simple benchmark to your project when you add the BenchmarkDotNet package.
  • ????? (anything else)

Let me know if you have any other ideas and I'll add them to the list above, then we can tick them off as they get done.

Generated code fails to build

I tried to run a small benchmark from LINQPad, and the generated code fails to compile:

using System;
using System.Diagnostics;
using System.Threading;
using System.Runtime.CompilerServices;
using BenchmarkDotNet;
using BenchmarkDotNet.Tasks;
using ;
using System;


namespace BenchmarkDotNet.Autogenerated
{
    public class Program : UserQuery.CallStyleBenchmark
    {
        public static void Main(string[] args)
        {
...

This is caused by the empty using clause on line 7

Change layout of the BenchmarkDotNet.Samples

I just wanted to check there was no objections before I went ahead and did this.

As the amount of samples have grown, they have got a bit unwieldy to work with in VS, I propose the layout be changed to :

image

So that samples are grouped into categories.

No files names will be changed, just location and namespaces, is that okay?

# of GC Collections [Diagnostic/Diagnoser]

While working on a Benchmark for a dotnet/corefx issue that I was following, I did a quick hack to calculate the # of Gen0, Gen1 and Gen2 Collections during a Benchmark run/batch. At the moment it gives you results like so:

                                                                    | GC Collections per 1 million ops  |
    Method | StringLength |     AvrTime |    StdDev |          op/s |      Gen0 |      Gen1 |      Gen2 |
---------- |------------- |------------ |---------- |-------------- |-----------|-----------|-----------|
  Original |            1 |  42.4204 ns | 0.2792 ns | 23,573,547.49 |     10.17 |      0.00 |      0.00 |
  Improved |            1 |  34.2644 ns | 0.5882 ns | 29,185,409.98 |      0.00 |      0.00 |      0.00 |
  Original |            5 |  51.4178 ns | 0.5020 ns | 19,448,520.71 |     12.70 |      0.00 |      0.00 |
  Improved |            5 |  40.5619 ns | 0.4539 ns | 24,653,698.63 |      0.00 |      0.00 |      0.00 |
  Original |           10 |  65.3267 ns | 4.1725 ns | 15,307,753.00 |     15.25 |      0.00 |      0.00 |
  Improved |           10 |  53.0060 ns | 0.7845 ns | 18,865,819.59 |      0.00 |      0.00 |      0.00 |
  Original |           20 |  72.5353 ns | 3.3984 ns | 13,787,096.28 |     22.86 |      0.00 |      0.00 |
  Improved |           20 |  57.9108 ns | 0.6775 ns | 17,267,957.76 |      0.00 |      0.00 |      0.00 |
  Original |           50 | 239.1619 ns | 4.2924 ns |  4,181,363.40 |     40.61 |      0.00 |      0.00 |
  Improved |           50 | 222.7882 ns | 4.3712 ns |  4,488,568.45 |      0.00 |      0.00 |      0.00 |

What do you think about having this included in BenchmarkDotNet as a real feature? It's very useful for comparing 2 benchmarks, one that does allocations and one that is allocation free.

Questions:

  1. Could it go in core (rather than Diagnostics) as it only relies on GC.CollectionCount(..)?
  2. It would be nice to have the results integrated into the final result table (as above), rather than just output to the console, is this okay?

Just FYI, I have plans for a proper Memory Allocation Diagnostics, based on ETW events. But that requires more work and is for slightly different scenarios. It would give you the memory allocated per/line, something like this:

               [Setup]
               public void Setup()
               {
108.0K|            var stringToEncodeBuilder = new StringBuilder();
                   for (int i = 'a'; i < ('a' + StringLength); i++)
                   {
                       stringToEncodeBuilder.Append((char)i);
                   }
                   var stringToEncode = stringToEncodeBuilder.ToString();
                   UTF8Bytes = encoding.GetBytes(stringToEncode);

                   // From http://stackoverflow.com/a/537652/4500
                   unmanagedPointer = Marshal.AllocHGlobal(UTF8Bytes.Length);
                   Marshal.Copy(UTF8Bytes, 0, unmanagedPointer, UTF8Bytes.Length);
                   bytes = (byte *)unmanagedPointer.ToPointer();

                   // force StringBuilder to pre-allocate, so it doesn't have to grow during the benchmark runs
                   if (builder == null)
500.0M|                builder = new StringBuilder(250 * 1000 * 1000);
                   else
577.6M|                builder.Clear();
               }

Support Benchmarks running under .NET 3.5

From email conversation:

I suggest to use an approach that is similar to your approach in minibench: we can create a separate .NET 2.0 library and make reference from a generated benchmark project to this .NET 2.0 library.
In this case, we can use .NET 4.5 for main BenchmarkDotNet assembly and for unit tests (if somebody wants to run benchmark on WinXP, he can generate that benchmark on Win7+ and copy it to WinXP).

Benchmark method can't return inner classes

When benchmark method returns an inner class (tested with a return type Tuple<Foo.Bar, Foo>), the generated Program.cs built doesn't compile as it references:

private System.Tuple<Bar, Foo> value;

(complains that Bar doesn't exist)

The outer class qualifier is missing.

Make runner robust to Ctrl-C

Currently if you hit Ctrl-C in the Console whilst a benchmark is still running, the Program.exe that was launched stays around:

image

And next time you try to start the benchmark you get the following error:

image

It would be nicer if we hooked into Ctrl-C and tidied up after ourselves by (if possible) killing the Program.exe process.

Better information when we haven't got a valid measurement

From an email exchange:

Here is the situation: it is very hard to measure a very quick operation. Frequency of your computer is 2.70GHz. It means that you can run 2,700,000,000 CPU cycles per second or 0.37 nanoseconds per cycle. The latency of the Stopwatch is about 15ns and the granularity is 400ns.
If you have an operation that takes 400ns, we can measure it with good precision. If an operation takes 15–40ns, we also can measure it thanks to a large amount of iterations. However, if operation takes 1–2ns (a few CPU cycles), it is almost impossible to measure it.

You can have a look to Jit_BoolToInt.cs. In this benchmark, it is very hard to measure a single operation. Because of that, I perform six operations and use the OperationsPerInvoke attribute.

Anyway, I think that such benchmarks is a big problem, we have to warn a user that he tries to measure too small effect. For example, if AvrTime < 10ns, we can print ? instead of numbers and print a warning after that table (? means that AvrTime is too small). What do you think?

Currently the best approach seems to be:

  • print ? instead of numbers if AvtTime is < 10 ns
  • print a warning at the end explaining why there are no numbers
  • maybe point them in the direction of a sample benchmark that uses OperationsPerInvoke

Поддержка Roslyn Analysis ?

А есть ли возможность использовав анализатор выражений Roslyn автоматом обвязывать код тестируемого приложения бенчмарками?
Вообще насколько была бы полезной такая фича?

Params results should be grouped together

Currently when using Params will group the results first by benchmark function, and then by size. Given that the usage of Params is usually to benchmark the same implementation along the size axis, it would make more sense to group by size first and then by benchmark function to allow better comparisons.

Performance Counters

Another idea to queue! 💪
Add ability to gather performance counters during benchmark runs. Process specific counters would be the most useful but system wide ones like Memory\ Page Reads /sec is important to have as well.

Parallel.For in benchmark

When Parallel.For() is used in a benchmark, there is only 12% usage of 8x cores CPU by whole process, because of priority of the test thread which is set in Prepare() method: Thread.CurrentThread.Priority = ThreadPriority.Highest. Outside of a Benchmark Parallel.For() uses up to 100% of CPU on all cores.

BenchmarkDotNet generate invalid code (F#).

Not sure what wrong in my code it alway failed when try to execute ShouldExecuteBenchmark.
I see invalid code at line 7 in Db_Insert_Throughput_X86_LegacyJit_NET-HostFramework/Program.cs

Does any one can suggest me how to fix this.

Test code

module BenchmarkSpec

open BenchmarkDotNet
open Raven.Client.Embedded
open FSharp.Core.Fluent
open NUnit.Framework
open FsUnit
open BenchmarkDotNet.Tasks

type File = 
    { Name : string
      Path : string
      Extension : string
      Length : int }

[<BenchmarkTask(platform = BenchmarkPlatform.X86, jitVersion = BenchmarkJitVersion.LegacyJit)>]
//[<BenchmarkTask(platform = BenchmarkPlatform.X64, jitVersion = BenchmarkJitVersion.LegacyJit)>]
//[<BenchmarkTask(platform = BenchmarkPlatform.X64, jitVersion = BenchmarkJitVersion.RyuJit)>]
type Db() = 

    let createStore() = 
        let db = "test"
        let store = new EmbeddableDocumentStore()
        store.DataDirectory <- "Database"
        store.DefaultDatabase <- db
        store.Initialize()

    let createDoc name = 
        { Name = name
          Path = name
          Extension = name
          Length = name.Length }

    [<Benchmark>]
    member this.Insert() = 
        use store = createStore()
        use session = store.OpenSession()
        [ 1..100000].map(fun x -> x.ToString() |> createDoc).map(session.Store) |> ignore
        session.SaveChanges()

    [<Benchmark>]
    member this.Query() = 
        use store = createStore()
        use session = store.OpenSession()
        let docs = session.Query<File>().where(fun x -> x.Name.StartsWith("1"))
        docs.toList()

[<Test>]
let ShouldInsertAndQuery() = 
    let db = Db()
    db.Insert()
    db.Query().length |> should greaterThan 0

[<Test>]
let ShouldExecuteBenchmark() = 
    let reports = BenchmarkRunner().RunCompetition(Db())
    ()

Output

------ Run test started ------
NUnit VS Adapter 2.0.0.0 executing tests is started
Loading tests from Z:\Source\csharp\couchbase-lite-init\CouchbaseLite.Tests\bin\Debug\CouchbaseLite.Tests.dll
Run started: Z:\Source\csharp\couchbase-lite-init\CouchbaseLite.Tests\bin\Debug\CouchbaseLite.Tests.dll
// ***** Competition: Start   *****
// Found benchmarks:
//   Db_Insert_Throughput_X86_LegacyJit_NET-HostFramework -w=5 -t=10
//   Db_Query_Throughput_X86_LegacyJit_NET-HostFramework -w=5 -t=10
// **************************
// Benchmark: Db_Insert (Throughput_X86_LegacyJit_NET-HostFramework) [-w=5 -t=10]
// Generated project: Z:\Source\csharp\couchbase-lite-init\CouchbaseLite.Tests\bin\Debug\Db_Insert_Throughput_X86_LegacyJit_NET-HostFramework
// Build:
// Program.cs(7,7): error CS1001: Identifier expected
// OverallResult = Failure
// **************************
// Benchmark: Db_Query (Throughput_X86_LegacyJit_NET-HostFramework) [-w=5 -t=10]
// Generated project: Z:\Source\csharp\couchbase-lite-init\CouchbaseLite.Tests\bin\Debug\Db_Query_Throughput_X86_LegacyJit_NET-HostFramework
// Build:
// Program.cs(7,7): error CS1001: Identifier expected
// OverallResult = Failure
// ***** Competition: Finish  *****
```ini
BenchmarkDotNet=v0.7.8.0
OS=Microsoft Windows NT 6.2.9200.0
Processor=Intel(R) Core(TM) i5-3210M CPU @ 2.50GHz, ProcessorCount=2
HostCLR=MS.NET 4.0.30319.42000, Arch=32-bit 
NUnit VS Adapter 2.0.0.0 executing tests is finished
========== Run test finished: 1 run (0:00:05.5870087) ==========

Generated code

using System;
using System.Diagnostics;
using System.Threading;
using System.Runtime.CompilerServices;
using BenchmarkDotNet;
using BenchmarkDotNet.Tasks;
using ;
using Microsoft.FSharp.Collections;


namespace BenchmarkDotNet.Autogenerated
{
    public class Program : BenchmarkSpec.Db
    {
        public static void Main(string[] args)
        {
            try
            {
                System.Console.WriteLine(BenchmarkDotNet.EnvironmentHelper.GetFullEnvironmentInfo());
                Program instance = new Program();
                var settings = BenchmarkSettings.Parse(args);

                instance.RunBenchmark(settings);
                System.Console.WriteLine("// Benchmark finished");
            }
            catch (Exception ex)
            {
                System.Console.WriteLine(ex);
                throw;
            }
        }

        public Program()
        {
            setupAction = () => { };
            idleAction = Idle;
            targetAction = Query;
        }

        private Microsoft.FSharp.Collections.FSharpList<File> value;
        private Action setupAction;
        private Func<Microsoft.FSharp.Collections.FSharpList<File>>  targetAction, idleAction;

        public void RunBenchmark(BenchmarkSettings settings)
        {
            new BenchmarkMethodInvoker().Throughput(settings, 1, setupAction, targetAction, idleAction);
        }


        private Microsoft.FSharp.Collections.FSharpList<File> Idle()
        {
            return default(Microsoft.FSharp.Collections.FSharpList<File>);
        }
    }
}

Power management

My ultrabook's CPU frequency goes up and down accommodating to the load.
That's because it is in Balanced power mode. To keep it upmost I set it to High performance manually.

It would be convenient if BenchmarkDotNet did that for us.

This is what I use in my microbechmarking tool for LinqPad.
I found it in Vance Morrison's MeasureIt.

using System;
using System.Runtime.InteropServices;
using System.Diagnostics;

/// <summary>
/// PowerManagement allows you to access the funtionality of the Control Panel -> Power Options
/// dialog in windows.  (Currently we only use VISTA APIs). 
/// </summary>
public static unsafe class PowerManagment
{
    public static Guid HighPerformance = new Guid(0x8c5e7fda, 0xe8bf, 0x4a96, 0x9a, 0x85, 0xa6, 0xe2, 0x3a, 0x8c, 0x63, 0x5c);
    public static Guid Balenced        = new Guid(0x381b4222, 0xf694, 0x41f0, 0x96, 0x85, 0xff, 0x5b, 0xb2, 0x60, 0xdf, 0x2e);
    public static Guid PowerSaver      = new Guid(0xa1841308, 0x3541, 0x4fab, 0xbc, 0x81, 0xf7, 0x15, 0x56, 0xf2, 0x0b, 0x4a);

    public static Guid CurrentPolicy
    {
        get
        {
            Guid* retPolicy = null;
            Guid ret = Guid.Empty;
            try
            {
                int callRet = PowerGetActiveScheme(IntPtr.Zero, ref retPolicy);
                if (callRet == 0)
                {
                    ret = *retPolicy;
                    Marshal.FreeHGlobal((IntPtr)retPolicy);
                }
            }
            catch (Exception) { }
            return ret;
        }
    }
    public static bool Set(Guid newPolicy)
    {
        try
        {
            return PowerSetActiveScheme(IntPtr.Zero, ref newPolicy) == 0;
        }
        catch (Exception) { }
        return false;
    }

    #region private 
        [DllImport("powrprof.dll")]
    private static extern int PowerGetActiveScheme(IntPtr ReservedZero, ref Guid* policyGuidRet);

    [DllImport("powrprof.dll")]
    private static extern int PowerSetActiveScheme(IntPtr ReservedZero, ref Guid policyGuid);
    #endregion
}

CoreCLR Compatibility

From what I've read, there has been some work regarding CoreCLR support. I don't know the full details but I'm pretty sure that dependencies on the following assemblies will present a problem:

  • System.Management
  • Microsoft.Diagnostic.Runtime
  • Dia2Lib
  • Interop.Dia2Lib

As per the discussion in #33, I believe @mattwarren will be moving those dependencies. I'm assuming this will allow us to work towards a CoreCLR compatible implementation which can be interchanged in for the consumers of the above libraries?

Note: This does not relate to DNX Compatibility directly. Supporting DNX would make it easier to implement CoreCLR compatibility purely because the tooling is so much better for cross compilation, but probably isn't a showstopper.

Diagnostic improvements

@mattwarren, I want the following list of features:

  • 1. I want be able to add a diagnostic class with the AddDiagnoster method in manual mode (automatic loading should work in audo mode).
  • 2. I want a special diagnostic BenchmarkIterationMode for diagnostic. It should be run before the pre-warmup stage.
  • 3. Now I have troubles with diagnostic of x86 benchmark from the x64 host application. Can we fix it?
  • 4. It would be cool to split the current diagnostic class to source diagnoster (IL and ASM) and runtime diagnoster (GC, Segments, and so on).
  • 5. We should cover the diagnostics by unit tests.

What do you think?

NUnit integration

I personally very like BenchmarkDotNet. But when you compare it with other micro-benchmarking tools for .NET you can note that it misses one quite useful feature - declarative definitions of benchmarks, like in pUnit.

To address this issue I wrote a small class CompetitionBase which now allows me to define benchmark competitions as follows:

public class FirstCompetition: CompetitionBase
{
    [Benchmark]
    public Action MethodA()
    {
        // smth
    }

    [Benchmark]
    public Action MethodB()
    {
        // smth
    }
}

This benchmark competition will be recognized by ReSharper as one NUnit test and can be executed directly from VisualStudio with one keystroke.

So my question is, whether you are interested to merge such "NUnit integration" feature to your library? If yes, I can create an appropriate pull-request with this code.

One problem that I can foresee for my implementation is that it will add an additional dependency to NUnit + it cannot be ported to MSTest due to its internal bug/limitations.

Missed msdia120.dll

In BenchmarkDotNet.IntegrationTests.csproj, we have the following lines:

  <PropertyGroup>
    <PostBuildEvent>xcopy /F /Y $(ProjectDir)..\CLRMD\x86\msdia120.dll $(TargetDir)</PostBuildEvent>
  </PropertyGroup>

But we don't have the x86\msdia120.dll file in CLRMD, building fails.

Allow [Params] to be specified on multiple fields/properties

i.e make this work:

[Params(1, 2, 8)]
public int CounterX = 0;

[Params(1, 2, 8)]
public int CounterY = 0;

[Setup]
public void SetupData()
{
    buffer = new byte[counterX][counterY];
}

And then in the results have something like this, with both columns having the correct field/property name (not "IntParam" like it is now):

          Method | Platform | CounterX | CounterY |     AvrTime |
---------------- |--------- |--------- |--------- |------------ |
         MethodA |      X64 |        1 |        1 |  59.5410 ns |
         MethodB |      X64 |        1 |        2 |  99.4154 ns |
         MethodC |      X64 |        1 |        8 |  47.1098 ns |
         MethodA |      X64 |        2 |        1 |  69.5410 ns |
         MethodB |      X64 |        2 |        2 |  89.4154 ns |
         MethodC |      X64 |        2 |        8 |  77.1098 ns |
         MethodA |      X64 |        8 |        1 |  49.5410 ns |
         MethodB |      X64 |        8 |        2 |  89.4154 ns |
         MethodC |      X64 |        8 |        8 |  57.1098 ns |

Integration Tests

@AndreyAkinshin as part of the work I'm doing on #7 and #8, I've been thinking about how best to port of the Integration Tests that I did in my own library (before we collaborated).

You can see an example here, but the basic idea is that they do the following:

  • Run as a regular unit test, using Xunit (for instance)
  • But test out the full end-to-end process, i.e. project creation, MSBuild code-gen, etc
  • Exercise a benchmark that has an observable side-effect
  • Assert that the feature was really exercised

What do you think, is it worth me putting something in place so that we can have some integration tests against the whole benchmark process?

If so do you have any bright ideas about who to observe the side-effects? In my previous tests I was running the Benchmark in-process, so I could just use static variables and then inspect them afterwards. That doesn't work if the benchmark runs out-of-process.

Solution cannot be built

I downloaded sources of BenchmarkDotNet and tried to compile the solution.
VS2013 shows next error (for BenchmarkDotNet project)

1>------ Build started: Project: BenchmarkDotNet, Configuration: Debug Any CPU ------
1>CSC : error CS1617: Invalid option '6' for /langversion; must be ISO-1, ISO-2, 3, 4, 5 or Default
========== Build: 0 succeeded, 1 failed, 0 up-to-date, 0 skipped ==========

Rebuild all shows next output:

1>------ Rebuild All started: Project: BenchmarkDotNet, Configuration: Debug Any CPU ------
1>CSC : error CS1617: Invalid option '6' for /langversion; must be ISO-1, ISO-2, 3, 4, 5 or Default
2>------ Rebuild All started: Project: BenchmarkDotNet.Samples, Configuration: Debug Any CPU ------
3>------ Rebuild All started: Project: BenchmarkDotNet.IntegrationTests, Configuration: Debug Any CPU ------
4>------ Rebuild All started: Project: BenchmarkDotNet.Visualizer, Configuration: Debug Any CPU ------
5>------ Rebuild All started: Project: BenchmarkDotNet.Tests, Configuration: Debug Any CPU ------
2>CSC : error CS0006: Metadata file 'D:\My\MyProjects\@Benchmark\BenchmarkDotNet-master\BenchmarkDotNet\bin\Debug\BenchmarkDotNet.dll' could not be found
3>  Restoring NuGet packages...
3>  To prevent NuGet from downloading packages during build, open the Visual Studio Options dialog, click on the Package Manager node and uncheck 'Allow NuGet to download missing packages'.
3>  All packages listed in packages.config are already installed.
3>CSC : error CS0006: Metadata file 'D:\My\MyProjects\@Benchmark\BenchmarkDotNet-master\BenchmarkDotNet\bin\Debug\BenchmarkDotNet.dll' could not be found
5>  Restoring NuGet packages...
5>  To prevent NuGet from downloading packages during build, open the Visual Studio Options dialog, click on the Package Manager node and uncheck 'Allow NuGet to download missing packages'.
5>  All packages listed in packages.config are already installed.
5>CSC : error CS0006: Metadata file 'D:\My\MyProjects\@Benchmark\BenchmarkDotNet-master\BenchmarkDotNet\bin\Debug\BenchmarkDotNet.dll' could not be found
4>  Restoring NuGet packages...
4>  To prevent NuGet from downloading packages during build, open the Visual Studio Options dialog, click on the Package Manager node and uncheck 'Allow NuGet to download missing packages'.
4>  All packages listed in packages.config are already installed.
4>CSC : error CS0006: Metadata file 'D:\My\MyProjects\@Benchmark\BenchmarkDotNet-master\BenchmarkDotNet\bin\Debug\BenchmarkDotNet.dll' could not be found
========== Rebuild All: 0 succeeded, 5 failed, 0 skipped ==========

Reporting: better number display

Probably minor.

This threw me off a little:

 Method |  AvrTime |    StdDev |        op/s |
------- |--------- |---------- |------------ |
 Sqrt13 | 63.43 ns |  0.768 ns | 15764394.26 |
 Sqrt14 | 68.17 ns | 0.0794 ns |  14669862.3 |

and then I realised the numbers are not aligned.

To make it easier to inspect the results, we can do a couple of things:

  1. Ops/sec: thousand separators and fixed decimals (say 2).

    Effect of this:

     Method |  AvrTime |    StdDev |           op/s |
    ------- |--------- |---------- |--------------- |
     Sqrt13 | 63.43 ns |  0.768 ns |  15,764,394.26 |
     Sqrt14 | 68.17 ns | 0.0794 ns |  14,669,862.30 |
    
  2. AvrTime and StdDev is trickier, because I can see you use variable decimal precision depending on how small the value is. Nevertheless, several options here too:

    • Same precision. Just use the same precision for everything (say 3 or 4). The simplest but may not work if the numbers are really small.

      So the effect of this would be:

      Method |  AvrTime   |    StdDev |           op/s |
      ------- |----------- |---------- |--------------- |
      Sqrt13 | 63.4300 ns | 2.1000 ns |  15,764,394.26 |
      Sqrt13 | 63.4300 ns | 0.7680 ns |  15,764,394.26 |
      Sqrt14 | 68.1700 ns | 0.0794 ns |  14,669,862.30 |
      
      
    • Decimal point alignment. More tricky but will work in all cases. The result may look unusual and may throw off people :)

      This may look like this (with minor variations):

                0.753  ns
                0.0335 ns
            23535.1     s
        614119772.34     
      614,119,772.34     
         16496828.35     
      16,496,828.35     
              0.0      
      

I have a pull request for ops/sec format (hopefully not a controversial one), and a bit of code to do decimal point alignment which I can plug in.

Let me know what you think.

Inject helper classes into the [Benchmark] method

Several times when writing a benchmark I've needed to have access to a different value/counter each time it's executed. So that I can ensure I'm accessing different array locations (to prevent caching) or as an attempt to defeat constant folding.

For instance rather than writing:

[Benchmark]        
public long BitwiseAndConstantFolding()
{
    return 5 & 1;
}

I do:

private static long counter;

[Benchmark]        
public long BitwiseAnd()
{
    counter++;
    return counter & 1;
}

I wonder if instead of requiring the Benchmark author to do this every time, we could provide a way of making it easier, for instance:

[Benchmark]        
public long BitwiseAnd(BenchmarkInfo info)
{
    return info.Counter & 1;
}

So the idea is that we inject the contents of the BenchmarkInfo class/struct (it can have a different name if you want). In addition we can just use the existing invocationCount counter that we have in the generated scaffolding code.

BenchmarkInfo (or whatever it's called), could initially look something like this:

public class BenchmarkInfo
{
    public long Counter { get; }
    public long BatchSize { get; }
}

What do you think?

BTW I can't claim I made this idea up, I originally saw it in JMH, where it's called InfraParams and lets you access a class called IterationParams (JavaDoc).

Discussion: Reporting requirements

(Don't know if this is the best place/way to talk about it but lets do this for a start. Perhaps wiki or something else might be better?)

Let's have a place to collect and discuss our requirements for reporting. This will drive whatever dev work we need to do to get these done. Feel free to edit / comment etc.

One thing is certain: there are different use case which may require different kind of reporting.

For now, briefly:


1. Ad-hoc runs for visual inspection of results

(current use case)

  • Run the benchmarks in ad-hoc manner;
  • See the results on screen;
  • Possibly copy/paste into some blog in Markdown format;
  • The main goal here is to compare results between each other on-screen.

Key here is:

  • Have results displayed so they are easily viewed on screen;
  • Numbers should be easily comparable;
  • Want to see what's faster/slower and by how much;
  • Compact Markdown-friendly form.

(this is catered by the current reporting, with some enhancements we could do there)


2. Spreadsheet analytics

  • Run lots of different benchmarks, possibly on multiple systems;
  • Collate all results;
  • Load into Excel whatever and analyse and chart there.

Key here is:

  • Output format friendly for Excel / other analytics tools, means probably CVS;
  • Comparison between results of the same benchmark on the same system;
  • Comparison between results from runs on different systems.

3. Fully automated runs, dashboards etc

This extends on "Excel" case and adds automation and scale.

  • Run many benchmarks on many systems;
  • Do this on regular basis;
  • The benchmarks themselves may be some code which changes over time;
  • The execution environments may change over time (patches, infrastructure changes etc);
  • The benchmarks are scheduled to run on regular basis in automated mode;
  • Results are collected and published to reporting/analytics systems (e.g. Splunk, PowerBI);
  • Dashboards are created to see trends over time, alerts for degradations etc.

Keys are:

  • Automation-friendly;
  • Collect and keep the results;
  • Timestamps in results are a must;
  • Friendly for ingestion to target analytics systems;
  • Friendly for dashboard-building;
  • Friendly for alerting;

These are probably the main ones for a start I can think of now.

Friendliness to LinqPad

Would be nice to have ability to run benchmarks in LinqPad and get nicely formattet results in LinqPad's Results output.

DNX Compatibility

Having accidentally hijacked #33, I'll move relevant information to this issue so that the 3 separate issues currently being discussed in aforementioned issue can become less confused.

DNX is currently in RC1, and according to the most recent ASP.Net Standup will actually diverge from the planned roadmap to a Core CLI model. (See video for more details).

DNX is in layman's a host that can run on many platforms with many runtimes. The replacement Core CLI work will likely be very similar, at least from the point of view of BenchmarkDotNet.

Currently, if trying to use BenchmarkDotNet within a dnx hosted project, you will receive the following error:
benchmarkdotnet

This is caused by this line of code which tries to retrieve the entry assembly's location. Assembly locations do not make sense in the context of DNX and I think will still not make sense when it's successor arrives.

Therefore, we need to examine the overall process that relies upon these assembly locations to try and find a mechanism that will allow for dnx projects to work.

Note: This is not the same as CoreCLR Compatibility which I'll raise as a separate issue.

Cleanup is not done

In the class BenchmarkCompetitionTask a call to Initialize is made, but a call to Clean is missing.

Plugins for the most common Continuous Integration Systems

I would like to start a discussion, it is not a complete vision yet.

Problem: in terms of Continuous Integration the software performance is usually ignored, or in best case it is not measured properly. Most developers do the profiling and optimizations when the clients start to complain. The performance is not considered and treated as a feature.

As a user I would like to know when code changes are decreasing performance.

The basic idea is to have the results of the benchmarks compared with previous results. If the difference is big enough, then the CI should go red as it would with a broken test.

Seems, not supported "sub-folder"

My binaries folder has next structure:

folder        Compilation
folder       Compilation\Common\
tesproject TestProject.dll

I added test in TestProject

    [TestFixture]
    public class BenchmarkTests
    {
        public BenchmarkTests()
        {
        }
        [Benchmark]
        public void ByDoubleReader()
        {
            <code>
        }

        [Test]
        public void BenchMark()
        {
            new BenchmarkRunner().RunCompetition(new BenchmarkTests());
        }
    }

and found next problem:
folder \Compilation\BenchmarkTests_ByDoubleReader_Throughput_HostPlatform_HostJit_NET-HostFramework
doesn't contain subfolder Common and "benchmark" cannot be loaded

Add support for benchmarking methods of generic classes

At the moment BenchmarkRunner throws InvalidOperationException if the class that contains the benchmarked methods is generic. Unfortunately, it cripples code reuse if you want to create separate benchmarks for some generic method by using it with different type arguments. Here's an example of what I'd like to achieve:

public abstract class AbstractBenchmark<T>
{
    private readonly T _value;
    private readonly Serializer1<T> _serializer1 = new Serializer1<T>();
    private readonly Serializer2<T> _serializer1 = new Serializer2<T>();

    protected AbstractBenchmark()
    {
        _value = CreateValue();
    }

    protected abstract T CreateValue();

    [Benchmark]
    public void SerializationLibrary1()
    {
        string text = _serializer1.Serialize( _value );
    }

    [Benchmark]
    public void SerializationLibrary2()
    {
        string text = _serializer2.Serialize( _value );
    }
}

public class FlatClassBenchmark : AbstractBenchmark<FlatClass>
{
    protected override FlatClass CreateValue() => new FlatClass() { Number = 42, Text = "64", TimeStamp = DateTime.UtcNow };
}

public class DoubleArrayBenchmark : AbstractBenchmark<double[]>
{
    protected override double[] CreateValue() => Enumerable.Repeat( 42.0, 100 * 1000 ).ToArray();
}

// etc.

Unless there's a compelling technical reason to prohibit similar scenarios, I believe lifting this ban on benchmarking generic classes would be quite convenient.

Make Benchmark, Setup and Params attribute sealed in explicit way

In essence, the following two signatures are in contradiction with one another:

GetCustomAttributes: https://github.com/PerfDotNet/BenchmarkDotNet/blob/a2338ce6d6b971e0e7599ffc178fb90f2db1dacd/BenchmarkDotNet/Tasks/BenchmarkTask.cs#L25 (and line 27)

BenchmarkTaskAttribute:
https://github.com/PerfDotNet/BenchmarkDotNet/blob/a2338ce6d6b971e0e7599ffc178fb90f2db1dacd/BenchmarkDotNet/Tasks/BenchmarkTaskAttribute.cs#L6

The attribute is not sealed (can be inherited) but discovery will not find inherited attributes. We should pick one way or t'other.

@metallium in gitter has been asking for a simple way to configure shorter/low load benchmarks, which @mattwarren suggest could be done as follows:

[BenchmarkTask(mode: BenchmarkMode.SingleRun, processCount: 1, warmupIterationCount: 1, targetIterationCount: 1)] 
\\i.e. "SingleRun"`

This could be made simpler still by inheriting from BenchmarkTask and predefining the above settings in the base .ctor.

Therefore, I recommend we go for keeping the attribute unsealed, and changing the GetCustomAttribute calls, as opposed to the other way around.

Support for initialization of parameter size.

Currently this pattern is not supported.

[Params(8, 16, 32, 64, 128, 256, 512, 1024, 2048, 4096, 4096 * 10, 4096 * 100, 4096 * 1000)]
public int Size = 1;

private byte[] src;
private byte[] dest;

public MemoryPerf(int size)
{
    src = new byte[size];
    dest = new byte[size];
    new Random(42).NextBytes(src);

    Console.WriteLine(size);
}

Error when executing: The system cannot find the file specified

Check that the first time called the error is "The system cannot find the file specified" and the directory is created, but when run the second time the error is different and then the directory is deleted.

Available competitions:
#0 Program

You should select the target benchmark. Please, print a number of a becnhmark (e.g. #0) or a benchmark caption:
#0

Target competition: Program
// ***** Competition: Start *****
// Found benchmarks:
// Program_Alternative_Throughput_CurrentPlatform_CurrentJit_NET-Current -w=5 -t=10
// Program_Current_Throughput_CurrentPlatform_CurrentJit_NET-Current -w=5 -t=10

// **************************
// Benchmark: Program_Alternative (Throughput_CurrentPlatform_CurrentJit_NET-Current) [-w=5 -t=10]
// Generated project: D:\Repositories\ravendbgit\Raven.Tryouts\bin\Release\Program_Alternative_Throughput_CurrentPlatform_CurrentJit_NET-Current

// Build:

Unhandled Exception: System.ComponentModel.Win32Exception: The system cannot find the file specified
at System.Diagnostics.Process.StartWithCreateProcess(ProcessStartInfo startInfo)
at System.Diagnostics.Process.Start(ProcessStartInfo startInfo)
at BenchmarkDotNet.BenchmarkExecutor.Exec(String exeName, String args)
at BenchmarkDotNet.BenchmarkProjectGenerator.CompileCode(String directoryPath)
at BenchmarkDotNet.BenchmarkRunner.Run(Benchmark benchmark, IList1 importantPropertyNames) at BenchmarkDotNet.BenchmarkRunner.RunCompetition(List1 benchmarks)
at BenchmarkDotNet.BenchmarkCompetitionSwitch.RunCompetitions(String[] args)
at Raven.Tryouts.Program.Main(String[] args) in d:\Repositories\ravendb-git\Raven.Tryouts\Program.cs:line 229
PS D:\Repositories\ravendb-git\Raven.Tryouts\bin\Release> .\Raven.Tryouts.exe
Available competitions:
#0 Program

You should select the target benchmark. Please, print a number of a becnhmark (e.g. #0) or a benchmark caption:
#0

Target competition: Program
// ***** Competition: Start *****
// Found benchmarks:
// Program_Alternative_Throughput_CurrentPlatform_CurrentJit_NET-Current -w=5 -t=10
// Program_Current_Throughput_CurrentPlatform_CurrentJit_NET-Current -w=5 -t=10

// **************************
// Benchmark: Program_Alternative (Throughput_CurrentPlatform_CurrentJit_NET-Current) [-w=5 -t=10]

Unhandled Exception: System.IO.DirectoryNotFoundException: Could not find a part of the path 'D:\Repositories\ravendb-gi
t\Raven.Tryouts\bin\Release\Program_Alternative_Throughput_CurrentPlatform_CurrentJit_NET-Current\Program.cs'.
at System.IO.__Error.WinIOError(Int32 errorCode, String maybeFullPath)
at System.IO.FileStream.Init(String path, FileMode mode, FileAccess access, Int32 rights, Boolean useRights, FileShar
e share, Int32 bufferSize, FileOptions options, SECURITY_ATTRIBUTES secAttrs, String msgPath, Boolean bFromProxy, Boolea
n useLongPath, Boolean checkHost)
at System.IO.FileStream..ctor(String path, FileMode mode, FileAccess access, FileShare share, Int32 bufferSize, FileO
ptions options, String msgPath, Boolean bFromProxy, Boolean useLongPath, Boolean checkHost)
at System.IO.StreamWriter..ctor(String path, Boolean append, Encoding encoding, Int32 bufferSize, Boolean checkHost)
at System.IO.File.InternalWriteAllText(String path, String contents, Encoding encoding, Boolean checkHost)
at BenchmarkDotNet.BenchmarkProjectGenerator.GenerateProgramFile(String projectDir, Benchmark benchmark)
at BenchmarkDotNet.BenchmarkProjectGenerator.GenerateProject(Benchmark benchmark)
at BenchmarkDotNet.BenchmarkRunner.Run(Benchmark benchmark, IList1 importantPropertyNames) at BenchmarkDotNet.BenchmarkRunner.RunCompetition(List1 benchmarks)
at BenchmarkDotNet.BenchmarkCompetitionSwitch.RunCompetitions(String[] args)
at Raven.Tryouts.Program.Main(String[] args) in d:\Repositories\ravendb-git\Raven.Tryouts\Program.cs:line 229
PS D:\Repositories\ravendb-git\Raven.Tryouts\bin\Release>

Recommend Projects

  • React photo React

    A declarative, efficient, and flexible JavaScript library for building user interfaces.

  • Vue.js photo Vue.js

    🖖 Vue.js is a progressive, incrementally-adoptable JavaScript framework for building UI on the web.

  • Typescript photo Typescript

    TypeScript is a superset of JavaScript that compiles to clean JavaScript output.

  • TensorFlow photo TensorFlow

    An Open Source Machine Learning Framework for Everyone

  • Django photo Django

    The Web framework for perfectionists with deadlines.

  • D3 photo D3

    Bring data to life with SVG, Canvas and HTML. 📊📈🎉

Recommend Topics

  • javascript

    JavaScript (JS) is a lightweight interpreted programming language with first-class functions.

  • web

    Some thing interesting about web. New door for the world.

  • server

    A server is a program made to process requests and deliver data to clients.

  • Machine learning

    Machine learning is a way of modeling and interpreting data that allows a piece of software to respond intelligently.

  • Game

    Some thing interesting about game, make everyone happy.

Recommend Org

  • Facebook photo Facebook

    We are working to build community through open source technology. NB: members must have two-factor auth.

  • Microsoft photo Microsoft

    Open source projects and samples from Microsoft.

  • Google photo Google

    Google ❤️ Open Source for everyone.

  • D3 photo D3

    Data-Driven Documents codes.