
The goal of this repository is to provide a benchmarking pipeline for anomaly detection on time series data for multiple state-of-the-art deep learning methods.
| Name | Paper |
|---|---|
| LSTM-AD | Long short term memory networks for anomaly detection in time series, ESANN 2015 |
| LSTM-ED | LSTM-based encoder-decoder for multi-sensor anomaly detection, ICML 2016 |
| Autoencoder | Outlier detection using replicator neural networks, DaWaK 2002 |
| Donut | Unsupervised Anomaly Detection via Variational Auto-Encoder for Seasonal KPIs in Web Applications, WWW 2018 |
| REBM | Deep structured energy based models for anomaly detection, ICML 2016 |
| DAGMM | Deep autoencoding gaussian mixture model for unsupervised anomaly detection, ICLR 2018 |
| LSTM-DAGMM | Extension of DAGMM using an LSTM-Autoencoder instead of a Neural Network Autoencoder |
git clone git://github.com/KDD-OpenSource/DeepADoTS.git
virtualenv venv -p /usr/bin/python3
source venv/bin/activate
pip install -r requirements.txt
python3 main.pyWe follow the scikit-learn API by offering the interface methods fit(X) and predict(X). The former estimates the data distribution in an unsupervised way while the latter returns an anomaly score for each instance - the higher, the more certain is the model that the instance is an anomaly. To compare the performance of methods, we use the ROC AUC value.
We use MNIST to demonstrate the usage of a model since it is already available in TensorFlow and does not require downloading external data (even though the data has no temporal aspect).
import pandas as pd
import tensorflow as tf
from sklearn.metrics import roc_auc_score

from src.algorithms import AutoEncoder
from src.datasets import Dataset


class MNIST(Dataset):
    """0 is the outlier class. The training set is free of outliers."""

    def __init__(self, seed):
        super().__init__(name="MNIST", file_name='')  # We do not need to load data from a file
        self.seed = seed

    def load(self):
        # 0 is the outlier, all other digits are normal
        OUTLIER_CLASS = 0
        mnist = tf.keras.datasets.mnist
        (x_train, y_train), (x_test, y_test) = mnist.load_data()
        # Label outliers with 1 and normal digits with 0
        y_train, y_test = (y_train == OUTLIER_CLASS), (y_test == OUTLIER_CLASS)
        x_train = x_train[~y_train]  # Remove outliers from the training set
        x_train, x_test = x_train / 255, x_test / 255
        x_train, x_test = x_train.reshape(-1, 784), x_test.reshape(-1, 784)
        self._data = tuple(pd.DataFrame(data=data) for data in [x_train, y_train, x_test, y_test])


x_train, y_train, x_test, y_test = MNIST(seed=0).data()
# Use fewer instances for demonstration purposes
x_train, y_train = x_train[:1000], y_train[:1000]
x_test, y_test = x_test[:100], y_test[:100]

model = AutoEncoder(sequence_length=1, num_epochs=40, hidden_size=10, lr=1e-4)
model.fit(x_train)

error = model.predict(x_test)
print(roc_auc_score(y_test, error))  # e.g. 0.8614
We can visualize the samples with respective error values as follows
import numpy as np
import matplotlib.pyplot as plt
from matplotlib import offsetbox

"""Borrowed from https://github.com/scikit-learn/scikit-learn/blob/master/examples/manifold/plot_lle_digits.py#L44"""
error = (error - error.min()) / (error.max() - error.min())  # Normalize error
x_test = x_test.values
y_random = np.random.rand(len(x_test)) * 2 - 1
plt.figure(figsize=(20, 10))
ax = plt.subplot(111)
if hasattr(offsetbox, 'AnnotationBbox'):
    shown_images = np.array([[1., 1.]])
    for i in range(len(x_test)):
        X_instance = [error[i], y_random[i]]
        dist = np.sum((X_instance - shown_images) ** 2, 1)
        if np.min(dist) < 4e-5:
            # don't show points that are too close
            continue
        shown_images = np.r_[shown_images, [X_instance]]
        imagebox = offsetbox.AnnotationBbox(offsetbox.OffsetImage(x_test[i].reshape(28, 28), cmap=plt.cm.gray_r), X_instance)
        ax.add_artist(imagebox)
plt.xlim((0, 1.1))
plt.ylim((-1.2, 1.2))
plt.xlabel("Anomaly Score")
plt.title("Predicted Anomaly Score for the Test Set")
plt.show()
Which creates a plot like this
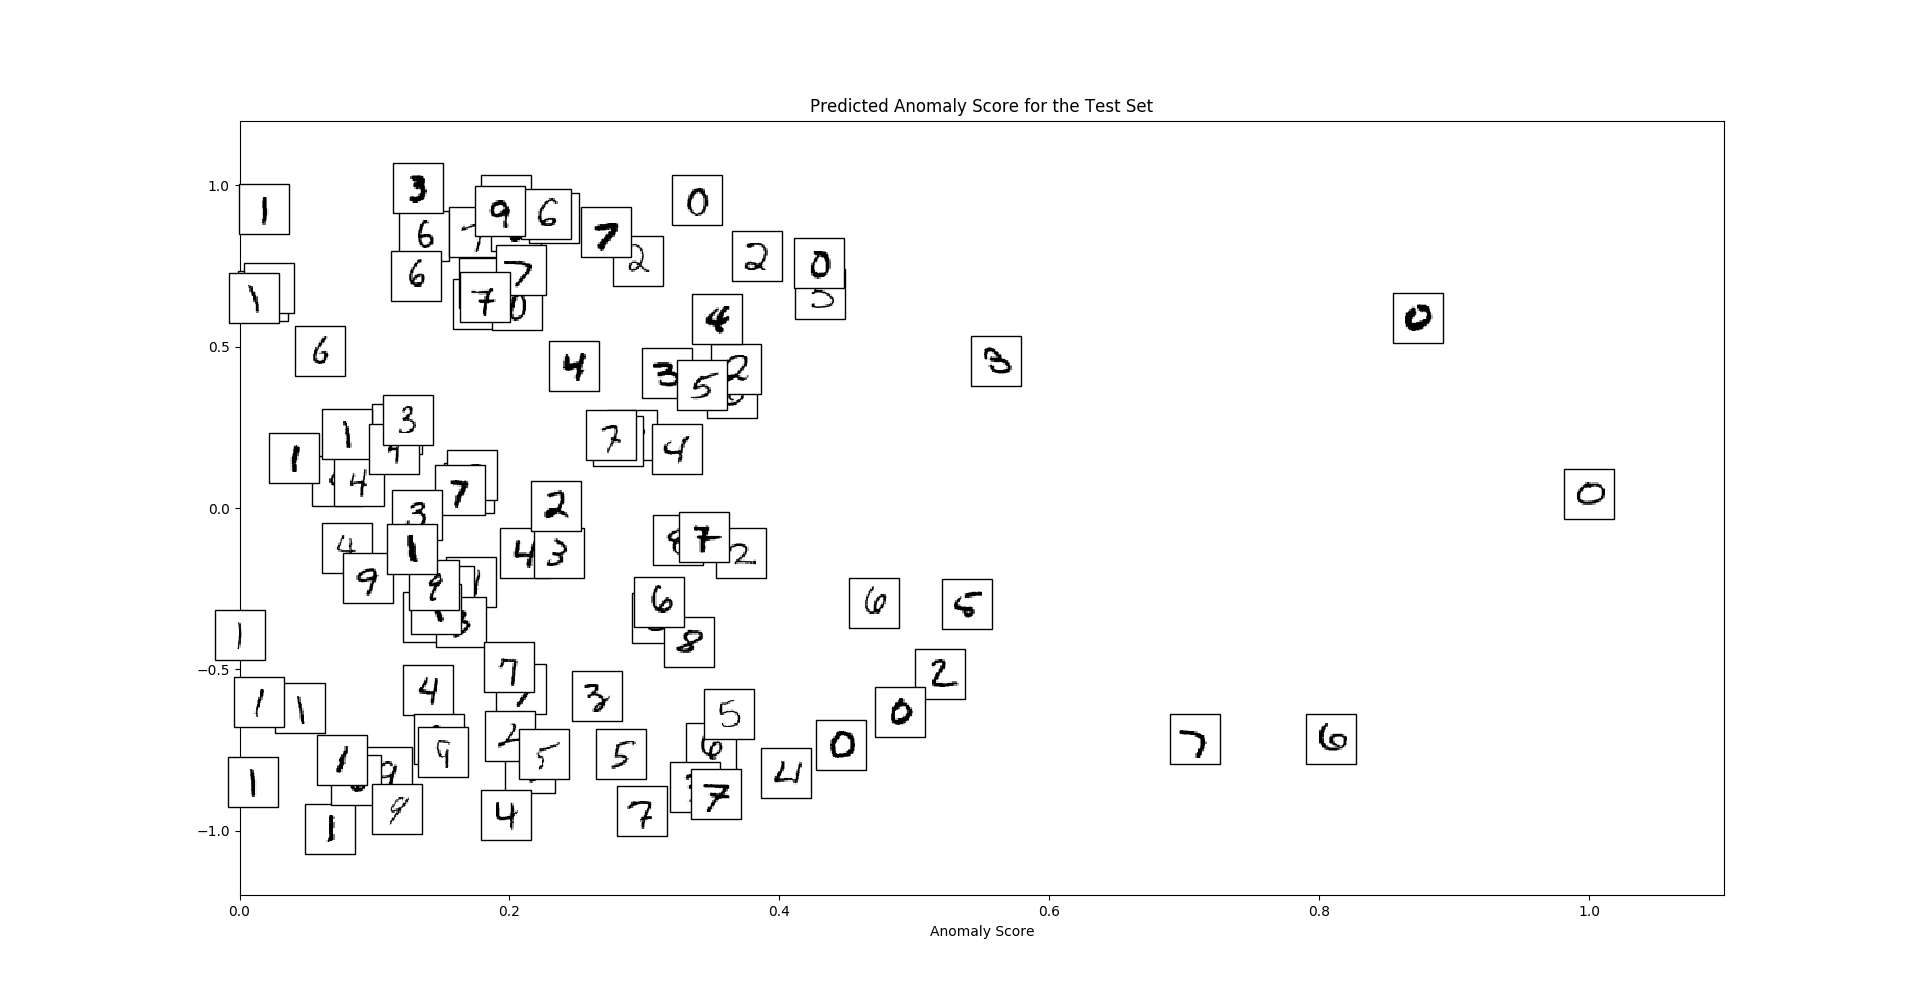 We can see that global outliers (zeros) and local outliers (strangely written digits) receive high anomaly scores.
docker build -t deep-adots .docker run -ti deep-adots /bin/bash -c "python3.6 /repo/main.py"
Team:
Supervisors:
Base implementation for DAGMM
Base implementation for Donut
Base implementation for Recurrent EBM
Downloader for real-world datasets


