datopian / bad-data Goto Github PK
View Code? Open in Web Editor NEWExamples of bad data, especially from government.
Home Page: https://datahub.io/@rufuspollock/bad-data
Examples of bad data, especially from government.
Home Page: https://datahub.io/@rufuspollock/bad-data


title: Russian foreign trade statistics
dataformat: DBF (DBase
datapublisher: Federal Customs Service
dataurl: http://stat.customs.ru/apex/f?p=201:3:822234424961570::NO:::
author: Ivan Begtin
authorurl: http://infoculture.ru
What's bad?
Screenshot
Screenshot with some comments:
What's bad?
http://webarchive.nationalarchives.gov.uk/+/http://www.alderhey.com/Library/Images/Finance/09201.jpg
This hospital provided its spend data only as screenshots of spreadsheets monthly from April to September 2010. Optical Character Recognition or a LOT of typing would be required to extract the information. The dates are not even visible.
Efforts to parse and aggregate the data, such as https://openspending.org/ukgov-25k-spending are impossible. Not at all transparent.
The hospital made a further step to make this inaccessible - they deleted it from their website. We can only access it now because the National Archive provides a cached copy.
UK Government has made a huge efforts to be transparent, and the publication of spend transaction data across central government and NHS trusts was required by David Cameron. The Treasury published guidelines and examples of how the data was to be presented in CSV, which column names etc. There's been reasonable traction, although there are always some that slip through the gaps, like this one.
@csarven has raised some issues with this data.
For sure the URL slug for this page is misleading incorrect, since it says “mex-list-towns-pop-over-5000” when the data is actually for populations under 5000.
Apart from that, could you clarify what else is wrong, @csarven? I’ve reviewed your points but wasn’t clear what else you felt was wrong.
Nature tends to publish fabulous cutting-edge scientific research data of different types bundled all-together in a PDF called "supplementary information"
e.g. http://www.nature.com/nature/journal/vaop/ncurrent/extref/nature12764-s1.pdf
In this PDF they have bundled/bungled together:
...some say this is one of the world's 'best' research journals.
SCREENCROP of the table
I published this on my blog about 6 years ago. I think this was from a ***** ******** ** Chemistry journal but hold fire till I check.
This was, of course , digital data in the spectrometer (perhaps 2^16 points)
Great dataset. But why do we need to move metadata into a spreadsheet. First two sheets are pure metadata.
Version metadata is in a random human readable location on bottom right.


Lots of nice spacing (plus navigation back to main sheet! this is a full excel app ...)

Source data
eight-centuries-of-global-real-interest-rates-r-g-and-the-suprasecular-decline-1311-2018-data.xlsx
title: Russian weather by radiometric analysis
dataformat: IMG
datapublisher: State enterprise "Central Aerological Observatory"
dataurl: http://www.nowcast.ru/ , http://www.nowcast.ru/data/uvk.html
author: Ivan Begtin
authorurl: http://infoculture.ru
What's bad?
Screenshot
Science also publishes fabulous cutting-edge scientific research data of different types bundled all-together in a PDF called "supplementary materials"
e.g. http://www.sciencemag.org/content/suppl/2013/10/30/342.6158.592.DC1/1243283.McLellan.SM.pdf
In this PDF (!) they have bundled/bungled together:
One of the tables (S1) is split over THREE pages (with page breaks in between) and if you try and copy and paste out the whole table in one go, it'll be contaminated by the page numbers at each page break AND the footnotes on each section of the (same) table.
It is fairly typical of the many supp. materials files they publish each and every week.
SCREENSHOT of page break between table
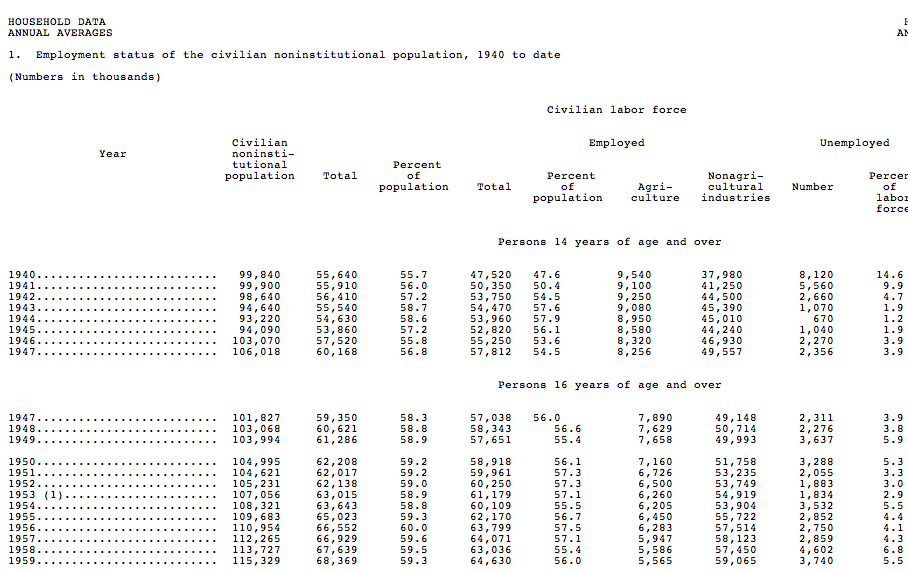
Wonderful example of an "ASCII Spreadsheet" including "merge cells" (Employed heading ...)
@rgrp et al.
Take an academic publishing organisation at random, which publishes the papers in PDF. Start here: http://en.wikipedia.org/wiki/List_of_academic_journals (get one of them e.g., Springer to request academic papers in XHTML+RDFa from here on end)
If OKFN is 100% behind that, I'll support OKFN's Bad Data initiative by 120%.
See also: https://github.com/csarven/linked-research e.g., Print view http://csarven.ca/linked-statisical-data-analysis in Firefox, and dereference the URI for RDF. Some write-up: http://csarven.ca/linked-research
Interested? Got resources?
@pauldeschacht had some great examples from his talk at csv,conf.
Would you be up for adding some, @pauldeschacht?
Here is an example of lying with data my students uncovered. The source of the data is the American Chemistry Council, as repeated by the EPA https://epa.gov/facts-and-figures-about-materials-waste-and-recycling/plastics-material-specific-data.
Is plastic use rising or plateauing? And is the waste being recycled or given a second useful life? Almost no plastic is composted, but this graph from the EPA and ACC seems to indicate plastic use is plateauing. A point the chemical industry likes to make. But look closely at the time scale:

See, they switch from decades to years! Why? Because it stretches the graph in time, giving the impression of a slow down. But if you graph linearly, ....

title: Benefits for Russian taxpayers on federal, regional and municipal levels
dataformat: XML (Microsoft Word XML)
datapublisher: Federal Tax Service
dataurl: http://nalog.ru/ru/opendata/p9/
author: Ivan Begtin
authorurl: http://infoculture.ru
What's bad?
Screenshot
title: Cairo Transport Data
dataformat: PDF
datapublisher: Governorate of Cairo
dataurl: http://www.cairo.gov.eg/HaykalTanzemy/body/Shared%20Documents/%D9%85%D8%B3%D8%A7%D8%B1%D8%A7%D8%AA%20%D8%AE%D8%B7%D9%88%D8%AA%20%D8%A7%D9%84%D8%A7%D8%AA%D9%88%D8%A8%D9%8A%D8%B3%20%D8%AF%D8%A7%D8%AE%D9%84%20%D9%85%D8%AD%D8%A7%D9%81%D8%B8%D8%A9%20%D8%A7%D9%84%D9%82%D8%A7%D9%87%D8%B1%D8%A9%20.pdf
author: Mohammad Tayseer
authorurl: http://mtayseer.net
What's bad?
title: List of regional divisions of ministry of interior
dataformat: XML (Microsoft Word XML)
datapublisher: Ministry of Interior of Russian Federation
dataurl: http://mvd.ru/opendata/od1
author: Ivan Begtin
authorurl: http://infoculture.ru, http://ru.okfn.org
What's bad?
Screenshot
A declarative, efficient, and flexible JavaScript library for building user interfaces.
🖖 Vue.js is a progressive, incrementally-adoptable JavaScript framework for building UI on the web.
TypeScript is a superset of JavaScript that compiles to clean JavaScript output.
An Open Source Machine Learning Framework for Everyone
The Web framework for perfectionists with deadlines.
A PHP framework for web artisans
Bring data to life with SVG, Canvas and HTML. 📊📈🎉
JavaScript (JS) is a lightweight interpreted programming language with first-class functions.
Some thing interesting about web. New door for the world.
A server is a program made to process requests and deliver data to clients.
Machine learning is a way of modeling and interpreting data that allows a piece of software to respond intelligently.
Some thing interesting about visualization, use data art
Some thing interesting about game, make everyone happy.
We are working to build community through open source technology. NB: members must have two-factor auth.
Open source projects and samples from Microsoft.
Google ❤️ Open Source for everyone.
Alibaba Open Source for everyone
Data-Driven Documents codes.
China tencent open source team.


