Code Monkey home page Code Monkey logo

chartjs-scale-hierarchical's People

Contributors

dg-datavisyn avatar dvvanessastoiber avatar puehringer avatar rumersdorfer avatar sepppenner avatar sgratzl avatar svenbw avatar

Stargazers

 avatar  avatar  avatar  avatar  avatar  avatar  avatar  avatar  avatar

Watchers

 avatar  avatar

chartjs-scale-hierarchical's Issues

Error if children has only 1 member

Dear developer.
This plugin is really awesome.
Just reporting, there is a problem with data like attached below.
If the "A" node is expanded, the chart will disappear.

const data = {  
   "labels":[{  
         "label":"A",
         "expand":false,
         "children":["2013"]
      },{  
         "label":"E",
         "expand":false,
         "children":["2013","2014","2015"]
      }],
   "datasets":[{  
         "label":"Exemplary",
         "backgroundColor":"blue",
         "tree":[{  
               "value":39.57,
               "children":[39.57]
            },
            {  
               "value":73.84,
               "children":[58.93,75.93,86.67]
            }]
      },{  
         "label":"Satisfactory",
         "backgroundColor":"green",
         "tree":[{
               "value":38.4,
               "children":[38.4]  
            },
            {  
               "value":19.23,
               "children":[32.14,16.67,8.89]
            }]
      },{  
         "label":"Developing",
         "backgroundColor":"orange",
         "tree":[{  
               "value":18.11,
               "children":[18.11]  
            },{  
               "value":6.33,
               "children":[7.14,7.41,4.44]
            }
         ]
      },{  
         "label":"Unsatisfactory",
         "backgroundColor":"red",
         "tree":[{  
               "value":3.92,
               "children":[3.92]  
            },{  
               "value":0.6,
               "children":[1.79,0,0]
            }]
      }]
};

Use of different colors (sequential color schemes depending on p-values) with two dataset does not work in hierarchical view

See working example with only one color for two datasets (testdata is also in git):
https://gitlab.bayer.com/Target360/plugins/gtex/blob/develop/src/Mouse2ManBarChart.ts

If you change the 6 arrays in the following code block to [this.blues((this.node2values.get(node)).qval),'green'] it does not work
https://gitlab.bayer.com/Target360/plugins/gtex/blob/5a5bb325ac582a5e095945fcefdbc11a3ff8235b/src/Mouse2ManBarChart.ts#L253-272

See also codepen (it doesn't work in generel - for whatever reason)
https://codepen.io/stephandecker/pen/XLbvNw?editors=0010

Update Codeowner

The code owner of this repository has changed, therefore it is necessary to update the repo.

Combination with pie breaks pie graph

If you use a pie chart and the hierarchical scale plugin on the same page the pie chart will not draw.

This is caused by the _enabled function which checks if the type is set to hierarchical for the x or y scale. However if there is no scale configured the property will not be found and the script will fail.

The solution is to modify the _enabled method to:

_enabled: function _enabled(chart) {
  if (!chart.config.options.hasOwnProperty('scales')) {
    return null;
  }

  if (this._isValidScaleType(chart, 'xAxes') && chart.config.options.scales.xAxes[0].type === 'hierarchical') {
    return 'x';
  }

  if (this._isValidScaleType(chart, 'yAxes') && chart.config.options.scales.yAxes[0].type === 'hierarchical') {
    return 'y';
  }

  return null;
},

The first line checks if there is a scale property, the _isValidScale_type method will do a full check:

_isValidScaleType: function _isValidScaleType(chart, scale) {
  if (!chart.config.options.scales.hasOwnProperty(scale)) {
    return false;
  }

  if (!Array.isArray(chart.config.options.scales[scale])) {
    return false;
  }

  return chart.config.options.scales[scale][0].hasOwnProperty('type');
},

This solves the issue and allows the different chart types on one page.

Parent node label

Add parent node name as label to expand button in all expanded levels

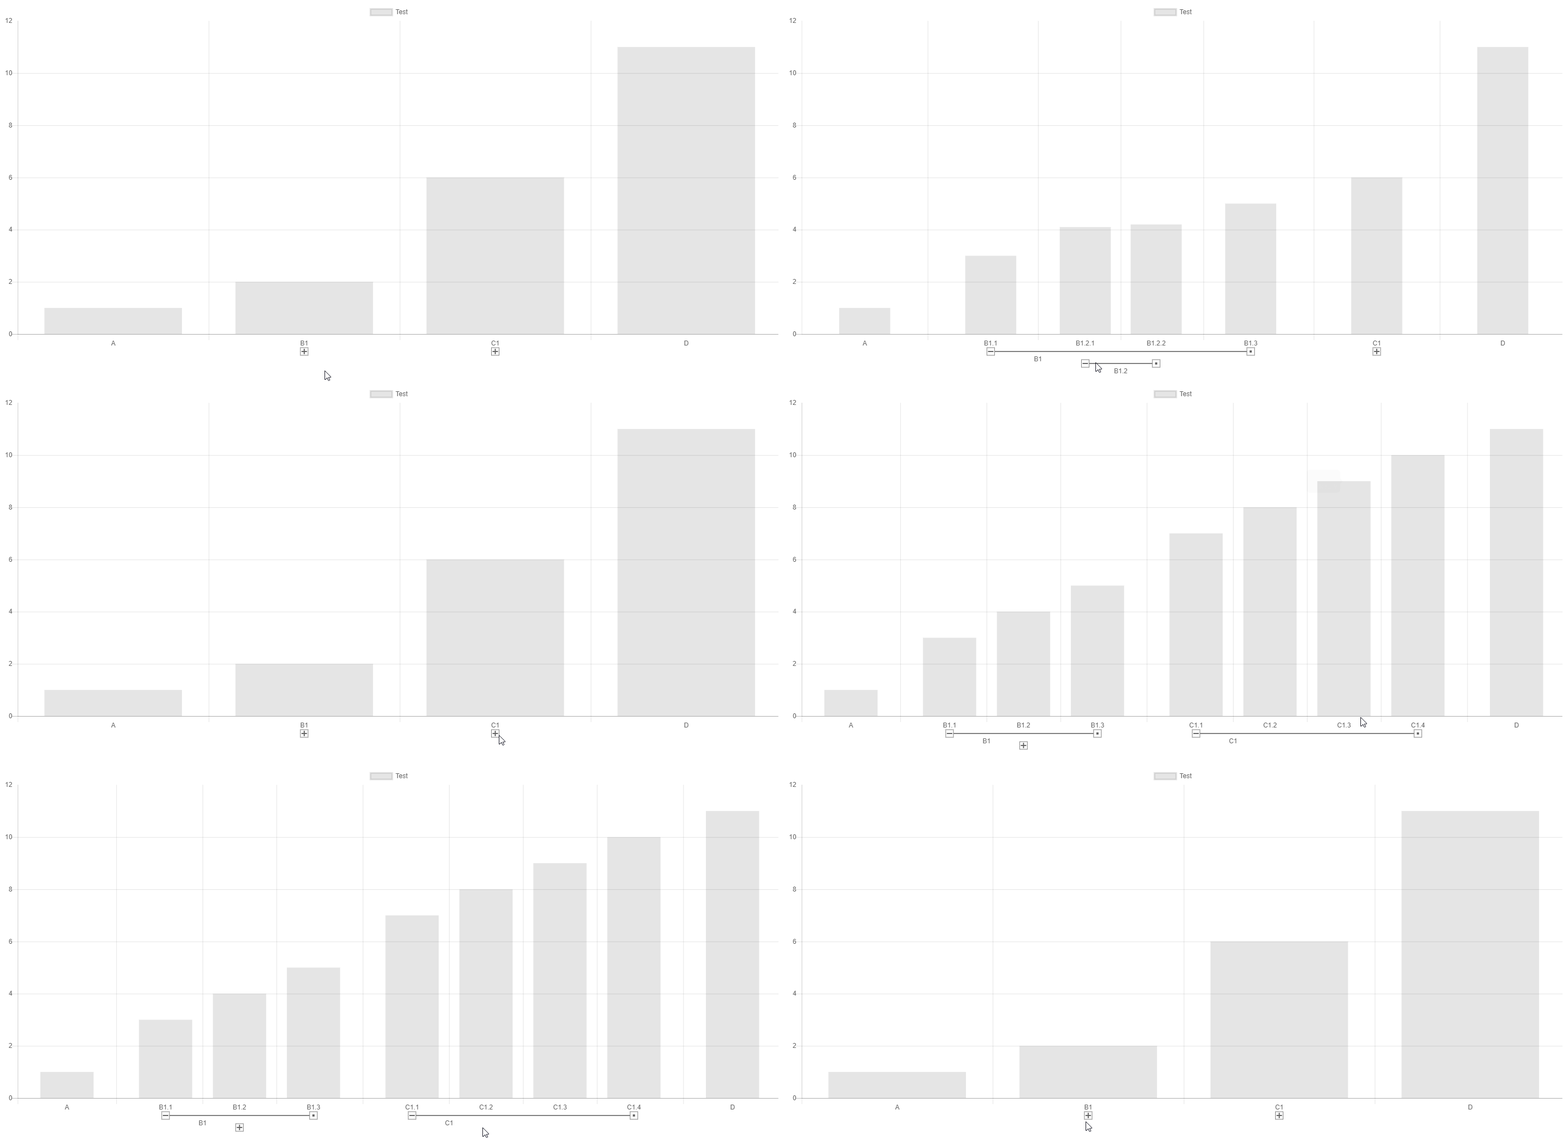
Bars are overlapping in certain cases

I cant really tell why this is happening. My guess is that if the bars are collapsed to a vertical line, which should not be possible i think, then the bars start overlapping too.

tested in chrome 67 on linux
samples/default.html

peek 2018-06-18 10-44

Recommend Projects

  • React photo React

    A declarative, efficient, and flexible JavaScript library for building user interfaces.

  • Vue.js photo Vue.js

    ๐Ÿ–– Vue.js is a progressive, incrementally-adoptable JavaScript framework for building UI on the web.

  • Typescript photo Typescript

    TypeScript is a superset of JavaScript that compiles to clean JavaScript output.

  • TensorFlow photo TensorFlow

    An Open Source Machine Learning Framework for Everyone

  • Django photo Django

    The Web framework for perfectionists with deadlines.

  • D3 photo D3

    Bring data to life with SVG, Canvas and HTML. ๐Ÿ“Š๐Ÿ“ˆ๐ŸŽ‰

Recommend Topics

  • javascript

    JavaScript (JS) is a lightweight interpreted programming language with first-class functions.

  • web

    Some thing interesting about web. New door for the world.

  • server

    A server is a program made to process requests and deliver data to clients.

  • Machine learning

    Machine learning is a way of modeling and interpreting data that allows a piece of software to respond intelligently.

  • Game

    Some thing interesting about game, make everyone happy.

Recommend Org

  • Facebook photo Facebook

    We are working to build community through open source technology. NB: members must have two-factor auth.

  • Microsoft photo Microsoft

    Open source projects and samples from Microsoft.

  • Google photo Google

    Google โค๏ธ Open Source for everyone.

  • D3 photo D3

    Data-Driven Documents codes.