Code Monkey home page Code Monkey logo

starlink's Introduction

Logo

Starlink Monitoring System

πŸ›°οΈ Measuring the performance of your "Beta" Starlink internet connection! πŸ“‘
Not affiliated with or acting on behalf of Starlinkℒ️

Report Bug β€’ Request Feature

Build Status Build Status Build Status Build Status Build Status Build Status Build Status Build Status

πŸ—οΈ Built With

  • 🐳 Starlink exporter - talks to the Starlink dish via gRPC and exposes metrics in a format Prometheus understands.
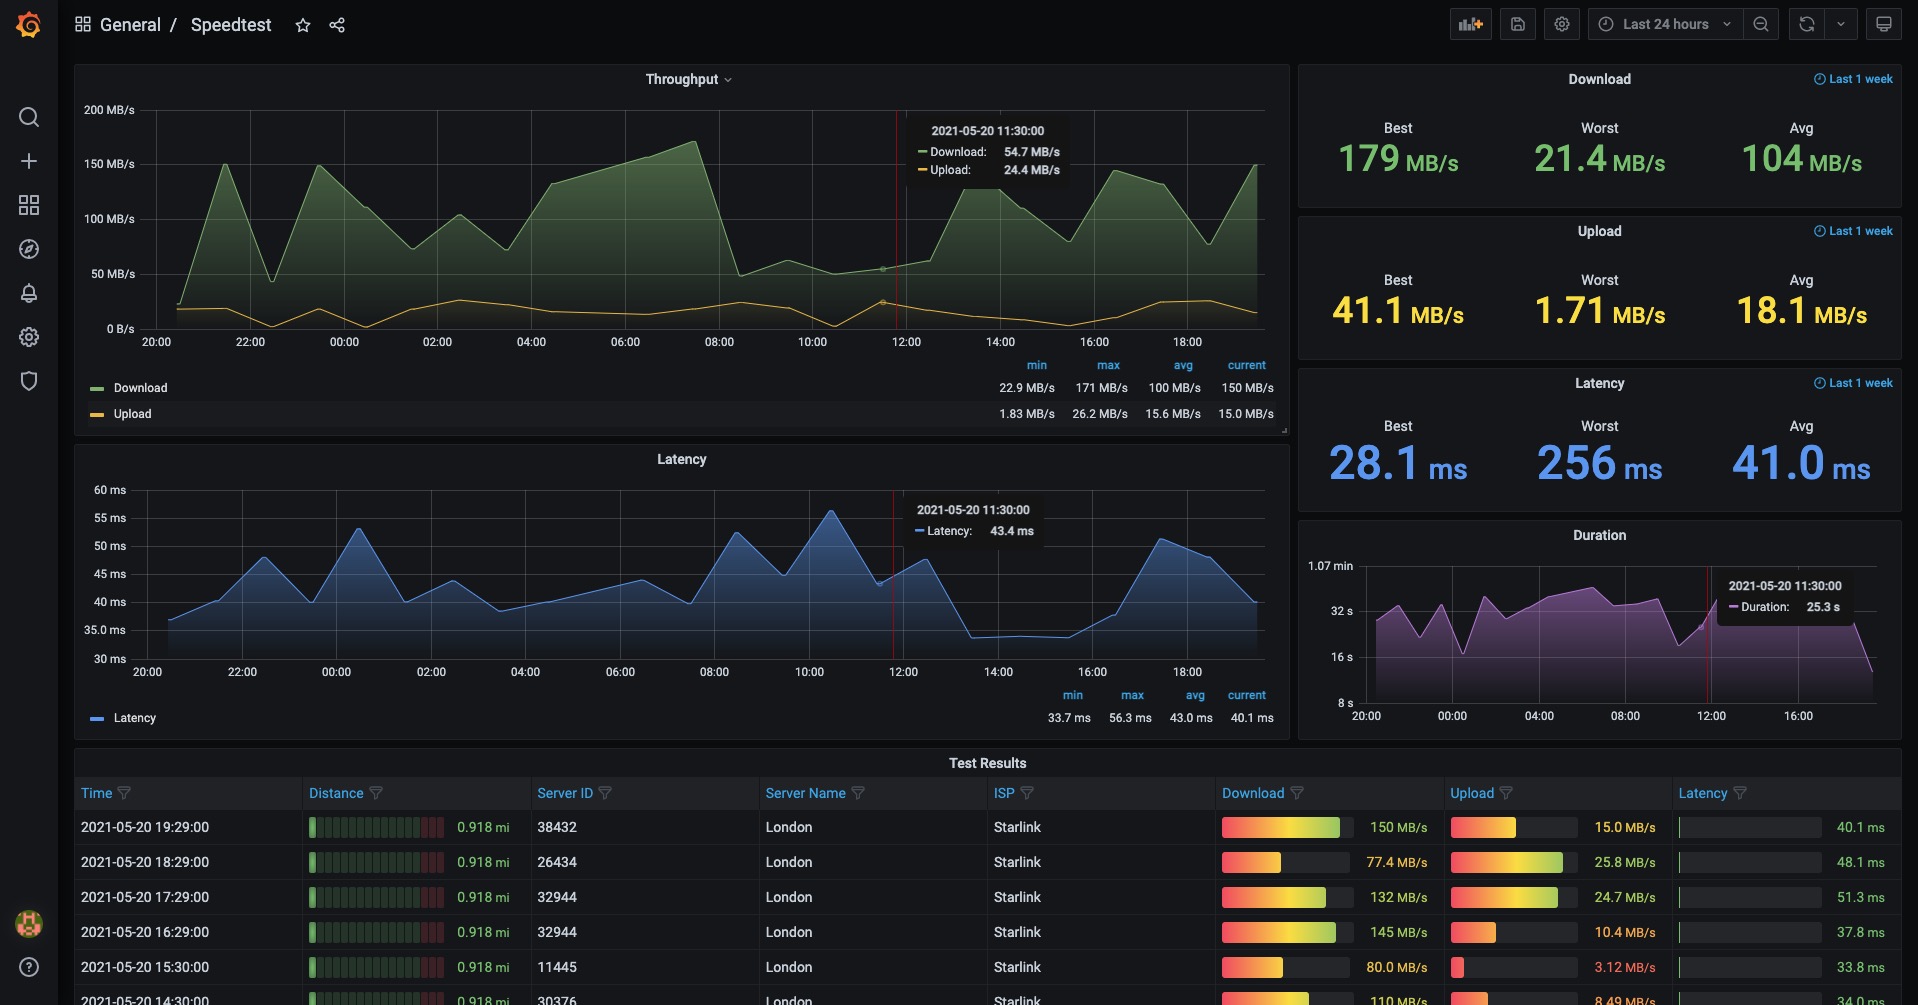
  • 🐳 Speedtest exporter - When asked it carries out a ping,upload and download test to speedtest.net.
  • 🐳 Blackbox exporter - Carries out high frequency ping tests.
  • 🐳 Grafana - used to compose observability dashboards.
  • 🐳 Prometheus - implements a highly dimensional data model.
  • 🐳 Docker-Compose - for defining and running multi-container Docker applications.

πŸ‘‹ Overview

I hope this project will make it easier for users to monitor their Starlink connection in even more detail, see its performance over time with each beta software release, but most importantly brag about their new satellite base internet to EVERYONE!

What does this do?

  1. Collects information from the Starlink dish every 3 seconds such as: signal strength, alarms, obstructions and latency
  2. Runs internet speed tests every 60 minutes (upload, download, ping)
  3. Measures latency to multiple destinations globally every 3 seconds
  4. Stores all the metrics in a local database (Prometheus time series database)
  5. You can then view the metrics on pre-built dashboards or create your own dashboards in Grafana.

⚠️ IMPORTANT: When running; this will carry out speedtests every 60 minutes, which will download and upload a fair amount of data over time. Please bare this in mind if your internet connection fails over to tethered/mobile or a data chargeable supplier when Starlink is not available.

🏎️ Quick Start

If you have good knowledge of the above technologies, possibly a Developer, DevOps Engineer, etc then quick start is for you:

  1. Clone the repo and cd into your local copy
  2. docker-compose pull && docker-compose up --remove-orphan
  3. Grafana is on localhost:3000 (admin/admin)
  4. The others services are on the ports as per the above diagram.

🐒 Detailed Start (Slower Start)

Pre-requisites

Ensure you install the latest version of docker and docker-compose on your host machine.

To test you have both installed correctly, open your Shell or Terminal and run following commands:

$ docker --version
$ docker-compose --version

Install

After installing the pre-requisites, You need all the files within this Github Repository downloaded to the machine you want to run the monitoring from. This machine must be connected to the same network as the Starlink dish (more then likely the Starlink wifi).

πŸ’‘ Please Star and Watch the repository to hopefully get updates as new features are added

Quick overview of the file structure you now have locally (for information only, you don't really need to know this):

starlink
β”œβ”€β”€ .docs                      # Extra docs and images
β”œβ”€β”€ config                     # Configuration for each service
β”‚   β”œβ”€β”€ grafana            
β”‚   β”‚   └── provisioning       
β”‚   β”‚        β”œβ”€β”€ dashboards    # The preloaded dashboards
β”‚   β”‚        └── datasources   # The preloaded config to talk with prometheus
β”‚   β”œβ”€β”€ prometheus             # Prometheus config file
β”‚   └── blackbox               # Blackbox exporter config file
β”œβ”€β”€ data                       # Persistent data
β”‚    β”œβ”€β”€ grafana               # Grafana will store its running files here
β”‚    └── prometheus            # Prometheus will store its running files here
└── docker-compose.yaml        # Defines all the applications to run

Setup

Open a terminal again and cd into the directory of your local copy. we will start all the services using Docker Compose and see logs on the terminal. The logs should quieten down, then your ready to read the "usage" section.

$ cd <path-to-your-copy>
$ docker-compose pull && docker-compose up --remove-orphan

Upgrading

The Docker Compose file will run the latest versions of all the applications. To upgrade you need to pull the new image versions and then restart the current running ones.

As we ran the original docker-compose up in the foreground, so we could watch the logs. Your need to open a new terminal and cd to the repository directory.

$ docker-compose pull
$ docker-compose restart

Stopping

To stop you can ctrl-c the foreground task in the original terminal and then:

$ docker-compose down

πŸ“ˆ Usage (from the browser)

Grafana:

  • This is where the pretty graphs are
  • Access via your browser at http://localhost:3000
  • The username and password is "admin" (no need to change it, its only local)
  • Pre-loaded dashboards are Starlink, Speedtest, Ping

Prometheus

  • If you know promQL, this is where you can create adhoc queries
  • Access via your browser at http://localhost:9090
  • You can check the state of the exporters here

Starlink Exporter

  • Standard usage there is no need to visit this
  • Access via your browser at http://localhost:9817
  • /metrics link will get the latest metrics from the Starlink dish
  • /health link shows you the gRPC connection state to the dish

Speedtest Exporter

  • Standard usage there is no need to visit this
  • Access via your browser at http://localhost:9092
  • /metrics link takes 40 seconds to load as it carries out a speedtest
  • You might get an error Limit of concurrent requests reached (1), try again later. this means a speedtest is already running
  • /health link shows you if it can reach the internet

Blackbox Exporter

  • Standard usage there is no need to visit this
  • Access via your browser at http://localhost:9115
  • Recent probes table shows you past ping test details

πŸ“– Extras

Running versioned images

If you would like more control over which versions of each image to run please visit: Moving to versioned releases

Pushing to a cloud based Grafana account

As standard all data stays on your local machine in the data folder, we do not collect your dish metrics centrally. If you would like more information about pushing metrics into your own Grafana cloud account: Pushing metrics to Grafana cloud

πŸ“ Roadmap

See the open issues for a list of proposed features (and known issues).

πŸ–‹οΈ License

GPL-3.0 License

😊 Author

This project was created in 2021 by Dan Willcocks.

πŸ‘Ž Troubleshooting

Some troubleshooting tips coming soon, until then raise an issue.

starlink's People

Contributors

dwillcocks avatar

Stargazers

 avatar  avatar  avatar  avatar  avatar  avatar  avatar  avatar  avatar  avatar  avatar  avatar  avatar  avatar  avatar  avatar  avatar  avatar  avatar  avatar  avatar  avatar  avatar  avatar  avatar  avatar  avatar  avatar  avatar  avatar  avatar  avatar  avatar  avatar  avatar  avatar  avatar  avatar  avatar  avatar  avatar  avatar  avatar  avatar  avatar  avatar  avatar  avatar  avatar  avatar  avatar  avatar  avatar  avatar  avatar  avatar  avatar  avatar  avatar  avatar  avatar  avatar  avatar  avatar  avatar  avatar  avatar  avatar  avatar  avatar  avatar  avatar  avatar  avatar  avatar  avatar  avatar  avatar  avatar  avatar  avatar  avatar  avatar  avatar  avatar  avatar  avatar  avatar  avatar  avatar  avatar  avatar  avatar  avatar  avatar  avatar  avatar  avatar  avatar  avatar

Watchers

 avatar  avatar  avatar  avatar  avatar  avatar  avatar  avatar  avatar  avatar  avatar  avatar  avatar  avatar  avatar  avatar  avatar  avatar  avatar  avatar  avatar  avatar  avatar  avatar  avatar

starlink's Issues

Monthly Statistic and Data usage would be nice

Is your feature request related to a problem? Please describe.
I like to have a monthly statistic on data usage as shown in the attached picture.
IMG_4535
You see the data usage total in upright corner.
You have daily graphs which honor the heavy use times 7 am to 11 pm in light blue and the rest in grey.
The legend gives you hint on the daily usage.

starlink exporter issue

Hi
Thanks for the lovely graphs, it would appear that with the release of dishy Mc Oblong the url of the stats and debug info has moved from the /support/debug to /debug
would it be possible to maybe add a small select dish type option?

Thanks and kind regards
Jon

Speedtest Panel Best values - mismatch with graph peaks ?

I have set the speedtest interval down to 3m in the prometheus.yml - the graphing illustrates correctly with peaks in download panel reports the Best inaccurately - the attached image you can see that the peak in the graph is ~153MB/s and the Best in the Panel is ~134MB/s ?
image

Also noted that the interval in these panels are set to "last 1 week" ? When I changed the scrape interval - was there another setting I need to change somewhere ?

Great work on putting this together - saved me countless hours - let me know how I can help !

Bufferbloat report

My early tests of the beta show enormous amounts of unneeded bufferbloat on the starlink uplink, downlink, and the wifi. To me, this is an easily fixable starlink problem, assuming they are using linux. Add sch_cake on the outbound pr eferably with backpressure from "BQL"( https://blog.linuxplumbersconf.org/2011/ocw/sessions/171 ), or using cake's built in shaper ( https://lwn.net/Articles/758353/ ) , add fq_codel ( https://tools.ietf.org/html/rfc8290 ) or something similar to SQM at the head-end, and fq_codel for wifi ( https://www.usenix.org/conference/atc17/technical-sessions/presentation/hoilan-jorgesen .

All these have standard APIs in the linux kernel - and would take, like, a week, to implement on the dishy for someone with clue. Well, the bloat on the wifi side is harder to fix (only support for this on 4 chipsets) but the wifi AQL and fq_codel APIs have long been in linux. ( https://lwn.net/Articles/705884/ )

The alternative... for consistently low latency under normal conditions is... sigh... is for an end user to closely monitor the connection with a tool like yours and adjust their local openwrt router's "SQM" implementation dynamically to suit with:

 ssh myrouter tc qdisc replace dev eth0 root cake bandwidth whateveritisnow... 

or get your measurement tool to run directly on openwrt.

So to make starlink bufferbloat more visible to users I am curious if you would be interested in adding a far, far more robust test than speedtest to your suite? flent's rrul test is pretty good, and the tcp_nup and tcp_ndown pretty useful.

I've established a network of flent.org servers around the world just for starlink and a mailing list ([email protected]) to discuss this and other ongoing measurements (and one of the participants steered me to your github).

Dashboard showing unknown and 0 for status, uptime, cell id, gateway id, satellite id

Describe the bug
Dashboard showing unknown and 0 for status, uptime, cell id, gateway id, satellite id

To Reproduce
Steps to reproduce the behavior:

  1. Go to 'dashboard
  2. attached info is always unknown or 0

Expected behavior
status should be online, values should be non-zero

Screenshots
Screen Shot 2021-11-04 at 11 13 30 AM

Additional context
Add any other context about the problem here.

  • OS: Mac
  • Starlink Exporter Version
  • "Comment": "buildkit.dockerfile.v0",
    "Created": "2021-07-26T18:21:00.104580224Z",

SpeedTest reports negative number

Describe the bug

The speed test dashboard shows a worst speed of -133MB/s ... which is interesting?!

image

This logs like it might correlate with error logs:

speedtest_exporter_1 | time="2021-10-01T11:52:37Z" level=error msg="failed to carry out upload test: Post "http://speedtest.tor.fibrestream.ca:8080/speedtest/upload.php\": write tcp 172.18.0.2:51928->162.250.172.153:8080: use of closed network connection"

speedtest_exporter_1 | time="2021-10-01T16:53:27Z" level=error msg="failed to carry out upload test: Post "http://speedtest.us-east-02.greenhousedata.com:8080/speedtest/upload.php\": EOF"

Expected behavior

Failed speed tests should probably just be ignored from a stats perspective?

Additional context

Windows host, running latest image.

Provide current Speedtest dashboard that is visible on the screenshoot

Hi,

thank you for creating this repo. I don't have a starlink, but I do want to monitor my network on my server. That's why I took speedtest exporter and I'm using it in my grafana. However, the dashboard that I see on screenshot seems to be much nicer that what is provided after the import of JSON file

https://raw.githubusercontent.com/danopstech/starlink/main/.docs/assets/screenshot2.jpg
https://github.com/danopstech/starlink/blob/main/config/grafana/provisioning/dashboards/speedtest.json

I fixed myself the units problem, but I don't see this nice test result table. For me, it looks like this

image

Am I missing some grafana plugin or is the JSON just outdated?

Thanks!

kwargs_from_env() got an unexpected keyword argument 'ssl_version'

Describe the bug
When trying to start the program for the first time, this error occurred and program stopped.

  File "/usr/local/bin/docker-compose", line 8, in <module>
    sys.exit(main())
  File "/usr/local/lib/python3.9/dist-packages/compose/cli/main.py", line 81, in main
    command_func()
  File "/usr/local/lib/python3.9/dist-packages/compose/cli/main.py", line 200, in perform_command
    project = project_from_options('.', options)
  File "/usr/local/lib/python3.9/dist-packages/compose/cli/command.py", line 60, in project_from_options
    return get_project(
  File "/usr/local/lib/python3.9/dist-packages/compose/cli/command.py", line 152, in get_project
    client = get_client(
  File "/usr/local/lib/python3.9/dist-packages/compose/cli/docker_client.py", line 41, in get_client
    client = docker_client(
  File "/usr/local/lib/python3.9/dist-packages/compose/cli/docker_client.py", line 124, in docker_client
    kwargs = kwargs_from_env(environment=environment, ssl_version=tls_version)
TypeError: kwargs_from_env() got an unexpected keyword argument 'ssl_version'

To Reproduce
Git clone repo
run docker-compose pull && docker-compose up --remove-orphan as specified in README

Expected behavior
Expected program to start

Screenshots
image

Additional context
Add any other context about the problem here.

  • OS: Raspberry Pi OS

Grafana admin password not working

Hi, had to reset the password to make it work, can you please verify if it is set correctly.

If anyone needs to reset as well:
docker exec -ti <container ID> grafana-cli admin reset-admin-password admin

Speedtest results not showing on Grafana dashboard

Really like all the stats and the presentation :)

The only issue I am having is re. no speed tests showing.

When I run: 192.168.0.10:9090/targets shows the attached. The other file is a view of the dashboard. Manually running metrics seems to run okay? Let me know if you need any more info.

HELP speedtest_download_speed_Bps Last download speedtest result

TYPE speedtest_download_speed_Bps gauge

speedtest_download_speed_Bps{distance="1.280413",server_country="United Kingdom",server_id="14679",server_lat="51.5074",server_lon="-0.1278",server_name="London",test_uuid="aae26888-c50d-4364-8a68-666c31186e89",user_ip="176.116.125.2",user_isp="Starlink",user_lat="51.4964",user_lon="-0.1224"} 6.2774412372626126e+07

HELP speedtest_latency_seconds Measured latency on last speed test

TYPE speedtest_latency_seconds gauge

speedtest_latency_seconds{distance="1.280413",server_country="United Kingdom",server_id="14679",server_lat="51.5074",server_lon="-0.1278",server_name="London",test_uuid="aae26888-c50d-4364-8a68-666c31186e89",user_ip="176.116.125.2",user_isp="Starlink",user_lat="51.4964",user_lon="-0.1224"} 0.053275246

HELP speedtest_scrape_duration_seconds Time to preform last speed test

TYPE speedtest_scrape_duration_seconds gauge

speedtest_scrape_duration_seconds{test_uuid="aae26888-c50d-4364-8a68-666c31186e89"} 44.773108303

HELP speedtest_up Was the last speedtest successful.

TYPE speedtest_up gauge

speedtest_up{test_uuid="aae26888-c50d-4364-8a68-666c31186e89"} 1

HELP speedtest_upload_speed_Bps Last upload speedtest result

TYPE speedtest_upload_speed_Bps gauge

speedtest_upload_speed_Bps{distance="1.280413",server_country="United Kingdom",server_id="14679",server_lat="51.5074",server_lon="-0.1278",server_name="London",test_uuid="aae26888-c50d-4364-8a68-666c31186e89",user_ip="176.116.125.2",user_isp="Starlink",user_lat="51.4964",user_lon="-0.1224"} 8.259880095672046e+06
Screenshot 2021-05-08 at 09 44 41


Screenshot 2021-05-08 at 09 43 03

Data Mismatch

Hi just looking at the data and (it may well be me), but there appears to be a mismatch - 127mb/s shown as the best in the table on the top right and 167mb/s on the rows at the bottom?

Screenshot 2021-05-08 at 17 24 20

Screenshot 2021-05-08 at 17 24 26

starlink_exporter

hello

I can't see the starlink data in graphana, the message is as follows:

There's an error in your script:
TypeError: Cannot read property 'fields' of undefined - line 3:28 (Check your console for more details)

on the console:

starlink_exporter_1 | time = "2021-07-14T16: 23: 50Z" level = error msg = "failed to collect context from dish: rpc error: code = Unimplemented desc = Unimplemented: " source = "exporter.go: 293"

can you help me please?
Thank you very much for this contribution!

Error of Plugin in Grafana

plugin_error
Thank you very much for creating and publishing a new and interesting Starlink monitoring tool.

I am trying to monitor Starlink observation data using the above mentioned monitoring tool, but I am having a problem that I cannot solve by myself.

As the screenshot attached to this email shows, I am getting an error message "An error occurred within the plugin".

I downloaded the plugin "ae3e-plotly-panel-master" and installed "plotly-panel" on Grafana.

I am very sorry, but if you could help me, I would appreciate it if you could tell me the appropriate plugin and how to use it.

Thank you in advance.

Add ABS wedge fraction Obstructions

Can we add ABS wedge fraction obstructions to the starlink dashboard?

I think it's just a case of copying the Current Wedge Fraction Obstructions and then changing it to look at wedge_abs_fraction_obstruction_ratio.

I've already done so on my install if the values seem to be sane I'll look at exporting the modified dashboard and submitting a PR.

Incorrect Port on prometheus.yml for speedtest

- job_name: 'speedtest' scrape_interval: 60m scrape_timeout: 70s static_configs: - targets: [ 'speedtest_exporter:9090' ]

Should be:

- job_name: 'speedtest' scrape_interval: 60m scrape_timeout: 70s static_configs: - targets: [ 'speedtest_exporter:9092' ]

Starlink Exporter error

Raspberry Pi 4 B

ietpi@DietPi:~/starlink$ sudo docker-compose pull && docker-compose up --remove-orphan
Pulling starlink_exporter ... done
Pulling speedtest_exporter ... done
Pulling blackbox ... done
Pulling prometheus ... done
Pulling grafana ... done
Creating starlink_starlink_exporter_1 ... done
Creating starlink_grafana_1 ... done
Creating starlink_speedtest_exporter_1 ... done
Creating starlink_prometheus_1 ... done
Creating starlink_blackbox_1 ... done
Attaching to starlink_starlink_exporter_1, starlink_speedtest_exporter_1, starlink_blackbox_1, starlink_prometheus_1, starlink_grafana_1
blackbox_1 | level=info ts=2022-06-12T03:44:52.105Z caller=main.go:224 msg="Starting blackbox_exporter" version="(version=0.19.0, branch=HEAD, revision=5d575b88eb12c65720862e8ad2c5890ba33d1ed0)"
blackbox_1 | level=info ts=2022-06-12T03:44:52.105Z caller=main.go:225 build_context="(go=go1.16.4, user=root@2b0258d5a55a, date=20210510-12:57:25)"
blackbox_1 | level=info ts=2022-06-12T03:44:52.106Z caller=main.go:237 msg="Loaded config file"
blackbox_1 | level=info ts=2022-06-12T03:44:52.108Z caller=main.go:385 msg="Listening on address" address=:9115
blackbox_1 | level=info ts=2022-06-12T03:44:52.109Z caller=tls_config.go:191 msg="TLS is disabled." http2=false
prometheus_1 | level=info ts=2022-06-12T03:44:53.695Z caller=main.go:388 msg="No time or size retention was set so using the default time retention" duration=15d
prometheus_1 | level=info ts=2022-06-12T03:44:53.698Z caller=main.go:426 msg="Starting Prometheus" version="(version=2.28.0, branch=HEAD, revision=ff58416a0b0224bab1f38f949f7d7c2a0f658940)"
prometheus_1 | level=info ts=2022-06-12T03:44:53.698Z caller=main.go:431 build_context="(go=go1.16.5, user=root@1d5eaa28fd24, date=20210621-15:36:14)"
prometheus_1 | level=info ts=2022-06-12T03:44:53.698Z caller=main.go:432 host_details="(Linux 5.15.32-v8+ #1538 SMP PREEMPT Thu Mar 31 19:40:39 BST 2022 aarch64 d1cb22b4015e (none))"
prometheus_1 | level=info ts=2022-06-12T03:44:53.698Z caller=main.go:433 fd_limits="(soft=1048576, hard=1048576)"
prometheus_1 | level=info ts=2022-06-12T03:44:53.698Z caller=main.go:434 vm_limits="(soft=unlimited, hard=unlimited)"
prometheus_1 | level=info ts=2022-06-12T03:44:53.716Z caller=web.go:541 component=web msg="Start listening for connections" address=0.0.0.0:9090
prometheus_1 | level=info ts=2022-06-12T03:44:53.722Z caller=main.go:807 msg="Starting TSDB ..."
prometheus_1 | ts=2022-06-12T03:44:53.731Z caller=log.go:124 component=web level=info msg="TLS is disabled." http2=false
prometheus_1 | level=info ts=2022-06-12T03:44:53.750Z caller=head.go:780 component=tsdb msg="Replaying on-disk memory mappable chunks if any"
prometheus_1 | level=info ts=2022-06-12T03:44:53.750Z caller=head.go:794 component=tsdb msg="On-disk memory mappable chunks replay completed" duration=12.259Β΅s
prometheus_1 | level=info ts=2022-06-12T03:44:53.750Z caller=head.go:800 component=tsdb msg="Replaying WAL, this may take a while"
prometheus_1 | level=info ts=2022-06-12T03:44:53.752Z caller=head.go:854 component=tsdb msg="WAL segment loaded" segment=0 maxSegment=0
prometheus_1 | level=info ts=2022-06-12T03:44:53.752Z caller=head.go:860 component=tsdb msg="WAL replay completed" checkpoint_replay_duration=227.649Β΅s wal_replay_duration=1.14937ms total_replay_duration=2.325518ms
prometheus_1 | level=info ts=2022-06-12T03:44:53.758Z caller=main.go:834 fs_type=EXT4_SUPER_MAGIC
prometheus_1 | level=info ts=2022-06-12T03:44:53.759Z caller=main.go:837 msg="TSDB started"
prometheus_1 | level=info ts=2022-06-12T03:44:53.759Z caller=main.go:964 msg="Loading configuration file" filename=/etc/prometheus/prometheus.yml
prometheus_1 | level=info ts=2022-06-12T03:44:53.765Z caller=main.go:995 msg="Completed loading of configuration file" filename=/etc/prometheus/prometheus.yml totalDuration=6.057185ms remote_storage=4.518Β΅s web_handler=1.76Β΅s query_engine=2.815Β΅s scrape=3.582871ms scrape_sd=178.092Β΅s notify=2.333Β΅s notify_sd=6.871Β΅s rules=4.018Β΅s
prometheus_1 | level=info ts=2022-06-12T03:44:53.766Z caller=main.go:779 msg="Server is ready to receive web requests."
starlink_exporter_1 | time="2022-06-12T03:44:53Z" level=fatal msg="could not start exporter: error creating underlying gRPC connection to starlink dish: context deadline exceeded"
starlink_exporter_1 | time="2022-06-12T03:44:58Z" level=fatal msg="could not start exporter: error creating underlying gRPC connection to starlink dish: context deadline exceeded"
starlink_starlink_exporter_1 exited with code 1
starlink_exporter_1 | time="2022-06-12T03:45:02Z" level=fatal msg="could not start exporter: error creating underlying gRPC connection to starlink dish: context deadline exceeded"
starlink_starlink_exporter_1 exited with code 1
starlink_exporter_1 | time="2022-06-12T03:45:07Z" level=fatal msg="could not start exporter: error creating underlying gRPC connection to starlink dish: context deadline exceeded"
starlink_starlink_exporter_1 exited with code 1
starlink_exporter_1 | time="2022-06-12T03:45:11Z" level=fatal msg="could not start exporter: error creating underlying gRPC connection to starlink dish: context deadline exceeded"
starlink_starlink_exporter_1 exited with code 1
starlink_exporter_1 | time="2022-06-12T03:45:17Z" level=fatal msg="could not start exporter: error creating underlying gRPC connection to starlink dish: context deadline exceeded"
starlink_starlink_exporter_1 exited with code 1
^CGracefully stopping... (press Ctrl+C again to force)
Stopping starlink_prometheus_1 ... done
Stopping starlink_blackbox_1 ... done
Stopping starlink_speedtest_exporter_1 ... done
Stopping starlink_grafana_1 ... done
Stopping starlink_starlink_exporter_1 ... done

Error in Current Wedge Fraction Obstructions

docker-compose pull && docker-compose up

Shows an error in the CWFO panel

image

There's an error in your script :
TypeError: Cannot read properties of undefined (reading 'fields') - line 3:28 (Check your console for more details)
runRequest.catchError {"type":"cancelled","cancelled":true,"data":null,"status":-1,"statusText":"Request was aborted","config":{"method":"GET","url":"api/annotations","params":{"from":1684339656956,"to":1684341456956,"limit":100,"matchAny":false,"dashboardUID":"GG3mnflGz"},"requestId":"grafana-data-source-annotations-Annotations & Alerts-GG3mnflGz","retry":0,"headers":{"X-Grafana-Org-Id":1},"hideFromInspector":true}}
overrideMethod @ react_devtools_backend_compact.js:2367
Gauge rendering error Error: Invalid dimensions for plot, width = 0, height = 74
    at n.resize (jquery.flot.js:136:13)
    at new n (jquery.flot.js:114:10)
    at jquery.flot.js:1326:17
    at new s (jquery.flot.js:714:5)
    at e.plot (jquery.flot.js:3296:16)
    at v.draw (Gauge.tsx:140:9)
    at v.componentDidUpdate (Gauge.tsx:51:10)
    at ps (react-dom.production.min.js:219:502)
    at Au (react-dom.production.min.js:259:160)
    at t.unstable_runWithPriority (scheduler.production.min.js:18:343)

Speed Test Graphs not showing

I might be being dumb this morning so apologies, but I the graph from the speed test is not showing despite the data being there and the speed tests running. I've not edited or changed the installed speed test panel.

Screenshot 2022-03-30 at 09 55 39

The other dashboards - ping & starlink are working fine. Completely removed and re-installed, still no joy. The metrics seem to be working ok, but still nothing on the graph despite the data being logged.

Is the reported speed MB/s or should it be Mbps?

It may be me getting my bits and bytes confused - apologies if it is.

As an example Speedtest.net is reporting approx 179Mbps download speed which is roughly what the dashboard is showing, but the dashboard is labelled as MB/s? 179Mbps is 22.375 MB/s?

Connect to App with router in Bypass mode

Is your feature request related to a problem? Please describe.
Unsure if it will be possible but can we still pull all these stats while the router is in bypass mode?

Describe the solution you'd like
Be able to use this app to pull stats while the router is in bypass mode.

Describe alternatives you've considered
Not running in bypass mode.

Additional context
I am going to be running a standard internet connection and starlink through a Firewall so the router will be in bypass mode.

Speedtest Dashboard Enhancement

Is your feature request related to a problem? Please describe.
No. It's an enhancement to speedtest dashboard/speedtest exporter.

Describe the solution you'd like
Optionally add in (at user discretion) the direct ookla speedtest test results url/id (as the uuid is not valid for the results url) for sharing to places such as https://starlinktrack.com/speedtests/ .

Relevant dev for above website:
@AliMickey

Describe alternatives you've considered
Alternatively for a more "realistic" use-case of the speedtest dashboard how about integrating this exporter instead as it's more relevant since it relies on Cloudflare Servers Only (real-world results for most websites/games/etc) for the test results rather than random servers that anyone can throw up via ookla's hosting guidelines.

https://github.com/martinbrose/cloudflare-speedtest-exporter
https://github.com/tevslin/cloudflarepycli

Relevant devs for above gits:
@martinbrose
@tevslin

Additional context
Cloudflarepycli often provides exact groundstation you're connecting to as well as 90th percentile averages.

WindowsTerminal_SsT0a8WGtq

Prometheus data retention?

It looks like Prometheus's data retention default is 15 days. Is there an easy way to change that(looking to store ~30 days)?

I am not an expert on containers or Prometheus.

Thank you.

Hello I'm interested

Hello, sorry for the inconvenience but I am very interested in this project, and I would like to know if you could help me execute it

Recommend Projects

  • React photo React

    A declarative, efficient, and flexible JavaScript library for building user interfaces.

  • Vue.js photo Vue.js

    πŸ–– Vue.js is a progressive, incrementally-adoptable JavaScript framework for building UI on the web.

  • Typescript photo Typescript

    TypeScript is a superset of JavaScript that compiles to clean JavaScript output.

  • TensorFlow photo TensorFlow

    An Open Source Machine Learning Framework for Everyone

  • Django photo Django

    The Web framework for perfectionists with deadlines.

  • D3 photo D3

    Bring data to life with SVG, Canvas and HTML. πŸ“ŠπŸ“ˆπŸŽ‰

Recommend Topics

  • javascript

    JavaScript (JS) is a lightweight interpreted programming language with first-class functions.

  • web

    Some thing interesting about web. New door for the world.

  • server

    A server is a program made to process requests and deliver data to clients.

  • Machine learning

    Machine learning is a way of modeling and interpreting data that allows a piece of software to respond intelligently.

  • Game

    Some thing interesting about game, make everyone happy.

Recommend Org

  • Facebook photo Facebook

    We are working to build community through open source technology. NB: members must have two-factor auth.

  • Microsoft photo Microsoft

    Open source projects and samples from Microsoft.

  • Google photo Google

    Google ❀️ Open Source for everyone.

  • D3 photo D3

    Data-Driven Documents codes.