Last update: 4/27/2021

The objective of this project is to analyze risk for fire in Northern and Southern California from 1/1/2018 to 9/13/2020 based off of environmental conditions and satellite imagery. My objective can be organized in three points:
- Transfer learning with Xception for smoke detection in satellite imagery.
- A Classifier for fire risk based on daily conditions data.
- Explore feature importances and how to combine a final model with human supervision to make better decisions in combatting fire risk.
This project is comprised of two datasets: one containing daily satellite imagery of Northern and Southern California, and one of daily environmental conditions by county and region. Data preparation resulted in approximately 2,000 satellite images (heavily imbalanced with more foggy images than smoke images). Tabular data collection resulted in 127,138 observations with 14 features of environmental conditions (also heavily imbalanced) and a binary target column. Data was scraped from the two websites below.
- Images: USDA Forest Service Satellite Imagery
- Tabular: CIMIS Conditions
Image data was collected from the USDA Forest Service with selenium using a chromedriver. View the source code in image_selenium.py. Image data consists of true color satellite imagery at a spatial resolution of 250 meters. Satellites/sensors and their correspdonging image band combination are listed below. More information on the Terra and Aqua satellites can be found here.
- Aqua MODIS (Moderate Resolution Imaging Spectroradiometer) Corrected Reflectance, True Color Composite (Bands 1, 4, and 3)
- Terra MODIS Corrected Reflectance, True Color Composite (Bands 1, 4, and 3)
Example image classes: the left image is labeled as smoke and visually the smoke appears off-color and does not have a general pattern or specific density. The image on the right is labeled as fog and we can see the differences in fog vs. smoke off the bat: fog is whiter, has patterns, or appears in dense clouds.


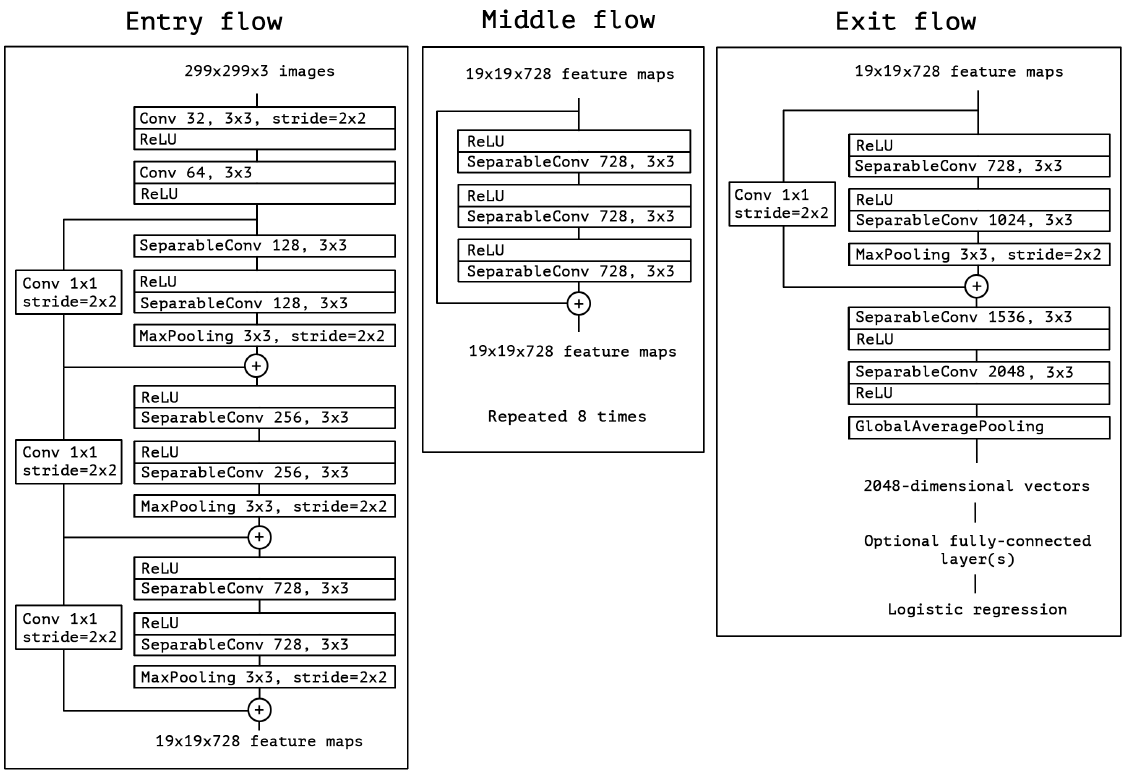
Xception neural network architecture was trained to detect smoke in satellite imagery, using transfer learning with ImageNet weights. Layers were unfrozen in 4 layer increments and trained for 10 epochs until the final model had approximately 74 unfrozen layers. Note that the imbalanced dataset needed to be weighted before training. Xception's model architecture:

Several predictions are listed below, to evaluate the model's abilities to determine smoke in images from the validation set.
-
The first image is labeled as smoke and the model classified it correctly as smoke.
-
The second is labeled fog and the model also classified it correctly.
-
The third image is a great example for how the model is not perfect and categorized the image as mainly smoke. Visually, it is hard for the human eye to determine if there is smoke or fog in that image.


The conditions dataframe was downloaded in batches from CIMIS California Department of Water Resources which provides hourly, daily, and monthly information. Readers can access the cleaned csv conditions_df.csv in the data folder and a pipeline for modeling prep in pipeline.py. The data represents entries from 1/1/2018 to 9/13/2020 however the dates were dropped for simplification (further work: fire risk forecasting). "Target" represents a binary classification for fire or no fire. Target column was merged from Wikipedia tables.
Dataset contains approximately 16% null values of the positive target class and a class imbalance. KNN Imputation was used to determine NaNs. Pipeline also consists of standardization of numerical features and one-hot encoding of station ids to represent location. Dataset contained one outlier labeled "experimental". Details in eda.ipynb.

Compared out of box Logistic Regression (with iterations increased for convergence), Decision Tree, Random Forest, and XGBoost. Recall is the ideal metric for fire risk to minimize false negatives (ignoring a fire alarm). Out-Of-Box (OOB) XGBoost outpeforms Random Forest in 30-fold cross validation on validation data.

OOB Random Forest Classifier learning curve and confusion matrix on validation data.


OOB XGBoost Classifier learning curve and confusion matrix on validation data.


GridSearchCV'd to better compare RF to XGB. Each search totalled 192 fits. Tuned RF Classifier learning curve and confusion matrix on validation data. Tuned Random Forest performed 60% better on validation data! Average recall on 30 fold cross validation: 77%. This came at the cost of A TON MORE FALSE POSITIVES. YIKES.


Tuned XGBoost Classifier learning curve and confusion matrix on validation data. 7% improvement on validation set recall on top of OOB XGB. However severely under performs in comparison to the GridSearched RF. For further work, consider using RandomSearchCV on an XGBoost for better hyperparameter choices.


Final model chosen for highest recall on validation set. Notice high recall at the cost of very poor precision. Final model scores:
| Recall | Precision | F1 | Accuracy |
|---|---|---|---|
| 0.84 | 0.096 | 0.17 | 0.75 |
Inspecting the feature importances will yield insights on features that the model's trees split on most to predict the target.

Cherry picking interesting features and plotting their partial dependence plots yields standardized features on the x-axis and probability for fire classification on y-axis. It's important to note that the complete pipeline has not been built, so destandardizing the features is not possible YET.
Avg Soil Temp (F)> 0 (after StandardScaler in pipeline) there is 30%-45% chance for fire risk which increases exponentially (quickly) with risingAvg Soil Temp (F)- -0.6 <
Sol Rad (Ly/day)< 0.5 there is a 2% higher chance for fire risk - As
Avg Rel Hum (%)increases to its average, chances for fire risk decrease 7% (38% -> baseline 31%)

- Build scraping pipeline to load most recent satellite imagery and conditions data to S3 bucket.
- Keras's functional api. Combine image model and conditions model for a weighted soft classification for fire risk.
- LSTM or other forecasting method for tabular data.
- User interface on dashboard or application to assist firefighters or local authorities in determining fire risk and to aid in making decisions.


