cartography


Create and integrate maps in your R workflow!

This package allows various cartographic representations such as proportional symbols, choropleth, typology, flows or discontinuities maps. It also offers several features enhancing the graphic presentation of maps like cartographic palettes, layout elements (scale, north arrow, title...), labels, legends or access to some cartographic APIs.
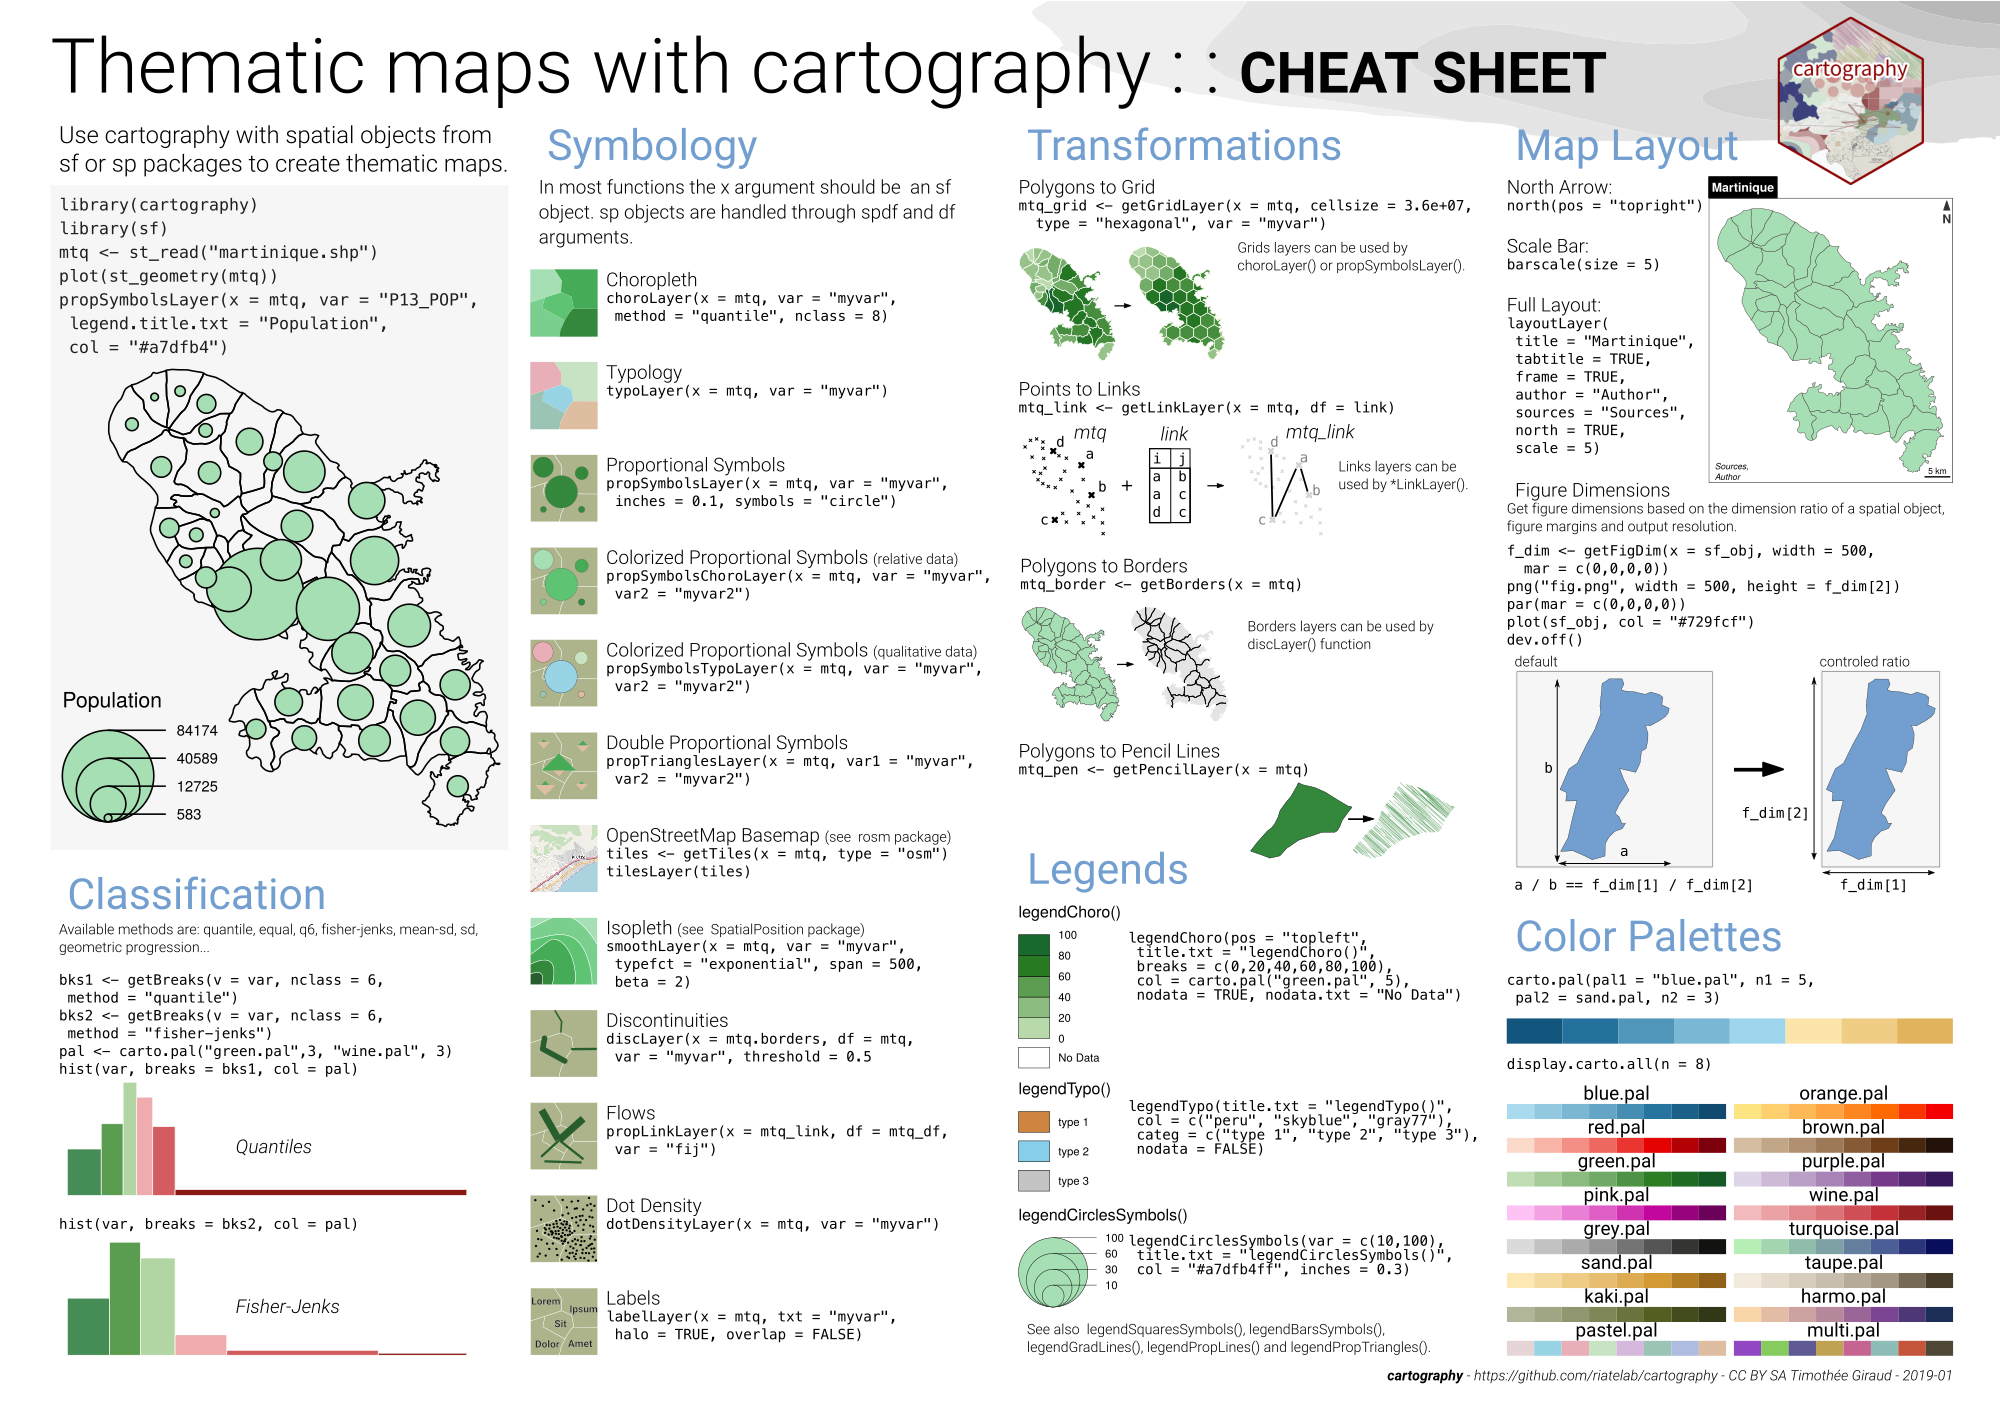
Cheat Sheet
The cheat sheet displays a quick overview of cartography's main features:
Vignette
The vignette
contains commented scripts on how to build various types of maps with cartography:
 |
 |
 |
 |
 |
 |
Blog Posts, Tutorials & Papers
Giraud, T. and Lambert, N. (2017). “Reproducible Cartography.” In Peterson MP (ed.), Advances in Cartography and GIScience. ICACI 2017. Lecture Notes in Geoinformation and Cartography., pp.
173-183. doi: 10.1007/978-3-319-57336-6_13. (EN)
Cartographie reproductible (FR)
New version of the cartography package (EN)
SF & cartography V2.0.0 (FR)
Demo
-
You can access the code used to create the cartographic mix here.
-
The following script creates a map of symbols that are proportional to values of a first variable and colored to reflect the discretization of a second variable.
library(cartography)

# Import a shapefile // this one is distributed within the package
mtq <- st_read(system.file("shape/martinique.shp", package="cartography"))

# Share of farmers in the active population
mtq$shareCS1 <- 100 * mtq$C13_CS1/mtq$C13_POP

# Set a custom color palette
cols <- carto.pal(pal1 = "wine.pal", n1 = 6)

# set plot margins
opar <- par(mar = c(0,0,1.2,0))

# Plot the communes
plot(st_geometry(mtq), col = "#5F799C", border = "white",
     bg = "#A6CAE0", lwd = 0.5, add = FALSE)

# Plot symbols with choropleth coloration
propSymbolsChoroLayer(x = mtq, # sf object
                      var = "C13_POP", # field used to plot the symbols sizes
                      var2 = "shareCS1", #  field used to plot the colors
                      col = cols, # symbols colors
                      inches = 0.4, # radius of the largest circle
                      method = "quantile", # discretization method (?getBreaks)
                      border = "grey50", # color of circle borders
                      lwd = 1, # width of the circle borders
                      legend.var.pos = "topright", # position of the first legend
                      legend.var2.pos = "left", # position of the second legend
                      legend.var2.title.txt =
                        "Share of \nthe population\nworking in\nagriculture (%)",
                      legend.var.title.txt = "Population aged\n15 and over",
                      legend.var.style = "c") # legend style

# Add a layout
layoutLayer(title="Farmers in Martinique, 2013", # title of the map
            scale = 5, # size of the scale bar
            north = TRUE, # north arrow
            col = "white",
            coltitle = "black",
            author = "cartography 2.0.0",
            sources = "INSEE, 2016",
            frame = TRUE)

# restore graphics parameters
par(opar)
Installation
- Development version on GitHub
require(devtools)
install_github("riatelab/cartography")
- Stable version on CRAN
install.packages("cartography")
Alternatives Packages
Community Guidelines
One can contribute to the package through pull requests and report issues or ask questions here.


