Code Monkey home page Code Monkey logo

covid19datavisualizationhololens2's Introduction

COVID19 Data Visualization with HoloLens2 + MRTK

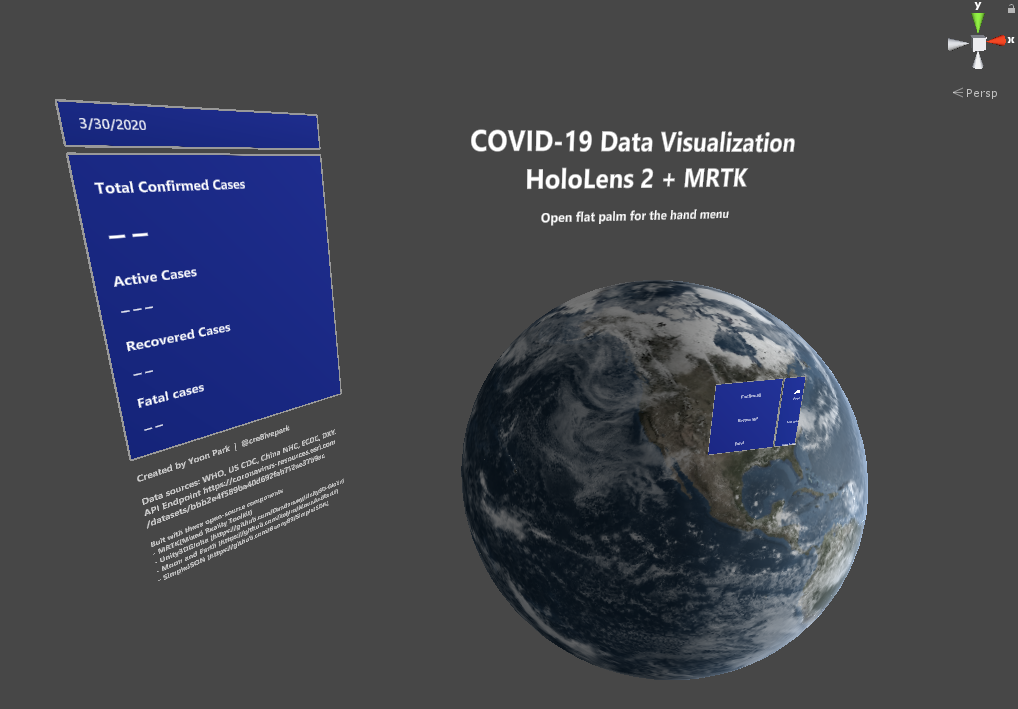
Experimental COVID-19 Data Visualization for HoloLens 2 with MRTK. This project explores how volumetric data can be represented in physical space with direct hand-tracking inputs in mixed reality using HoloLens 2. It is based on Microsoft's MRTK(Microsoft's Mixed Reality Toolkit)
The project works with HoloLens 1st gen as well. (use static menu instead of hand menu)

20200330_231204_HoloLens COVID_HL2_0405B

Video (Updated 4/5/2020)

https://youtu.be/mN7VM2h41_w

Data source

ESRI's Coronavirus COVID-19 Cases feature layer
https://coronavirus-resources.esri.com/datasets/bbb2e4f589ba40d692fab712ae37b9ac

Project

DataVisualizer.cs script contains the code for retrieving, parsing JSON data, and visualizing with graphs. Graph elements are added to GraphContainerConfirmed, GraphContainerRecovered, GraphContainerFatal, and LabelContainer. CreateMeshes() creates the graph for three data values and text label. Main menu's Radio buttons simply show/hide GraphContainer objects. 2020-04-05 18_26_25-COVIDDataVizGit - Microsoft Visual Studio
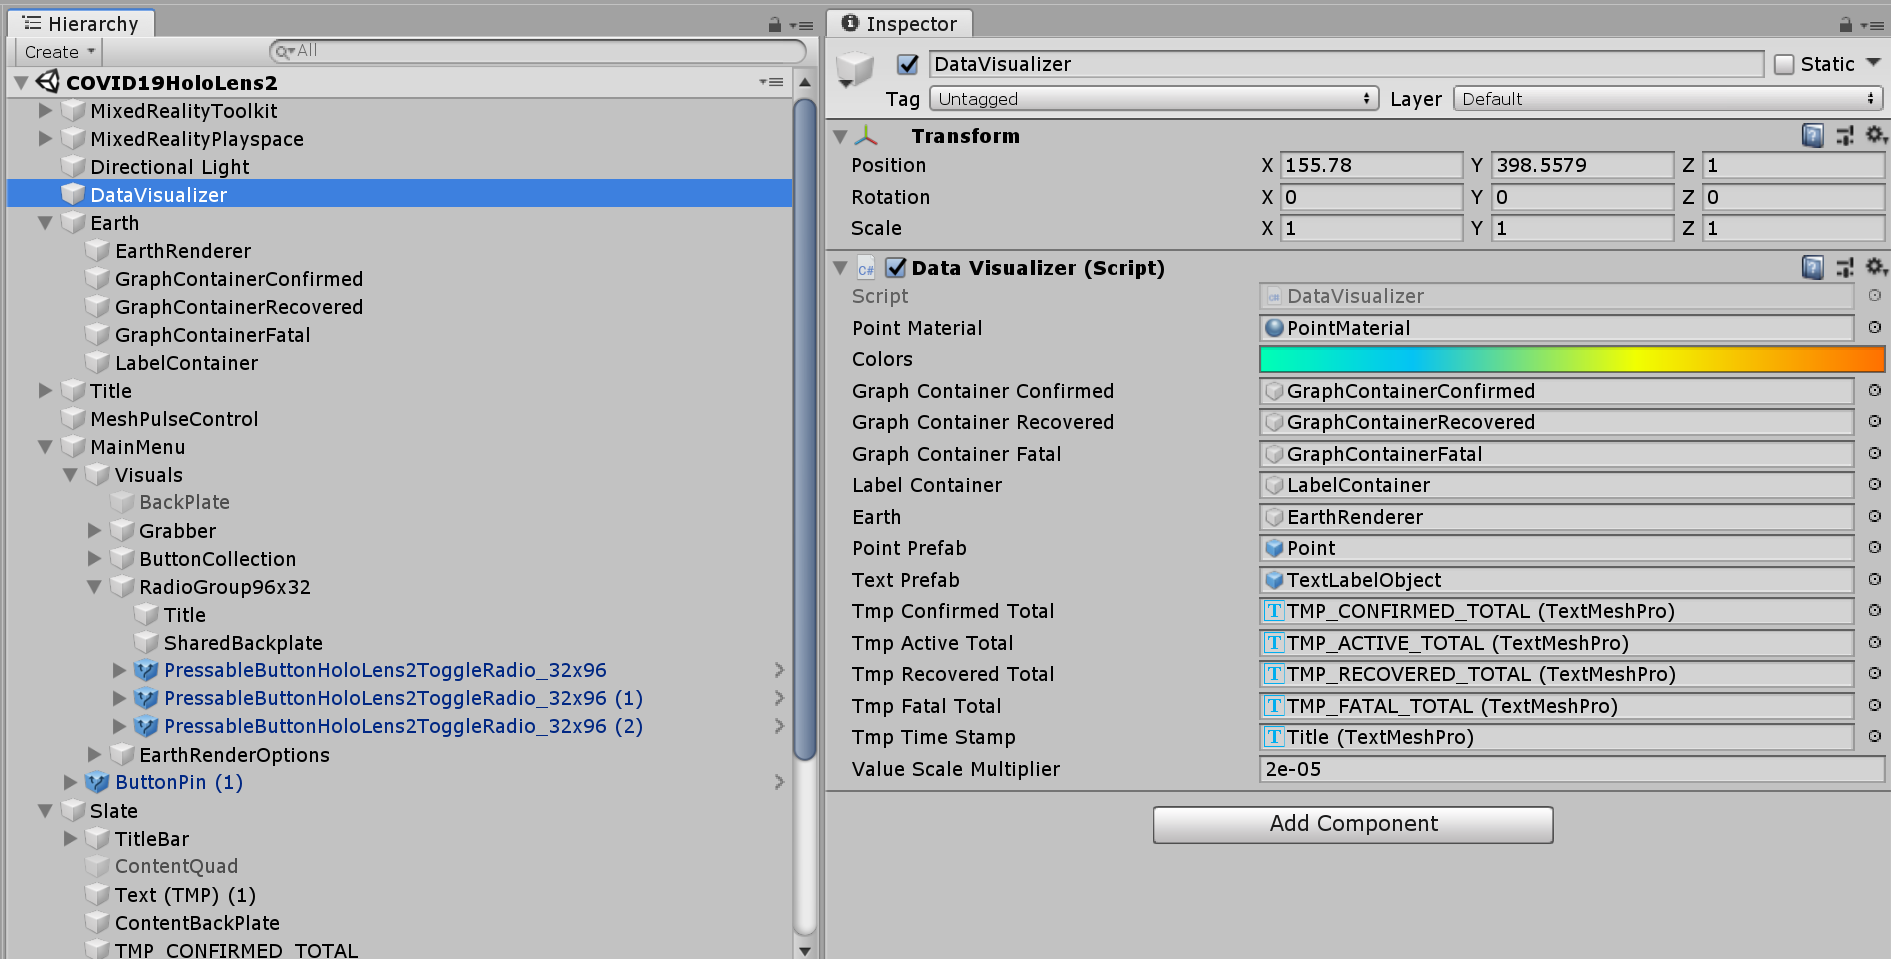


Menu stays around the user with tag-along behavior which is provided by MRTK's RadialView solver. Using the pin button, you can toggle tag-along behavior. Menu's backplate can be grabbed and moved. Grabbing and moving menu automatically disables the tag-along and makes the menu world-locked.

Menu's toggle button shows & hides GraphContainer and LabelContainer. Use slider UI for configuring the earth rendering options.

  • Earth color saturation level
  • Cloud opacity
  • Sea color saturation level

2020-03-31 09_58_03-Unity 2018 4 12f1 Personal - COVID19HoloLens2 unity - COVIDDataVizGit - PC, Mac 2020-04-05 11_22_36-Unity 2018 4 12f1 Personal - COVID19HoloLens2 unity - COVIDDataVizGit - Universa

Build and deploy

Please make sure to use 'Single Pass' (not Single Pass Instanced) to render graph properly on the device. 2020-04-02 21_46_58-Unity 2018 4 12f1 Personal - COVID19HoloLens2 unity - COVIDDataVizGit - Universa

Built with these open-source components

Features

  • Near interactions with direct grab/move/rotate (one or two-handed)
  • Far interactions using hand ray (one or two-handed)
  • Main menu to switch the data, change earth rendering options
  • Toggle graph, text label
  • Toggle auto-rotate

Known issues

  • Data normalization & polish needed
  • Sometimes two-handed manipulation makes the globe tiny and not properly scalable. Use hand-ray to make it bigger again.

MadeWithMRTK_1920x

Disclaimer

*I work at Microsoft as a User Experience Designer. This project is my personal project. All experiments and related opinions are my own.

covid19datavisualizationhololens2's People

Contributors

cre8ivepark avatar dancrichards avatar

Stargazers

 avatar  avatar  avatar  avatar  avatar  avatar  avatar  avatar  avatar  avatar  avatar  avatar  avatar  avatar  avatar  avatar  avatar  avatar  avatar  avatar  avatar  avatar  avatar  avatar  avatar  avatar  avatar  avatar  avatar  avatar  avatar  avatar  avatar  avatar  avatar  avatar  avatar  avatar  avatar  avatar  avatar  avatar  avatar  avatar  avatar  avatar  avatar  avatar  avatar  avatar  avatar  avatar  avatar  avatar  avatar  avatar  avatar  avatar  avatar  avatar  avatar  avatar  avatar  avatar  avatar  avatar  avatar  avatar  avatar  avatar  avatar  avatar  avatar  avatar  avatar  avatar  avatar  avatar  avatar  avatar  avatar  avatar  avatar  avatar  avatar

Watchers

 avatar  avatar  avatar

covid19datavisualizationhololens2's Issues

Graph line doesn't show on Hololens 1 recording

Steps to reproduce

  1. Run the program and ensure line data can be shown
  2. Use the hololens screen capture tool to record.
  3. Playback recording

I don't like creating issues on someone else's project, but I hope this helps with you knowing :)
image
image

Recommend Projects

  • React photo React

    A declarative, efficient, and flexible JavaScript library for building user interfaces.

  • Vue.js photo Vue.js

    ๐Ÿ–– Vue.js is a progressive, incrementally-adoptable JavaScript framework for building UI on the web.

  • Typescript photo Typescript

    TypeScript is a superset of JavaScript that compiles to clean JavaScript output.

  • TensorFlow photo TensorFlow

    An Open Source Machine Learning Framework for Everyone

  • Django photo Django

    The Web framework for perfectionists with deadlines.

  • D3 photo D3

    Bring data to life with SVG, Canvas and HTML. ๐Ÿ“Š๐Ÿ“ˆ๐ŸŽ‰

Recommend Topics

  • javascript

    JavaScript (JS) is a lightweight interpreted programming language with first-class functions.

  • web

    Some thing interesting about web. New door for the world.

  • server

    A server is a program made to process requests and deliver data to clients.

  • Machine learning

    Machine learning is a way of modeling and interpreting data that allows a piece of software to respond intelligently.

  • Game

    Some thing interesting about game, make everyone happy.

Recommend Org

  • Facebook photo Facebook

    We are working to build community through open source technology. NB: members must have two-factor auth.

  • Microsoft photo Microsoft

    Open source projects and samples from Microsoft.

  • Google photo Google

    Google โค๏ธ Open Source for everyone.

  • D3 photo D3

    Data-Driven Documents codes.