Code Monkey home page Code Monkey logo

coroo / nova-chartjs Goto Github PK

View Code? Open in Web Editor NEW
212.0 6.0 71.0 5.18 MB

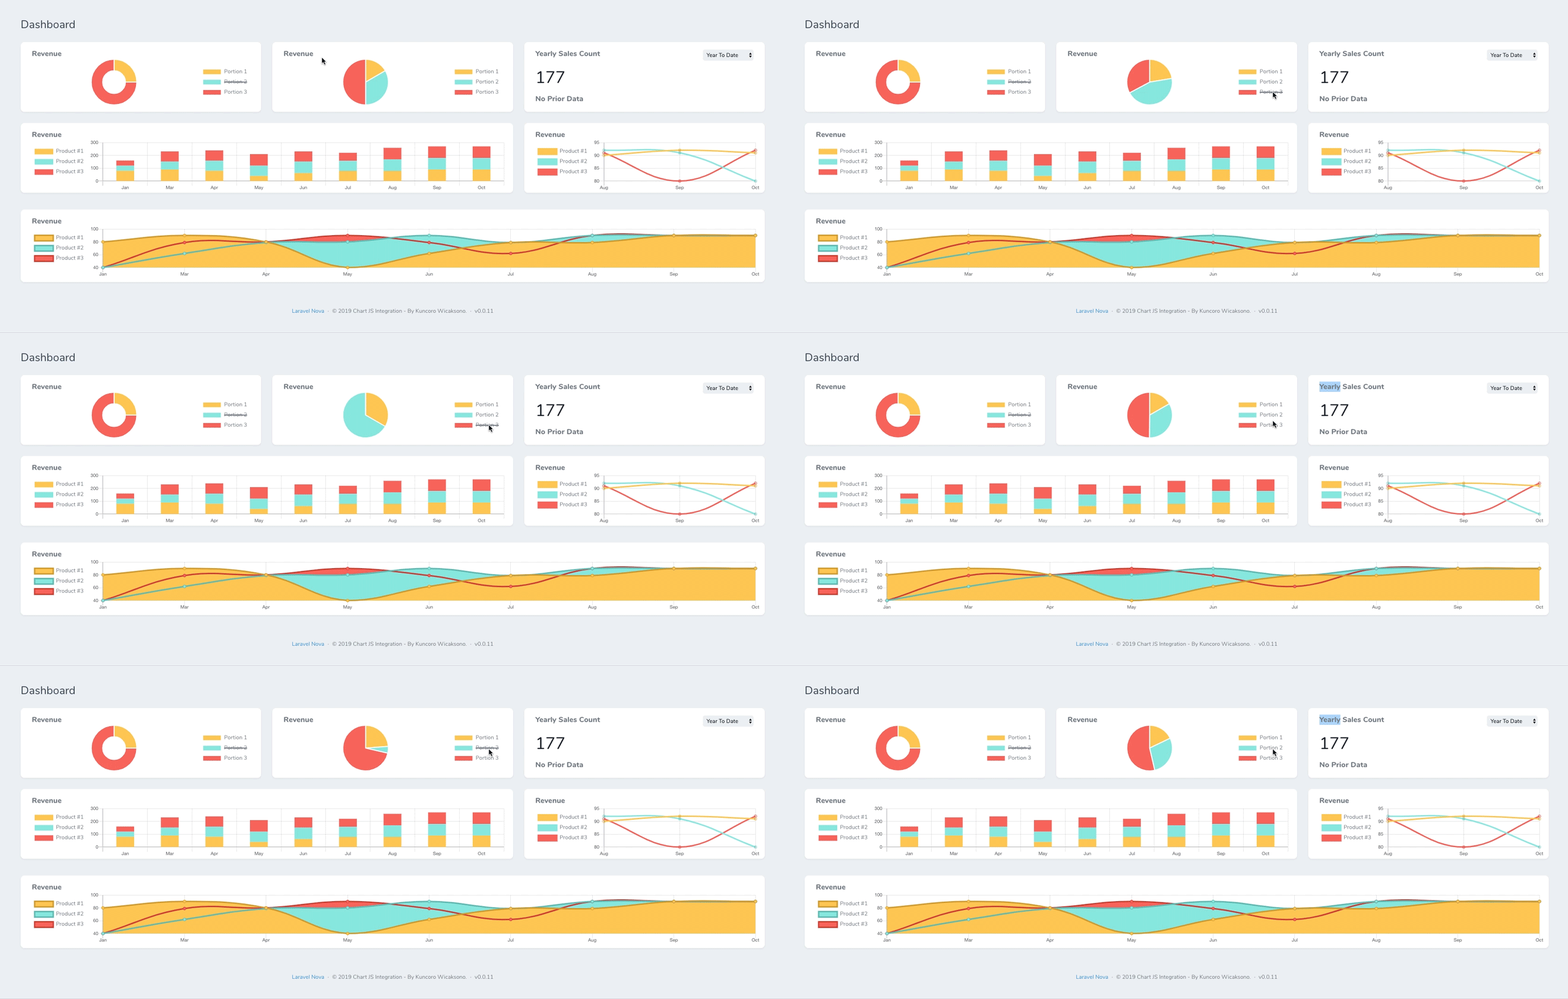
A Simple Dashboard Chart in Laravel Nova using Chart JS. Starting create your own dashboard with Chart JS Integration can save your time and help you maintain consistency across standard elements such as Bar, Stacked, Line, Area, Doughnut and Pie Chart.

Home Page: https://coroo.github.io/nova-chartjs

License: MIT License

JavaScript 1.60% Vue 67.03% PHP 31.37%
chart-js laravel-nova laravel

nova-chartjs's Introduction

Nova ChartJS - Laravel Nova Package

A Laravel Nova Dashboard with Chart JS | See 📘Documentation Page

Note

👋 Welcome to Nova-ChartJS! We believe that great software is built through collaboration, and we invite you to be a part of it. Whether you're a developer, designer, tester, or just someone passionate about the project, there are many ways to contribute.

Click here to contribute!

Chart JS Integration in Action

Continues Integration Latest Version on Packagist Total Downloads License State Status License

Listed in Awesome ChartJS License

Installation & Documentation

🎓 For better experiences, we moved documentation to : https://coroo.github.io/nova-chartjs/

ChangeLog

Please see CHANGELOG for more information on what has changed recently.

License

The MIT License (MIT). Please see License File for more information.

nova-chartjs's People

Contributors

0xb4lint avatar alberto-bottarini avatar bab55z avatar bobdivinity avatar brandonkhj avatar coroo avatar dependabot[bot] avatar dmason30 avatar ltkort avatar nw-b avatar thang12l avatar tobikaleigh avatar

Stargazers

 avatar  avatar  avatar  avatar  avatar  avatar  avatar  avatar  avatar  avatar  avatar  avatar  avatar  avatar  avatar  avatar  avatar  avatar  avatar  avatar  avatar  avatar  avatar  avatar  avatar  avatar  avatar  avatar  avatar  avatar  avatar  avatar  avatar  avatar  avatar  avatar  avatar  avatar  avatar  avatar  avatar  avatar  avatar  avatar  avatar  avatar  avatar  avatar  avatar  avatar  avatar  avatar  avatar  avatar  avatar  avatar  avatar  avatar  avatar  avatar  avatar  avatar  avatar  avatar  avatar  avatar  avatar  avatar  avatar  avatar  avatar  avatar  avatar  avatar  avatar  avatar  avatar  avatar  avatar  avatar  avatar  avatar  avatar  avatar  avatar  avatar  avatar  avatar  avatar  avatar  avatar  avatar  avatar  avatar  avatar  avatar  avatar  avatar  avatar  avatar

Watchers

 avatar  avatar  avatar  avatar  avatar  avatar

nova-chartjs's Issues

How can I make modifications to bar-chart.js

Hi,

I'm trying to change bar-chart.js for debug purpose.

I change it, but I cannot see any changes in my graph.

I went chart-js-integration vendor folder, and ran:

npm install
npm run watch

Both command worked well.

But nothing happens. Am I doing thing right ?

My purpose is to get the scope of what I can do with your plugin, and what I cannot do.

I am not so used to code with VueJS, so, it is a bit difficult.

How to set options attribute of chartjs

Thank you for this great package. I tried to hide the legend or call a callback function to format the label of yaxis. I did follow the instruction in Chartjs document, something like that:

(new BarChart())
    ->title('Expense')
    ->animations([
        'enabled' => true,
        'easing'  => 'easeinout',
    ])
    ->series(array([
        //'barPercentage'   => 1,
        'label'           => 'Average Sales 2',
        'backgroundColor' => '#F87900',
        'data'            => $chartData,
    ]))
    ->options([
        'xaxis'  => [
            'categories' => ['Jan', 'Feb', 'Mar', 'Apr', 'May', 'Jun', 'Jul', 'Aug', 'Sep', 'Oct', 'Nov', 'Dec']
        ],
        'legend' => [
            'display' => false
        ]
    ])
    ->width('2/3'),

But it didn't hide the legend. So does this great package follow the chartjs document or it has a different way to pass value to option attribute?

Pie Chart

As Chart JS Integration’s user,
I need to have pie chart
So that I can have pie chart view

Error work Postgres

I have error
SQLSTATE[42703]: Undefined column: 7 ERROR: column "%b %Y" does not exist LINE 1: select DATE_FORMAT(transactions.created_at, "%b %Y") AS cat

Laravel
Database - Postgres

how do you extract the chart to a card class ?

Sorry if I somehow missed this in the documentation.. I looked for it and couldn't find it. It seems all your examples detail how to insert the chart logic directly into a dashboard's cards() method, but since some of these graphs can be quite big it makes a lot more sense to create a new class for it.

So my question is simple, how can I get one of your examples such as

            (new StackedChart())
            ->title('Revenue')
            ->series([[
                'barPercentage' => 0.5,
                'label' => 'Product #1',
                'backgroundColor' => '#ffcc5c',
                'data' => [30, 70, 80],
            ], [
                'barPercentage' => 0.5,
                'label' => 'Product #2',
                'backgroundColor' => '#ff6f69',
                'data' => [40, 62, 79],
            ]])
            ->options([
                'xaxis' => [
                    'categories' => ['Jan', 'Feb', 'Mar'],
                ],
            ])
            ->width('1/3'),

To run from a different class (that I assume would extend \Laravel\Nova\Card) ?

LineChart defaulting to BarChart visually

Nova: v3.8.4
Laravel: 7.27.0

(new LineChart())
            ->title('Number of Orders By Week')
            ->model('\App\Order')
            ->options(
                [
                    'uom' => 'week', // available in 'day', 'week', 'month', 'hour'
                    'startWeek' => '1',
                    'latestData' => 30
                ])->width('1/2'),

Is displaying a bar chart by default unless I segment with ->series(...). Is there a way to display a single line chart when using ->model(...)? I have a feeling I'm overlooking something quite obvious. 😅

Weekly view error

When adding in the extra weekly option the following error is thrown.

      ->options([
                'latestData' => 6 // in months
                'uom' => 'week' // available in 'week', 'month'
            ])
        ->width('full')
        ->canSee(function ($request) {
            return $request->user()->hasrole('Super Admin|Admin');
        }),
    ];
}

Arguments
"syntax error, unexpected ''uom'' (T_CONSTANT_ENCAPSED_STRING), expecting ']'"

Problems getting charts to display.

I'm using Nova 2.12 and nova-chartjs v 0.2.4. I'm getting js errors.
image
used composer to install, and pasted the code for the chart from the example into the return of the cards method of the NovaServiceProvider Class.

Join Table for API

Since somehow the data is exist in another table, we need to have feature to join table in API with easy configuration.

Migrate from react Chartbar to Nova ChartBar

Hi,

I'm migrating my React app to Laravel Nova. I already have my graph in React, and I am having a hard time to migrate.

Here is React component:

<Bar
        data={data}
        options={{
            legend: {
                labels: {
                    fontColor: "#FFF",
                    fontSize: 18
                },
                fullWidth: true,
                position: "bottom",
                fontColor: "#FFF"
            },
            maintainAspectRatio: false,
            scales: {
                xAxes: [
                    {
                        stacked: true,
                        gridLines: {
                            display: false
                        },
                        scaleLabel: {
                            fontColor: "#FFF"
                        },
                        ticks: {
                            fontColor: "#FFF"
                        }
                    }
                ],
                yAxes: [
                    {
                        scaleLabel: {
                            display: true,
                            labelString: "kWh",
                            fontColor: "#FFF",
                            padding: 0
                        },
                        ticks: {
                            min: 0,
                            fontColor: "#FFF"
                        },
                        gridLines: {
                            color: "rgba(255, 255, 255, 1)"
                        },
                        stacked: true
                    }
                ]
            }
        }}
    />

I tried to convert xAxes but I can't make it work:

->options(
                    [
                        'xaxis' => [
                            // Afficher chaque heure au lieu de chaque demi heure
                            'categories' => $result->map(function ($model) {
                                return Carbon::parse($model->ts)->format('h:i');
                            }),
                        ],
                        
                        'legend' => [
                            'position' => 'bottom'
                        ],
                        'maintainAspectRatio' => 'false',
                        'scales' => [
                            'yAxes' => [
                                'scaleLabel' => [
                                    'display' => true,
                                    'labelString' => "kWh",
                                    'fontColor' => "#FFF",
                                    'padding' => 0
                                ],
                                'ticks' => [
                                    'min' => 0,
                                    'fontColor' => false
                                ],
                                'gridLines' => [
                                    'display' => false
                                ],
                                'stacked' => true,
                            ]
                        ]
                    ]),

it doesn't display the labelString kWh

What should be the logic to migrate ? I can't make the yaxis legend "kWh" appears, I could change background for each serie, but I couldn't find a way to put the chart background in blue, can't find a way to change height, etc.

In short, I'm having a hard time to configure my charts, where I was not expecting to.

Are all the original properties available ? Any logic I could follow to make it smooth?

I'm using Nova 2.x with Laravel 6

Set default backgroundColor and borderColor for custom chart

Normally, when I use the custom chart I need to build a data array. Something like this:

$chartData = [];
        foreach ($report['chartData'] as $key => $item)
        {
            $chartData[] = [
                'barPercentage' => 0.5,
                'label'         => $key,
                'borderColor'   => sprintf('#%06X', mt_rand(0, 0xFFFFFF)),
                'data'          => array_values($item),
            ];
        };

You can see I have to set an extra element with the key borderColor manually to set the color for line chart, otherwise it won't have the color. Would you consider to set the default color for the custom chart.

Thank you!

Tooltip Custom Feature

Hello I am trying to hide the legend for my graph, looks like it not working?
this is in the doc
image
this is what I have in my code
image
and this is what the nova-chartjs produce with legend attached
image

Include on resource pages

Super component thank you!

I just want to request an enhancement - at the moment the cards must be included on a dashboard. It would be great if the cards can be added to a resource (so to include on index or detail view) like the vanilla Nova metric cards.

Please don't add fontawesome inline

Please, remove the fontawesome inside the component that destroys any other use of fontawesome pro.
https://use.fontawesome.com/releases/v5.2.0/css/all.css should not be placed inline in any case...

Scatter Chart

As Chart JS Integration’s user,
I need to have Scatter chart
So that I can combine an Area + Scatter chart

Connect to Database

In Laravel Nova, they usually use metrics to show the value or chart of data. In this plugin, I still wondering how the best practice to connect the chart with the data / model.

So If you have any suggestion or you want to help me reach the solution for it, please don't be hesitate to fork this repo.

Cheers.

How to cancel the cache?

Hi, I found that the statistics are not up to date every time, and the page needs to be refreshed. Is this the reason for caching?

Weekly Basis View

As Chart JS Integration User,
I need to have weekly basis view instead of monthly basis view
So that I can monitor my chart by weekly.

how to control the cache? Is there a cacheFor method?

It's unclear whether the chart data is cached or if we need to handle the caching ourselves. And in the event that we use the 'refresh' button is there some kind of callback where we can invalidate our own cache?

Ideally it would be great if you implemented a cacheFor() method similar to how Nova Trend Metrics does it. And then your refresh button could also handle invalidating the cache.

For example:

public function cacheFor()
{
    return now()->addMinutes(5);
}

https://nova.laravel.com/docs/3.0/metrics/defining-metrics.html#caching

Support for Nova 1.*

Is there any technical reason why this package does not support the Nova 1.* version?

Daily Base View

As Chart JS Integration User,
I need to have daily base view instead of weekly or monthly base view
So that I can monitor my chart by daily.

Refresh button for custom chart.

How can I use the refresh button for a custom chart? It seems like work with only Laravel Data Model chart.

I cache my chart data. It would be great if the refresh button can fire an event to delete cache or something else.

Thank you so much!

Clicking on metrics to refresh/reload charts

First of all, thanks for putting your time developing this amazing integration.

My use case is having more than one metrics which could be total visitors, new visitors, etc as the first panel and clicking on any of them would drill down a collection of charts below as the second panel, and all charts in the second panel should be refreshed/reloaded accordingly while clicking around the metric in the first panel.

I don't know if it is feasible in Nova. Maybe it's not the correct place to ask this question. Kindly close it, if it's not related.

How to stack bars over each other

By default a stacked bar chart adds all values. According to the documentation to overlap the values a configuration like this is needed:

var stackedBar = new Chart(ctx, {
    type: 'bar',
    data: data,
    options: {
        scales: {
            xAxes: [{
                stacked: true
            }],
            yAxes: [{
                stacked: true
            }]
        }
    }
});

How would I enter this config into nova-chartjs?

Unable to set fill for linechart

Fill is always set to false in code here

I can understand that you would like to default this to false but I would not forcefully overwrite when a developer sets the option to true.

Polar Chart

As Chart JS Integration’s user,
I need to have polar chart
So that I can have polar chart view

Vendor issue

I changed the StackedChart instead of BarChart and the Chart stays blank.
I caught this issue via the dev console in Chrome.
Wondered if you have come across this?

screenshot_3951

Doughnut Chart

As Chart JS Integration’s user,
I need to have Doughnut chart
So that I can have Doughnut chart view

Table Prefix Ignored on Model

I have a table prefix set in in my database configuration, i.e. config('database.connections.mysql.prefix'), but it is not honored by your package's select statement when using Laravel models with ->model($model_class), leading me to errors like:

SQLSTATE[42S22]: Column not found: 1054 Unknown column 'testtable.created_at' in 'field list' 

(SQL: select DATE_FORMAT(testtable.created_at, "%b %Y") AS cat, 
DATE_FORMAT(testtable.created_at, "%Y-%m") AS catorder, sum(1) counted 
from `myprefix_testtable` where `myprefix_testtable`.`created_at` >= 2020-05-01 00:00:00....

The model has "testtable" set as the $table property, but in the database, the table is named myprefix_testtable, which Laravel resolves from the prefix being set to "myprefix_" in the config/database.php connection config.

Thanks for looking into this!

Radar Chart

As Chart JS Integration’s user,
I need to have radar chart
So that I can have a radar chart view

Chart Title is not styled well

Hi @coroo,

I tried this awesome chart js for nova package 👍,
but there is a minor issue, the title is not aligned/styled well.

I'm using nova with default style, here is the screenshot of my stacked chart.

Screen Shot 2019-12-20 at 17 48 31

Is there any way to fix this? Thank you

Chartjs doesn't work on HTTPS

ChartJS only loads from model when using HTTP instead of HTTPS. If I push the code to the server. I have both production and local applications on that server. It appears blank in both. Though in developer tools I see that it is blocked because it is doing the request as HTTP.

I realise this because if I intentionally miss-type the model route on localhost it would produce an error. On the server it won't show any error. It just appears blank.

           (new StackedChart())
            ->title('Totalbeds')
            ->model('\App\Model\Hotel\Room') // Use Your Model Here
            ->series(array([
                'label' => 'Location 1',
                'filter' => [
                    'key' => 'id', // State Column for Count Calculation Here
                    'value' => '1'
            ],
            ]
            ))
            ->options([
                'sum' => 'totalbeds' // Add the column you want to calculate
            ])
            ->width('2/3'),

I think the issue is over HTTPS

Mixed Content: The page at [URL] was loaded over HTTPS, but requested an insecure XMLHttpRequest endpoint 'http://url.com/coroowicaksono/check-data/endpoint?model=%5CApp%5CModel%5CMaintenance%5CRoom&series[]=%7B%22label%22:%22location1+Camp%22,%22filter%22:%7B%22key%22:%22location_id%22,%22value%22:%221%22%7D%7D&series[]=%7B%22label%22:%22location2+Camp%22,%22filter%22:%7B%22key%22:%22location_id%22,%22value%22:%222%22%7D,%22sweetAlert2%22:%7B%22linkTo%22:%22https:%2F%2Fwww.google.com%22%7D%7D&options=%7B%22sum%22:%22available%22,%22btnRefresh%22:true,%22xaxis%22:%7B%22locations%22:[%22location1+Camp%22,%22location2+Camp%22]%7D,%22sweetAlert2%22:%7B%22linkTo%22:%22https:%2F%2Fwww.url.com%2Fportal%2Fresources%2Frooms%22%7D%7D&expires=0'. This request has been blocked; the content must be served over HTTPS.

Bubble Chart

As Chart JS Integration’s user,
I need to have Buble chart
So that I can have Buble chart view

Error after update to v0.0.9

  • Updating coroowicaksono/chart-js-integration (v0.0.6 => v0.0.9): Downloading (100%)

Receive undefined property: stdClass::$fill

p.s
is there anyway to get the charts to show weekly stats as opposed top monthly?

UOM as hour

For a realtime monitor, I would like to split record using hour instead of days.
It will be possible?

Percentage in Legend

So we need to have percentage in legend.

e.g, so if total is 118,
Avg sales 1 = (23 19.49%)
Avg sales 2 = (50 42.37%)
Avg sales 3 = (27 22.88%)
Avg sales 4 = (18 15.25%)

Maybe they could be rounded up.

charts not showing

I'm running Laravel Nova v2.12.0 and nova-chartjs v0.2.3

I'm following the instructions in the getting started section at https://coroo.github.io/nova-chartjs/#/?id=getting-started

When I add the StackedChart example and load the dashboard, I do not see any chart display, and when I look at the source, I see the following:

<stacked-chart card="[object Object]" lens="" class="card-panel"></stacked-chart>

cart="[object Object]" doesn't seem right. Is it?

Regardless, I cannot get charts to show at all.

how to disable autorefresh?

click any resource.
"NovaServiceProvider" return "Cards", and nova-chartsjs will draw again, it waste time too much

Recommend Projects

  • React photo React

    A declarative, efficient, and flexible JavaScript library for building user interfaces.

  • Vue.js photo Vue.js

    🖖 Vue.js is a progressive, incrementally-adoptable JavaScript framework for building UI on the web.

  • Typescript photo Typescript

    TypeScript is a superset of JavaScript that compiles to clean JavaScript output.

  • TensorFlow photo TensorFlow

    An Open Source Machine Learning Framework for Everyone

  • Django photo Django

    The Web framework for perfectionists with deadlines.

  • D3 photo D3

    Bring data to life with SVG, Canvas and HTML. 📊📈🎉

Recommend Topics

  • javascript

    JavaScript (JS) is a lightweight interpreted programming language with first-class functions.

  • web

    Some thing interesting about web. New door for the world.

  • server

    A server is a program made to process requests and deliver data to clients.

  • Machine learning

    Machine learning is a way of modeling and interpreting data that allows a piece of software to respond intelligently.

  • Game

    Some thing interesting about game, make everyone happy.

Recommend Org

  • Facebook photo Facebook

    We are working to build community through open source technology. NB: members must have two-factor auth.

  • Microsoft photo Microsoft

    Open source projects and samples from Microsoft.

  • Google photo Google

    Google ❤️ Open Source for everyone.

  • D3 photo D3

    Data-Driven Documents codes.