A RRIQA Model of Computer Vision
This is a Reduced-Reference Sharpness-aided model of Entropy combined with Color moment for natural Image Quality Assessment(NIQA), shortend as RSECIQA.
Image quality is the core value of image system. In addition, it is also about the highest level of image system technology. However, the lossy compression, acquisition and transmission of images can easily lead to the problem of image quality degradation. For example, in the process of image capture, the jitter of mechanical system, the focus blur of optical system and the thermal noise of electronic system will cause the image not clear enough; in the process of image storage and transmission, due to the contradiction between the huge amount of data and the limited communication bandwidth, the image needs to be lossy compressed, which will also lead to ringing effect, blur effect and block effect The appearance of degradation phenomenon. Therefore, it can be said that image degradation occurs frequently at all levels of the image system, and it is very important and meaningful to make corresponding objective evaluation of image quality. In order to meet the user's requirements for image quality in various applications, and facilitate developers to maintain, control and strengthen image quality, image quality assessment (IQA) is a technology to identify and quantify the degradation of image quality. It has always been an extremely important and indispensable task in the field of image processing. Image perceptual hashing is a branch of Perceptual Hashing. It generates a short summary by extracting and compressing the image perceptual features, which is used to record or identify the image content, or further to identify the degradation of image content and quality. In the field of image quality evaluation, especially in the field of reduced reference IQA, it has broad application prospects.
Generally speaking Image Quantity Assessment is divided into two catagories: natural image(NI) quality assessement(QA) and screen content image(SCI) quality assessment. According to the method used, QA can be divided into full reference(FR), reduced reference(RR) and no reference(NR). Each method includes manual based method and learning based method. The original reference image can be obtained by the full reference method, and the degraded image quality can be evaluated by completely known conditions. In practical application, the FR algorithm needs to obtain the original reference image, and occupies the highest system resources, which undoubtedly has the highest requirements for the use conditions. NR image quality assessment is also called blind image quality assessment. It does not need any information of the original reference image when evaluating the quality of degraded image. Therefore, it is difficult to design a NRIQA algorithm. At the receiving end of the communication network, the original image data cannot be obtained, so the FR method cannot be used. At the same time, because most of the current NR methods based on machine learning are mainly designed for specific applications, it is difficult to describe the impact of complex network communication process on image quality, and it is not suitable to use NRIQA in communication network. Relatively speaking, the RRIQA used in this model represents a more practical method, providing a solution between FR and NR. RRIQA can describe the visual degradation of image data in the process of complex network communication. It is designed to use part of the reference image information for IQA, without the original pixel level information.
FR, RR or NR for NIs or SCIs can be refered as objective IQA, which belongs to computer vision, Compared with subjective IQA, when the physiological experiments must be conducted.
Windows 10 64bits + VS2019 + OpenCV3.4.1 + Matlab R2019a
In the experiment, tid2008 and tid2013 image databases were selected.
dataset reference image distorted image distortion types observers
TID2008 25 1700 17 838
TID2013 25 3000 24 971
Put the image data set in the working directory. Then Change the value of DBS in the program to the name of currently used image dataset(TID2013 or TID2008); change the data_Path to the path of currently used dataset(TID2013 or TID2008).
Run the C++ program and click "test" in the pop-up dialog box. The program will automatically collect the images in the current dataset and make quality score prediction.
For ONE reference image and the corresponding distorted images,
-
Resize
resize(RefImg, org, Size(NORM_WIDTH, NORM_HEIGHT), 0, 0, INTER_LINEAR);
resize(DisImg, dis, Size(NORM_WIDTH, NORM_HEIGHT), 0, 0, INTER_LINEAR); -
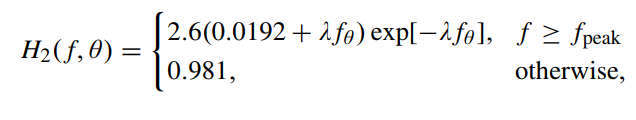
Contrast Sensitivity Function(CSF) filtering, Considering that the human visual system(HVS) plays a decisive role in subjective perception. Contrast Sensitivity Function can measure the sensitivity of HVS to various visual stimulus frequencies. It reflects that the human eye's discrimination of target brightness is different at different spatial frequencies.
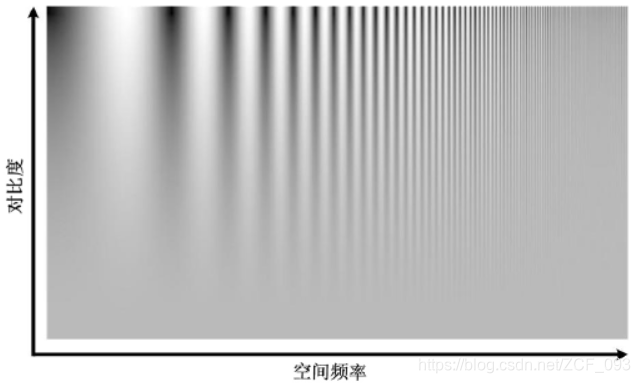
This project uses a CSF model proposed by mannos and sakrison and improved by Daly CSF formula(https://img-blog.csdnimg.cn/20201031204751439.png) CSF model(https://img-blog.csdnimg.cn/20201101172517722.png?x-oss-process=image/watermark,type_ZmFuZ3poZW5naGVpdGk,shadow_10,text_aHR0cHM6Ly9ibG9nLmNzZG4ubmV0L1pDRl8wOTM=,size_16,color_FFFFFF,t_70) CSF filtering(https://img-blog.csdnimg.cn/20201101175521365.png?x-oss-process=image/watermark,type_ZmFuZ3poZW5naGVpdGk,shadow_10,text_aHR0cHM6Ly9ibG9nLmNzZG4ubmV0L1pDRl8wOTM=,size_16,color_FFFFFF,t_70)
-
Edge Dectecion
RGm = pTest->cia->Img_Gradient_Map(RefSal);
DGm = pTest->cia->Img_Gradient_Map(DisSal);
RGm.convertTo(R_W, CV_8UC1, 255.0);
DGm.convertTo(D_W, CV_8UC1, 255.0); -
Block DCT transform and Reorganize
pTest->cia->BGRBlkDCT(R_W, RDCTArray);
pTest->cia->BGRBlkDCT(D_W, DisRDCTArray);
std::vector rd = pTest->cia->dct10subbands(RDCTArray, RDCT, RDCT1);
std::vector dd = pTest->cia->dct10subbands(DisRDCTArray, DisRDCT, DisRDCT1); -
Calculate Entropy of 10 Subbands. The result of a image contains 10 coefficients.
for (int k = 0; k < 10; k++) {
double rntrpy = 0.0, dntrpy = 0.0;
double rhist[256] = { 0.0 };
double dhist[256] = { 0.0 };
Mat Rt, Dt, RDW, DDW;
normalize(rd[k], Rt, 0.0, 256.0, NORM_MINMAX);
normalize(dd[k], Dt, 0.0, 256.0, NORM_MINMAX);
Rt.convertTo(RDW, CV_16UC1);
Dt.convertTo(DDW, CV_16UC1);
for (int i = 0; i < DDW.rows; i++) {
const short* data1 = RDW.ptr(i);
const short* data2 = DDW.ptr(i);
for (int j = 0; j < DDW.cols; j++) {
rhist[data1[j]]++;
dhist[data2[j]]++;
}
}
for (int i = 0; i < 256; i++) {
rhist[i] /= (RDW.rows * RDW.cols);
dhist[i] /= (DDW.rows * DDW.cols);
}
for (int i = 0; i < 256; i++) {
rntrpy += (-rhist[i] * (log2(1 + rhist[i])));
dntrpy += (-dhist[i] * (log2(1 + dhist[i])));
}
rtrpy[k] = rntrpy;
dtrpy[k] = dntrpy;
} -
Calculate Sharpness. The result of a image contains one coefficient. The Tenegrad function is used to calculate the sharpness value.
ap = pTest->cia->TenengradMeasure(ap, RefImg);
ad = pTest->cia->TenengradMeasure(ad, DisImg); -
Calculate the 1, 2, 3 Order Color moment. The result of a image contains 9 coefficients. Thus a image is now represented by a 20 dimensional vector.
pTest->cia->ColorMomentRef(RefImg, Mom1);
pTest->cia->ColorMomentRef(DisImg, Mom2); -
After receiving the distorted image and its feature vector A at the receiver, the program extracts feature vector B of the distorted image and compare the distance between A and B. Finally, the distance after standardization and nonlinear mapping is the quality score of the distorted image.
double a = 0.05 × sqrt(ABS(ap - ad));
for (int i = 0; i < 10; i++) b += ABS(rtrpy[i] - dtrpy[i]);
double c = 1 / exp(sqrt(sqrt(ABS(1 - (Mom1[0] + Mom1[1] + Mom1[2] + Mom1[3] + Mom1[4] + Mom1[5] + Mom1[6] + Mom1[7] + Mom1[8]) / 9))));
double score = 9 / (1 + log2(1 + a)) × b × c;
After the prediction is finished, the quality score (predicted value) and real score (real value) files are generated. Result evaluation was then carried out in MATLAB R2019a. PLCC can reflect the accuracy of objective algorithm, while SROCC is used to evaluate the monotonicity of objective models. The two groups of data to be compared need to be nonlinear fitted before PLCC calculation.
The results are compared with the experimental results of other RRIQA method on TID2013. It can be seen that RSECIQA achieves high performance with the least number of RR features.
IQA Method RR-features SROCC PLCC
RSECIQA 20 0.5626 0.5948
RR-SSIM 36 0.5526 0.5842
RRED 342≤ImageSize/576 0.5942 0.5637
SPCRM-SCHARR 32 0.5202 0.5313


