Code Monkey home page Code Monkey logo

kangas's Introduction


PyPI version GitHub Kangas Live Demo Kangas Documentation Downloads DOI

Kangas: Explore Multimedia Datasets at Scale ๐Ÿฆ˜

Kangas is a tool for exploring, analyzing, and visualizing large-scale multimedia data. It provides a straightforward Python API for logging large tables of data, along with an intuitive visual interface for performing complex queries against your dataset.

The key features of Kangas include:

  • Scalability. Kangas DataGrid, the fundamental class for representing datasets, can easily store millions of rows of data.
  • Performance. Group, sort, and filter across millions of data points in seconds with a simple, fast UI.
  • Interoperability. Any data, any environment. Kangas can run in a notebook or as a standalone app, both locally and remotely.
  • Integrated computer vision support. Visualize and filter bounding boxes, labels, and metadata without any extra setup.

You can access a live demo of Kangas at kangas.comet.com.

Getting Started

Kangas is accessible as a Python library via pip

pip install kangas

Once installed, there are many ways to load or create a DataGrid.

Without writing any code, you can even download a DataGrid and begin exploring the data. At the console:

kangas server https://github.com/caleb-kaiser/kangas_examples/raw/master/coco-500.datagrid.zip

That's it!

In the next example, we load a publicly available DataGrid file, but the Kangas API also provides methods for ingesting CSVs, Pandas DataFrames, and for manually constructing a new DataGrid:

import kangas as kg

# Load an existing DataGrid
dg = kg.read_datagrid("https://github.com/caleb-kaiser/kangas_examples/raw/master/coco-500.datagrid.zip")

After your DataGrid is initialized, you can render it within the Kangas Viewer directly from Python:

dg.show()

image

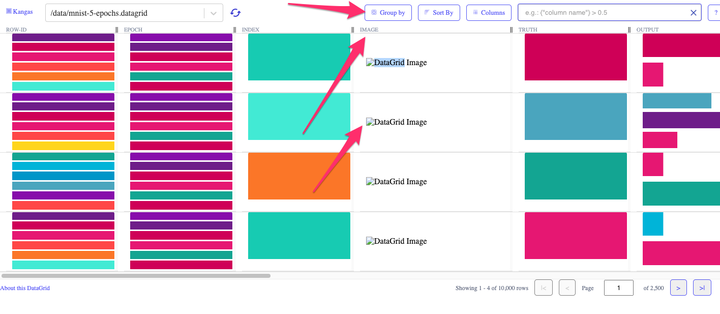
From the Kangas Viewer, you can group, sort, and filter data. In addition, Kangas will do its best to parse any metadata attached to your assets. For example, if you're using the COCO-500 DataGrid from the quickstart above, Kangas will automatically parse labels and scores for each image:

And voilร ! Now you're started using Kangas.

Pandas DataFrames

Kangas can also read Pandas DataFrame objects directly:

import kangas as kg
import pandas as pd

df = pd.DataFrame({"hidden_layer_size": [8, 16, 64], "loss": [0.97, 0.53, 0.12]})
dg = kg.read_dataframe(df)

HuggingFace Datasets

HuggingFace's datasets can also be loaded into DataGrid directly because they use rows of dictionaries, and images are represented by PIL images. DataGrid will automatically convert PIL images into a Kangas Image:

import kangas as kg
from datasets import load_dataset

dataset = load_dataset("beans", split="train")
dg = kg.DataGrid(dataset)

Parquet files

Note: You will need to have pyarrow installed to read parquet files.

import kangas as kg

dg = kg.read_parquet("https://github.com/Teradata/kylo/raw/master/samples/sample-data/parquet/userdata5.parquet")

If you'd like to explore further, take a look at our example notebooks below:

Documentation

  1. Documentation Homepage
  2. Quickstart Notebook
  3. Integrations Notebook
  4. MNIST Classification Example

FAQ

Is Kangas ready for public use?

Kangas is currently in an open beta. We stress test Kangas heavily and often, and are confident in sharing with the public. That being said, it is a very young project, and there will be bugs and rough edges. Additionally, new features will be added at a fast pace, so if you find a bug or have a request, please do not hesitate to open a ticket or start a discussion.

Does Kangas support _____ system?

Kangas can be run as a standalone application on newer versions of Windows, MacOS, and most popular Linux distributions. In addition, Kangas can run remotely via Google Colab, or within any Jupyter notebook environment.

When should I use Kangas instead of _____?

Pandas

Kangas and Pandas are complimentary tools. When you've wrangled your data into a Pandas DataFrame, Kangas can ingest that DataFrame via the DataGrid.read_dataframe() method, making it easy to visualize and explore your tabular data. Additionally, if your data is too large to process in Pandas or involves multimedia assets, Kangas is a strong alternative.

Tensorboard

TensorBoard is one of several tools (including Kangas parent organization, Comet that specializes in experiment management and monitoring). Like Kangas, it provides charting and visualizations out of the box, but is specifically designed for analyzing training workflows. Kangas, in contrast, is designed to analyze any dataset. For example, even if you use a tool like TensorBoard for analyzing training runs, you may still use Kangas before training for exploratory data analysis, or for prediction analysis post-deployment.

What is Kangas relationship with Comet?

Kangas is developed and maintained by the Research team at Comet. It began life as a prototype for Comet users who needed to visualize large computer vision datasets, and was later spun out into a standalone open source project. Kangas is and always will be free and open source software, and we are more than happy to accept community contributions.

Contributing

Kangas has only recently been released, and as such, we don't have much of a formal process for contributions. If you have an idea or would like to make a contribution, we recommend opening a ticket describing your proposed contribution so that we can collaborate directly. We love working with community contributors.

kangas's People

Contributors

caleb-kaiser avatar dn6 avatar dsblank avatar ja-bot avatar marksmayo avatar neokish avatar nerdyespresso avatar sherpan avatar

Stargazers

 avatar  avatar  avatar  avatar  avatar  avatar  avatar  avatar  avatar  avatar  avatar  avatar  avatar  avatar  avatar  avatar  avatar  avatar  avatar  avatar  avatar  avatar  avatar  avatar  avatar  avatar  avatar  avatar  avatar  avatar  avatar  avatar  avatar  avatar  avatar  avatar  avatar  avatar  avatar  avatar  avatar  avatar  avatar  avatar  avatar  avatar  avatar  avatar  avatar  avatar  avatar  avatar  avatar  avatar  avatar  avatar  avatar  avatar  avatar  avatar  avatar  avatar  avatar  avatar  avatar  avatar  avatar  avatar  avatar  avatar  avatar  avatar  avatar  avatar  avatar  avatar  avatar  avatar  avatar  avatar  avatar  avatar  avatar  avatar  avatar  avatar  avatar  avatar  avatar  avatar  avatar  avatar  avatar  avatar  avatar  avatar  avatar  avatar  avatar  avatar

Watchers

 avatar  avatar  avatar  avatar  avatar  avatar  avatar  avatar  avatar  avatar  avatar

kangas's Issues

Metadata collection

Kangas, by default on each startup, sends metadata to Comet:

  • OS version
  • Kernel information
  • Python / Node version

Basically metadata collection concealed as version check. A real version check would e.g use the Github API to fetch the latest tag.

package = {
"user_id": "Anonymous",
"event_type": "kangas_version_check",
"event_properties": {
"license_key": "NA",
"kangas_session_uuid": get_session_id(),
"kangas_version": __version__,
"os_version": "%s %s %s"
% (platform.system(), platform.release(), platform.version()),
"os_details": "%s (%s)" % (sys.platform, platform.platform()),
"env": env,
"python_version": platform.python_version(),
"node_version": get_node_version(),
},
}
headers = {"Content-Type": "application/json"}
try:
response = requests.request( # noqa
"POST",
"https://stats.comet.com/notify/event/",
json=package,
headers=headers,
)
return False # response.status_code != 200 # FIXME

Grouping by image asset results in broken thumbnail - 2.0

If you group by an image asset in Kangas 2.0, the cell generates a broken image:

image

We have a bug in our cell parsing logic, by which these cells are still being treated as groups when they should be treated as individual values.

object of type Progressbar has no len()

Thanks for the great library.

I installed kangas using:

pip install kangas

I then tried running the tutorial: Integrations.ipynb

When I run:

dg = kg.read_dataframe(df)

I get the following error:

image

I am using version: 2.2.4.

Any ideas on how to solve this?

Cannot run dg.show() in jupyter notebook

Hi,

When I try to run these scripts in Google Colab

import kangas as kg
# Load an existing DataGrid dg = kg.read_datagrid("https://github.com/caleb-kaiser/kangas_examples/raw/master/coco-500.datagrid.zip")

dg.show()

image

The UI run as expected. However, when I tried to run in Jupyter envonment, it show nothing but a black background.

Do you happen to know which caused this issue??

Khai Nguyen

Kangas does not open table in Kaggle

I am working with Kangas locally and there everything works fine!
Exploring Kangas on Kaggle in a notebook, I had some issues.
When creating the dg table, I get the same column with images, with each image having this format <Image, asset_id='ae968db163e54bddb007609acd50c718'> . So this looks fine.
But when using dg.show() to start an user interface, I only get a blank screen. I verified that the column that refers to image files only contains .jpg images.
Should this work or is it not possible to view these images in Kangas on a webbased platform like Kaggle?
Thank you very much in advance for your help!
Ruthger Righart

Ability to display more than 10 rows in datagrid.show()?

Hello! Myself and some others are interested in using kangas for image modeling projects. Is there a way to display more rows in the datagrid.show() UI without flipping pages? The page flips are quick but some of us would prefer to scroll longer, especially when reviewing many images for long periods. Thanks!

[feature request] add more flexibility and interaction to the visualisation

It seems that currently the visualisation is static and we really can't change the column widths in the browser. It would be great to have this for columns having text exceeding the default column width and for images which appear too small. I know that upon clicking we can see the full size and text, but this is a little inconvenient. Also, you could add support for arrow keys so that we can move to the next row image if we are browsing the DataGrid. Other things like buttons for next pages can be added. I believe that we currently need to input page number in the text box. Also no. of samples to show per page can be added. All these can be added to something like settings of the current view.

As you can see below, we cannot see the image clearly, so resizable column width would be really helpful.

image

Auto-resize or widen individual image viewer

From the front end, when I click on an individual image to view it close-up and zoom, I sometimes need to scroll left-right or up-down to see the whole zoomed-in image.

Is there a way to auto-resize when I zoom so that I don't need to scroll? Or to make the viewer window taller and wider?

I keep getting an application error when running from the cmdline

Application error: a client-side exception has occurred (see the browser console for more information).

Error: An error occurred in the Server Components render. The specific message is omitted in production builds to avoid leaking sensitive details. A digest property is included on this error instance which may provide additional details about the nature of the error.

Arrows to next image row/column from individual image viewer

When I'm in the front end viewer for individual images, I'd like to be able to quickly switch to the image in the next row or column (if multiple image columns) without needing to close the viewer and then click the image I want.

Is there a way to add left/right and up/down arrows, or hotkeys to enable this? It would be great if the zoom settings are maintained when switching images, too.

Refresh hangs when scrolled past ssr boundary

If a user performs a group by, triggering hybrid rendering, then scrolls outside of the SSR boundary and clicks the refresh button, Kangas hangs.

I suspect this is due to the refresh button not triggering an update in the boundary and begin params.

Recommend Projects

  • React photo React

    A declarative, efficient, and flexible JavaScript library for building user interfaces.

  • Vue.js photo Vue.js

    ๐Ÿ–– Vue.js is a progressive, incrementally-adoptable JavaScript framework for building UI on the web.

  • Typescript photo Typescript

    TypeScript is a superset of JavaScript that compiles to clean JavaScript output.

  • TensorFlow photo TensorFlow

    An Open Source Machine Learning Framework for Everyone

  • Django photo Django

    The Web framework for perfectionists with deadlines.

  • D3 photo D3

    Bring data to life with SVG, Canvas and HTML. ๐Ÿ“Š๐Ÿ“ˆ๐ŸŽ‰

Recommend Topics

  • javascript

    JavaScript (JS) is a lightweight interpreted programming language with first-class functions.

  • web

    Some thing interesting about web. New door for the world.

  • server

    A server is a program made to process requests and deliver data to clients.

  • Machine learning

    Machine learning is a way of modeling and interpreting data that allows a piece of software to respond intelligently.

  • Game

    Some thing interesting about game, make everyone happy.

Recommend Org

  • Facebook photo Facebook

    We are working to build community through open source technology. NB: members must have two-factor auth.

  • Microsoft photo Microsoft

    Open source projects and samples from Microsoft.

  • Google photo Google

    Google โค๏ธ Open Source for everyone.

  • D3 photo D3

    Data-Driven Documents codes.