


This project was bootstrapped with Create React App.
- You need to download
docker-compose.ymland have a carml config file called.carml_config.ymlunder your home directory. An example config file is incarml_config.yml.example. You can rename it and use that. - Do
docker-compose run(with docker daemon running). It might take a while to download all the docker images. - The website is up on
localhost:8088.
The docker-compose file also sets up the following containers:
- Jaeger (tracing)
http://<host-ip>:16686 - Consul (kv)
http://<host-ip>:8500 - Minio (store)
http://<host-ip>:9030 - Graylog (logging)
http://<host-ip>:9010 - Prometheus (metrics database)
http://<host-ip>:9090 - AlertManager (alerts management)
http://<host-ip>:9093 - Grafana (visualize metrics)
http://<host-ip>:6000 - NodeExporter (host metrics collector)
- cAdvisor (containers metrics collector)
Navigate to http://<host-ip>:6000 and login with user admin password changeme. You can change the password from Grafana UI or
by modifying the environment variables.
From the Grafana menu, choose Data Sources and click on Add Data Source. Use the following values to add the Prometheus container as data source:
- Name: Prometheus
- Type: Prometheus
- Url: http://prometheus:9090
- Access: proxy
Now you can import the dashboard temples from the grafana directory. From the Grafana menu, choose Dashboards and click on Import.
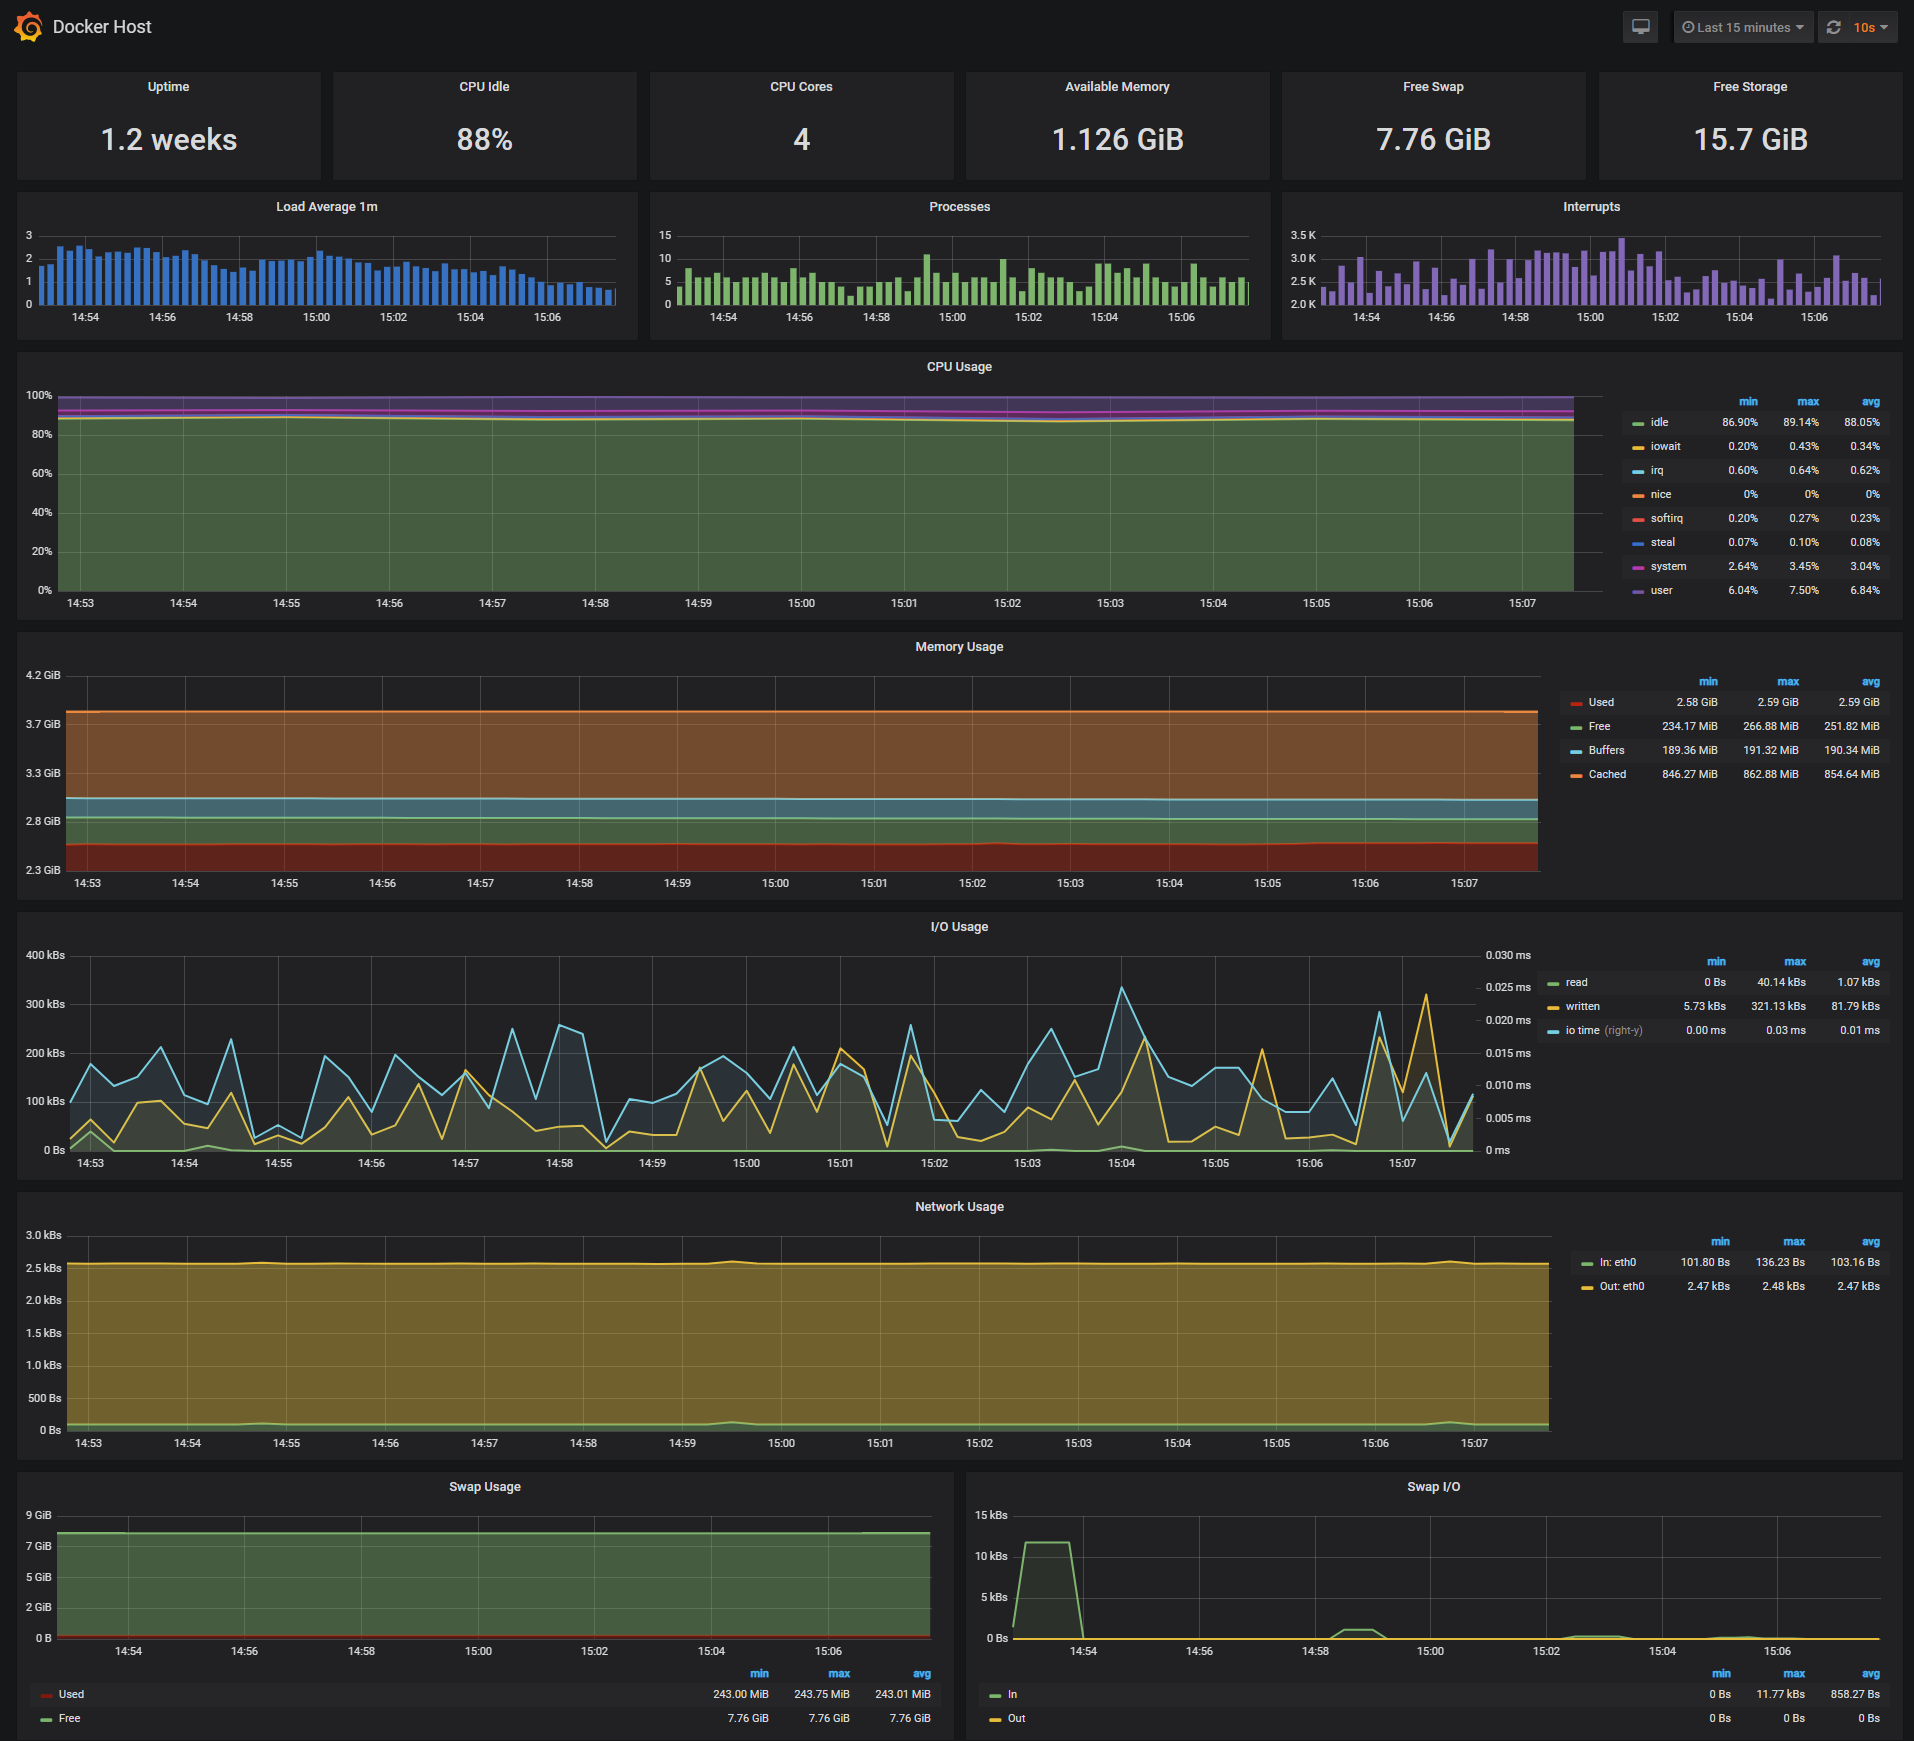
The Docker Host Dashboard shows key metrics for monitoring the resource usage of your server:
- Server uptime, CPU idle percent, number of CPU cores, available memory, swap and storage
- System load average graph, running and blocked by IO processes graph, interrupts graph
- CPU usage graph by mode (guest, idle, iowait, irq, nice, softirq, steal, system, user)
- Memory usage graph by distribution (used, free, buffers, cached)
- IO usage graph (read Bps, read Bps and IO time)
- Network usage graph by device (inbound Bps, Outbound Bps)
- Swap usage and activity graphs
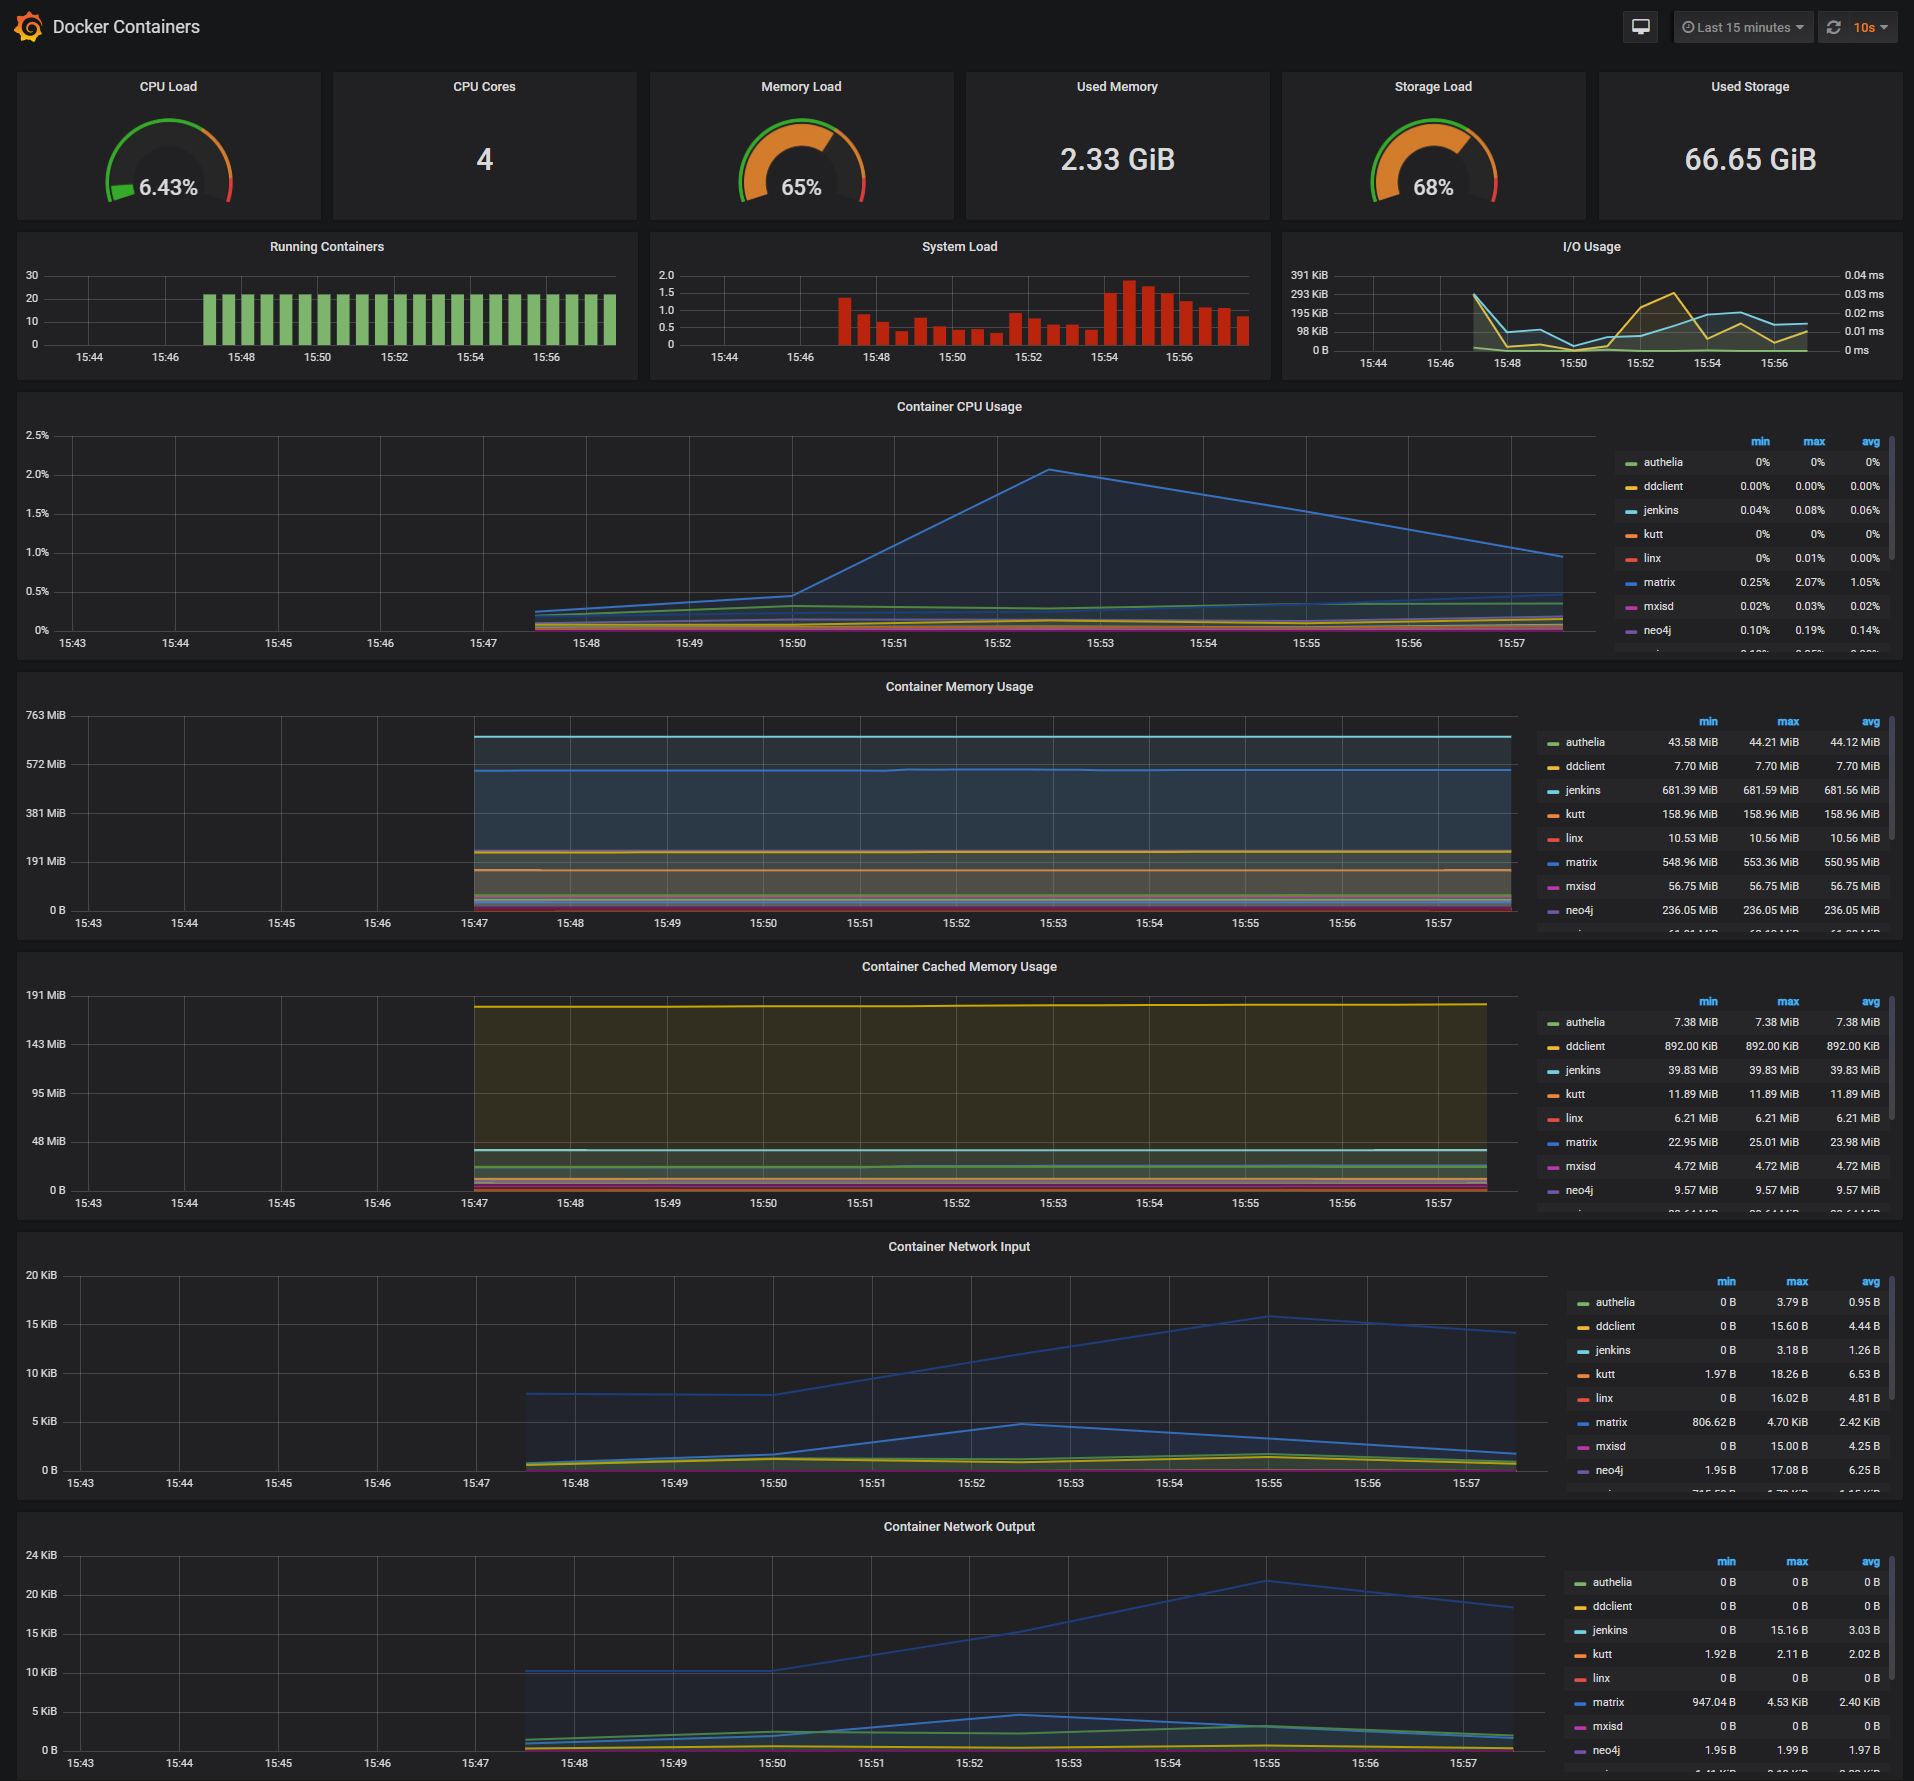
The Docker Containers Dashboard shows key metrics for monitoring running containers:
- Total containers CPU load, memory and storage usage
- Running containers graph, system load graph, IO usage graph
- Container CPU usage graph
- Container memory usage graph
- Container cached memory usage graph
- Container network inbound usage graph
- Container network outbound usage graph
Note that this dashboard doesn't show the containers that are part of the monitoring stack.
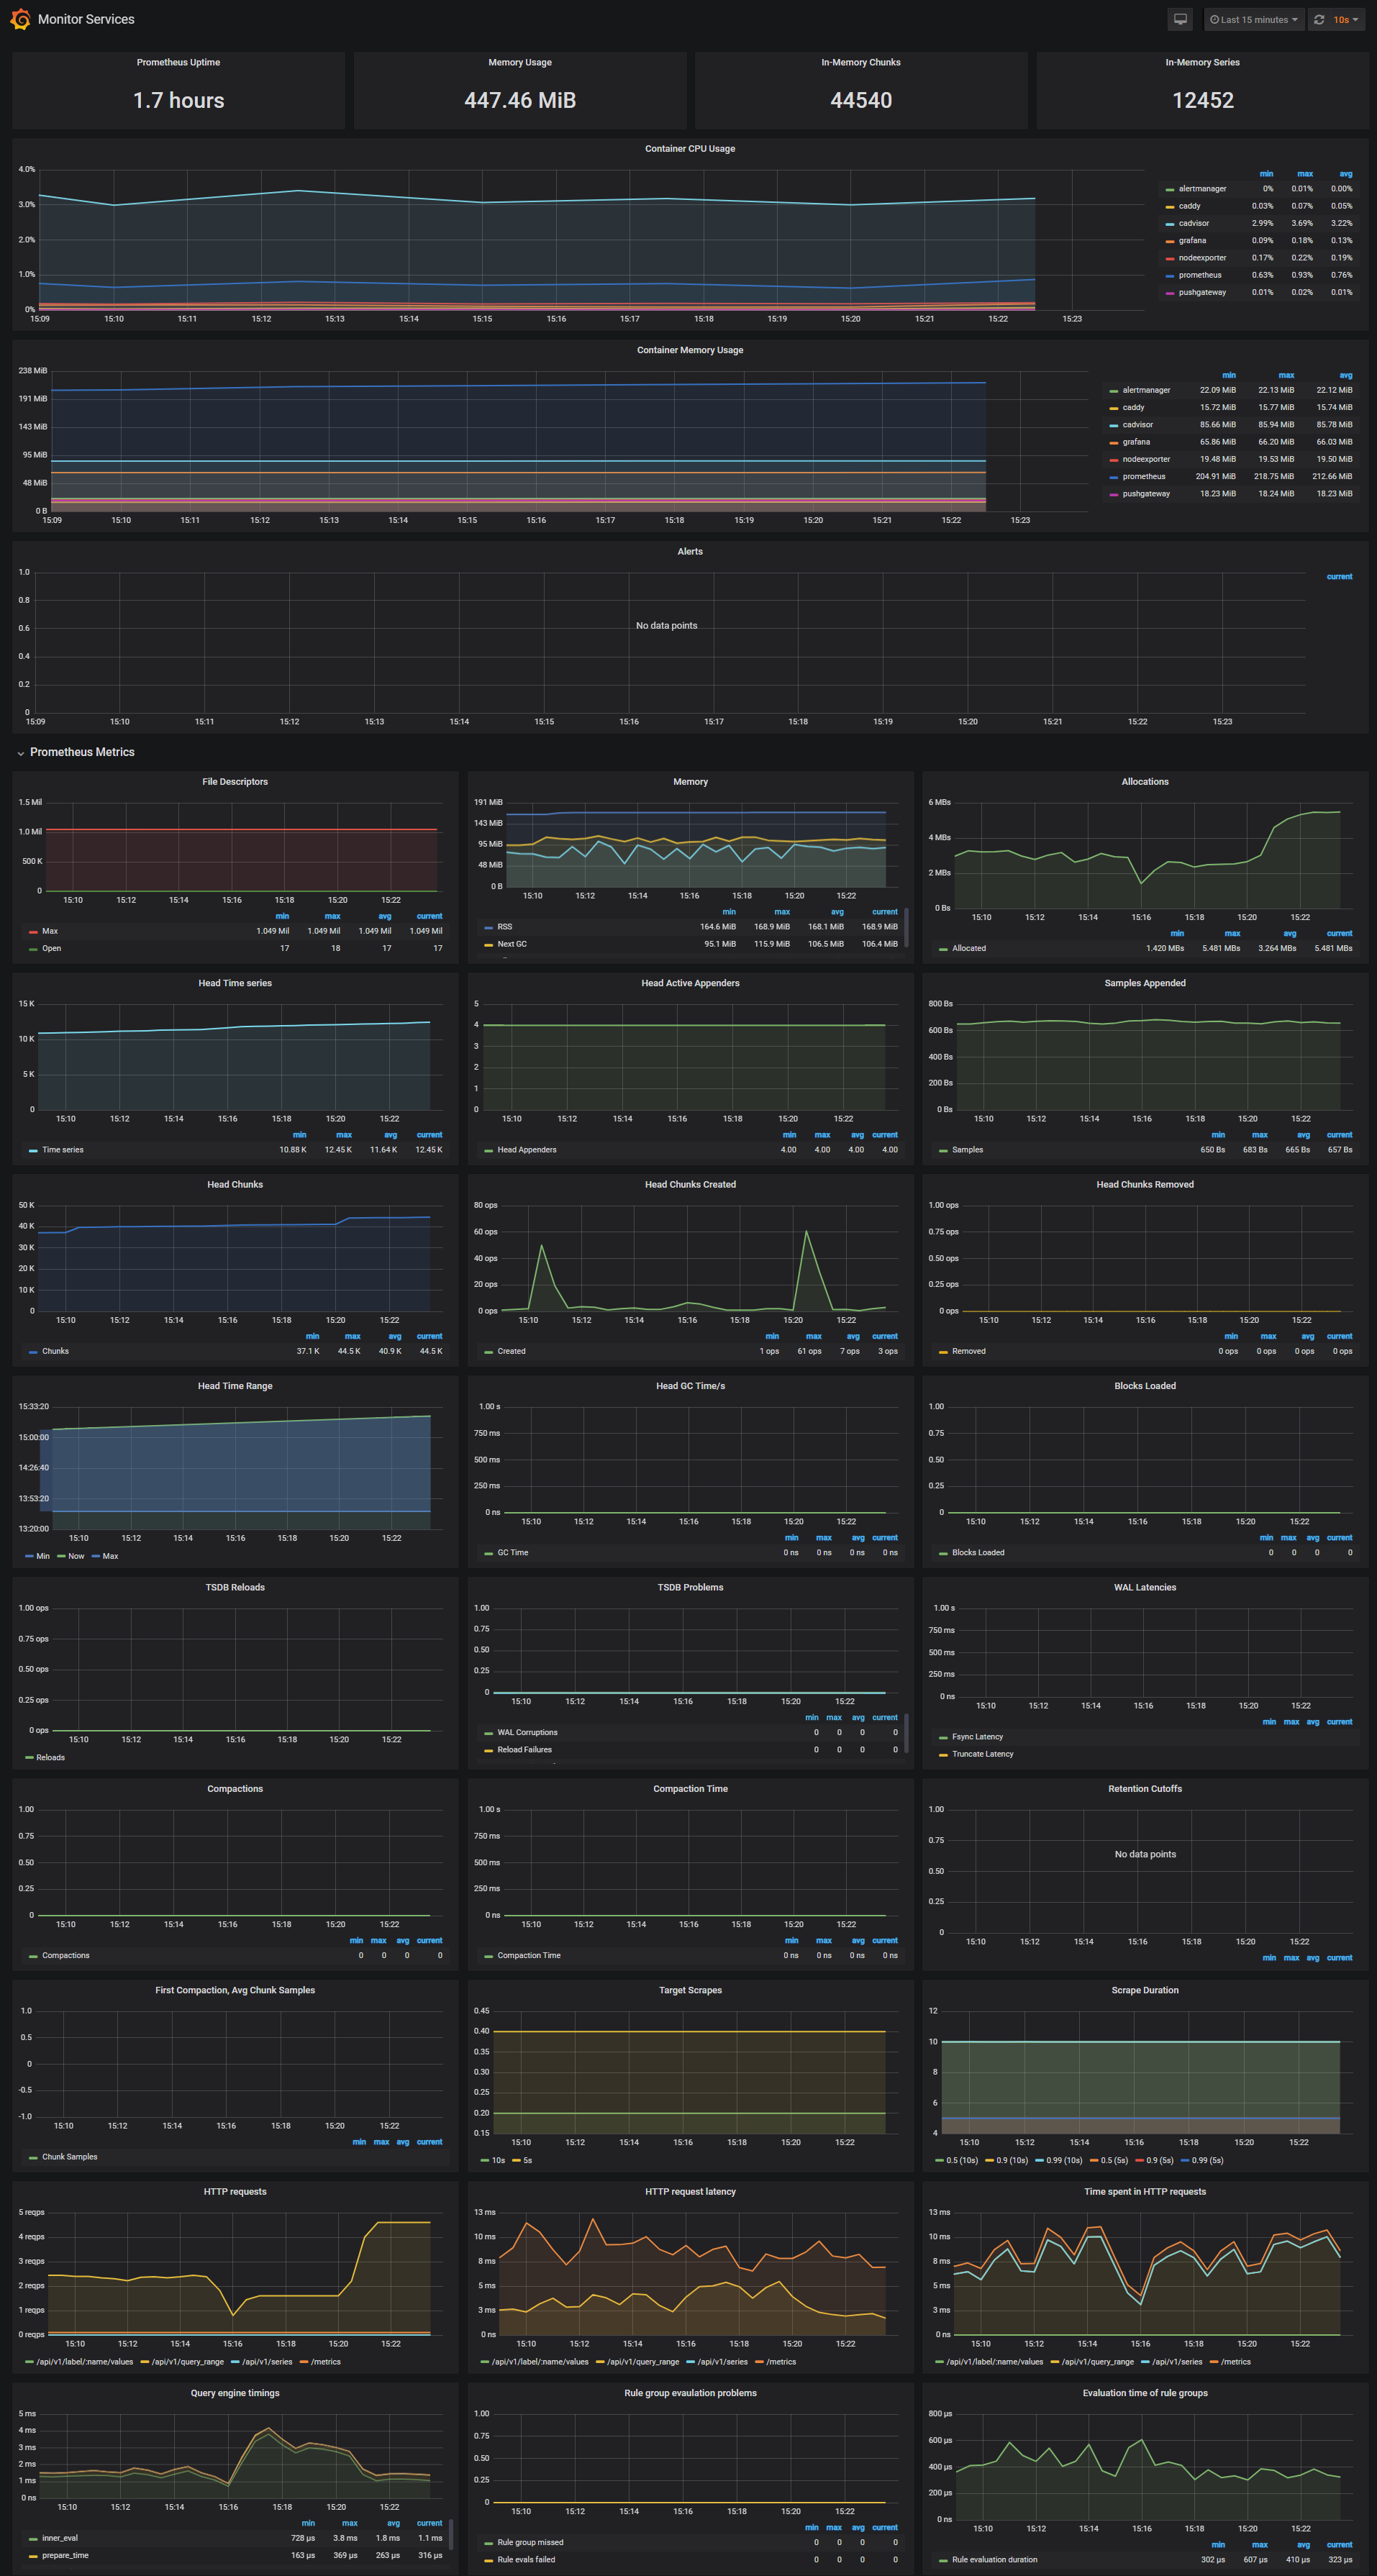
The Monitor Services Dashboard shows key metrics for monitoring the containers that make up the monitoring stack:
- Prometheus container uptime, monitoring stack total memory usage, Prometheus local storage memory chunks and series
- Container CPU usage graph
- Container memory usage graph
- Prometheus chunks to persist and persistence urgency graphs
- Prometheus chunks ops and checkpoint duration graphs
- Prometheus samples ingested rate, target scrapes and scrape duration graphs
- Prometheus HTTP requests graph
- Prometheus alerts graph
Prometheus memory usage can be controlled by adjusting the local storage memory chunks.
You can modify the max chunks value in docker-compose.yml.
I've set the storage.local.memory-chunks value to 100000, if you monitor 10 containers, then Prometheus will use around 1GB of RAM.
If any agent crashes, you can stop the containers by running docker-compose stop and restart.
This work is supported by IBM-ILLINOIS Center for Cognitive Computing Systems Research (C3SR) - a research collaboration as part of the IBM Cognitive Horizon Network.