I updated it to support the latest version (5.x) and also changed km to miles on my dash.
{
"__inputs": [
{
"name": "DS_PROMETHEUS",
"label": "Prometheus",
"description": "",
"type": "datasource",
"pluginId": "prometheus",
"pluginName": "Prometheus"
}
],
"__requires": [
{
"type": "grafana",
"id": "grafana",
"name": "Grafana",
"version": "5.2.1"
},
{
"type": "panel",
"id": "graph",
"name": "Graph",
"version": "5.0.0"
},
{
"type": "datasource",
"id": "prometheus",
"name": "Prometheus",
"version": "5.0.0"
},
{
"type": "panel",
"id": "singlestat",
"name": "Singlestat",
"version": "5.0.0"
},
{
"type": "panel",
"id": "text",
"name": "Text",
"version": "5.0.0"
}
],
"annotations": {
"list": [
{
"builtIn": 1,
"datasource": "-- Grafana --",
"enable": true,
"hide": true,
"iconColor": "rgba(0, 211, 255, 1)",
"name": "Annotations & Alerts",
"type": "dashboard"
}
]
},
"description": "This dashboard displays dump1090 metrics that get exposed to Prometheus by the dump1090exporter.",
"editable": true,
"gnetId": 768,
"graphTooltip": 0,
"id": null,
"links": [],
"panels": [
{
"cacheTimeout": null,
"colorBackground": false,
"colorValue": false,
"colors": [
"rgba(245, 54, 54, 0.9)",
"rgba(237, 129, 40, 0.89)",
"rgba(50, 172, 45, 0.97)"
],
"datasource": "${DS_PROMETHEUS}",
"editable": true,
"error": false,
"format": "none",
"gauge": {
"maxValue": 100,
"minValue": 0,
"show": false,
"thresholdLabels": false,
"thresholdMarkers": true
},
"gridPos": {
"h": 3,
"w": 4,
"x": 0,
"y": 0
},
"height": "50px",
"hideTimeOverride": true,
"id": 9,
"interval": "5s",
"isNew": true,
"links": [],
"mappingType": 1,
"mappingTypes": [
{
"name": "value to text",
"value": 1
},
{
"name": "range to text",
"value": 2
}
],
"maxDataPoints": 100,
"nullPointMode": "connected",
"nullText": null,
"postfix": "",
"postfixFontSize": "50%",
"prefix": "",
"prefixFontSize": "50%",
"rangeMaps": [
{
"from": "null",
"text": "N/A",
"to": "null"
}
],
"sparkline": {
"fillColor": "rgba(31, 118, 189, 0.18)",
"full": false,
"lineColor": "rgb(31, 120, 193)",
"show": false
},
"tableColumn": "",
"targets": [
{
"expr": "dump1090_recent_aircraft_observed{job=\"dump1090\", time_period=\"latest\"}",
"format": "time_series",
"intervalFactor": 2,
"legendFormat": "",
"metric": "dump1090_recent_",
"refId": "A",
"step": 2
}
],
"thresholds": "",
"timeFrom": "1s",
"title": "Aircraft Total",
"type": "singlestat",
"valueFontSize": "80%",
"valueMaps": [
{
"op": "=",
"text": "N/A",
"value": "null"
}
],
"valueName": "avg"
},
{
"cacheTimeout": null,
"colorBackground": false,
"colorValue": false,
"colors": [
"rgba(245, 54, 54, 0.9)",
"rgba(237, 129, 40, 0.89)",
"rgba(50, 172, 45, 0.97)"
],
"datasource": "${DS_PROMETHEUS}",
"editable": true,
"error": false,
"format": "none",
"gauge": {
"maxValue": 100,
"minValue": 0,
"show": false,
"thresholdLabels": false,
"thresholdMarkers": true
},
"gridPos": {
"h": 3,
"w": 4,
"x": 4,
"y": 0
},
"height": "50px",
"hideTimeOverride": true,
"id": 19,
"interval": "5s",
"isNew": true,
"links": [],
"mappingType": 1,
"mappingTypes": [
{
"name": "value to text",
"value": 1
},
{
"name": "range to text",
"value": 2
}
],
"maxDataPoints": 100,
"nullPointMode": "connected",
"nullText": null,
"postfix": "",
"postfixFontSize": "50%",
"prefix": "",
"prefixFontSize": "50%",
"rangeMaps": [
{
"from": "null",
"text": "N/A",
"to": "null"
}
],
"sparkline": {
"fillColor": "rgba(31, 118, 189, 0.18)",
"full": false,
"lineColor": "rgb(31, 120, 193)",
"show": false
},
"tableColumn": "",
"targets": [
{
"expr": "dump1090_recent_aircraft_with_position{job=\"dump1090\", time_period=\"latest\"}",
"format": "time_series",
"intervalFactor": 2,
"legendFormat": "",
"metric": "dump1090_recent_",
"refId": "A",
"step": 2
}
],
"thresholds": "",
"timeFrom": "1s",
"title": "Aircraft w/ Position",
"type": "singlestat",
"valueFontSize": "80%",
"valueMaps": [
{
"op": "=",
"text": "N/A",
"value": "null"
}
],
"valueName": "avg"
},
{
"cacheTimeout": null,
"colorBackground": false,
"colorValue": false,
"colors": [
"rgba(245, 54, 54, 0.9)",
"rgba(237, 129, 40, 0.89)",
"rgba(50, 172, 45, 0.97)"
],
"datasource": "${DS_PROMETHEUS}",
"decimals": 1,
"editable": true,
"error": false,
"format": "lengthmi",
"gauge": {
"maxValue": 100,
"minValue": 0,
"show": false,
"thresholdLabels": false,
"thresholdMarkers": true
},
"gridPos": {
"h": 3,
"w": 4,
"x": 8,
"y": 0
},
"height": "50px",
"hideTimeOverride": true,
"id": 10,
"interval": "5s",
"isNew": true,
"links": [],
"mappingType": 1,
"mappingTypes": [
{
"name": "value to text",
"value": 1
},
{
"name": "range to text",
"value": 2
}
],
"maxDataPoints": 100,
"nullPointMode": "connected",
"nullText": null,
"postfix": "",
"postfixFontSize": "50%",
"prefix": "",
"prefixFontSize": "50%",
"rangeMaps": [
{
"from": "null",
"text": "N/A",
"to": "null"
}
],
"sparkline": {
"fillColor": "rgba(31, 118, 189, 0.18)",
"full": false,
"lineColor": "rgb(31, 120, 193)",
"show": false
},
"tableColumn": "",
"targets": [
{
"expr": "sum(dump1090_recent_aircraft_max_range{job=\"dump1090\"}*0.00062137)",
"format": "time_series",
"intervalFactor": 2,
"legendFormat": "",
"metric": "dump1090_aircraft_recent_max_range",
"refId": "A",
"step": 2
}
],
"thresholds": "",
"timeFrom": "1s",
"title": "Max Range",
"type": "singlestat",
"valueFontSize": "80%",
"valueMaps": [
{
"op": "=",
"text": "N/A",
"value": "null"
}
],
"valueName": "avg"
},
{
"cacheTimeout": null,
"colorBackground": false,
"colorValue": false,
"colors": [
"rgba(245, 54, 54, 0.9)",
"rgba(237, 129, 40, 0.89)",
"rgba(50, 172, 45, 0.97)"
],
"datasource": "${DS_PROMETHEUS}",
"editable": true,
"error": false,
"format": "none",
"gauge": {
"maxValue": 100,
"minValue": 0,
"show": false,
"thresholdLabels": false,
"thresholdMarkers": true
},
"gridPos": {
"h": 3,
"w": 4,
"x": 12,
"y": 0
},
"height": "50px",
"hideTimeOverride": true,
"id": 11,
"interval": "5s",
"isNew": true,
"links": [],
"mappingType": 1,
"mappingTypes": [
{
"name": "value to text",
"value": 1
},
{
"name": "range to text",
"value": 2
}
],
"maxDataPoints": 100,
"nullPointMode": "connected",
"nullText": null,
"postfix": "",
"postfixFontSize": "50%",
"prefix": "",
"prefixFontSize": "50%",
"rangeMaps": [
{
"from": "null",
"text": "N/A",
"to": "null"
}
],
"sparkline": {
"fillColor": "rgba(31, 118, 189, 0.18)",
"full": false,
"lineColor": "rgb(31, 120, 193)",
"show": false
},
"tableColumn": "",
"targets": [
{
"expr": "rate(dump1090_messages_total{job=\"dump1090\", time_period=\"latest\"}[1m])",
"format": "time_series",
"intervalFactor": 2,
"legendFormat": "",
"metric": "dump1090_aircraft_recent_max_range",
"refId": "A",
"step": 2
}
],
"thresholds": "",
"timeFrom": "1s",
"title": "Messages/Sec",
"type": "singlestat",
"valueFontSize": "80%",
"valueMaps": [
{
"op": "=",
"text": "N/A",
"value": "null"
}
],
"valueName": "avg"
},
{
"cacheTimeout": null,
"colorBackground": false,
"colorValue": false,
"colors": [
"rgba(245, 54, 54, 0.9)",
"rgba(237, 129, 40, 0.89)",
"rgba(50, 172, 45, 0.97)"
],
"datasource": "${DS_PROMETHEUS}",
"editable": true,
"error": false,
"format": "none",
"gauge": {
"maxValue": 100,
"minValue": 0,
"show": false,
"thresholdLabels": false,
"thresholdMarkers": true
},
"gridPos": {
"h": 3,
"w": 4,
"x": 16,
"y": 0
},
"height": "50px",
"hideTimeOverride": true,
"id": 13,
"interval": "5s",
"isNew": true,
"links": [],
"mappingType": 1,
"mappingTypes": [
{
"name": "value to text",
"value": 1
},
{
"name": "range to text",
"value": 2
}
],
"maxDataPoints": 100,
"nullPointMode": "connected",
"nullText": null,
"postfix": " dbFS",
"postfixFontSize": "50%",
"prefix": "",
"prefixFontSize": "50%",
"rangeMaps": [
{
"from": "null",
"text": "N/A",
"to": "null"
}
],
"sparkline": {
"fillColor": "rgba(31, 118, 189, 0.18)",
"full": false,
"lineColor": "rgb(31, 120, 193)",
"show": false
},
"tableColumn": "",
"targets": [
{
"expr": "dump1090_stats_local_peak_signal_strength_dbFS{job=\"dump1090\", time_period=\"last1min\"}",
"format": "time_series",
"interval": "1s",
"intervalFactor": 1,
"legendFormat": "",
"metric": "",
"refId": "A",
"step": 1
}
],
"thresholds": "",
"timeFrom": "1s",
"timeShift": null,
"title": "Signal Peak",
"type": "singlestat",
"valueFontSize": "80%",
"valueMaps": [
{
"op": "=",
"text": "N/A",
"value": "null"
}
],
"valueName": "avg"
},
{
"cacheTimeout": null,
"colorBackground": false,
"colorValue": false,
"colors": [
"rgba(245, 54, 54, 0.9)",
"rgba(237, 129, 40, 0.89)",
"rgba(50, 172, 45, 0.97)"
],
"datasource": "${DS_PROMETHEUS}",
"editable": true,
"error": false,
"format": "none",
"gauge": {
"maxValue": 100,
"minValue": 0,
"show": false,
"thresholdLabels": false,
"thresholdMarkers": true
},
"gridPos": {
"h": 3,
"w": 4,
"x": 20,
"y": 0
},
"height": "50px",
"hideTimeOverride": true,
"id": 12,
"interval": "5s",
"isNew": true,
"links": [],
"mappingType": 1,
"mappingTypes": [
{
"name": "value to text",
"value": 1
},
{
"name": "range to text",
"value": 2
}
],
"maxDataPoints": 100,
"nullPointMode": "connected",
"nullText": null,
"postfix": " dbFS",
"postfixFontSize": "50%",
"prefix": "",
"prefixFontSize": "50%",
"rangeMaps": [
{
"from": "null",
"text": "N/A",
"to": "null"
}
],
"sparkline": {
"fillColor": "rgba(31, 118, 189, 0.18)",
"full": false,
"lineColor": "rgb(31, 120, 193)",
"show": false
},
"tableColumn": "",
"targets": [
{
"expr": "dump1090_stats_local_signal_strength_dbFS{job=\"dump1090\", time_period=\"last1min\"}",
"format": "time_series",
"intervalFactor": 2,
"legendFormat": "",
"metric": "dump1090_aircraft_recent_max_range",
"refId": "A",
"step": 2
}
],
"thresholds": "",
"timeFrom": "1s",
"title": "Signal Mean",
"type": "singlestat",
"valueFontSize": "80%",
"valueMaps": [
{
"op": "=",
"text": "N/A",
"value": "null"
}
],
"valueName": "avg"
},
{
"aliasColors": {},
"bars": false,
"dashLength": 10,
"dashes": false,
"datasource": "${DS_PROMETHEUS}",
"editable": true,
"error": false,
"fill": 0,
"grid": {},
"gridPos": {
"h": 7,
"w": 18,
"x": 0,
"y": 3
},
"id": 3,
"interval": "5s",
"isNew": true,
"legend": {
"avg": false,
"current": false,
"max": false,
"min": false,
"show": true,
"total": false,
"values": false
},
"lines": true,
"linewidth": 1,
"links": [],
"nullPointMode": "connected",
"percentage": false,
"pointradius": 5,
"points": false,
"renderer": "flot",
"seriesOverrides": [],
"spaceLength": 10,
"stack": false,
"steppedLine": false,
"targets": [
{
"expr": "dump1090_recent_aircraft_observed{job=\"dump1090\", time_period=\"latest\"}",
"format": "time_series",
"intervalFactor": 2,
"legendFormat": "total",
"metric": "recent_aircraft_observed",
"refId": "A",
"step": 10
},
{
"expr": "dump1090_recent_aircraft_with_position{job=\"dump1090\", time_period=\"latest\"}",
"format": "time_series",
"intervalFactor": 2,
"legendFormat": "W/ position",
"refId": "C",
"step": 10
},
{
"expr": "dump1090_recent_aircraft_observed{job=\"dump1090\", time_period=\"latest\"} - dump1090_recent_aircraft_with_position{job=\"dump1090\", time_period=\"latest\"}",
"format": "time_series",
"intervalFactor": 2,
"legendFormat": "Wo/ position",
"refId": "D",
"step": 10
},
{
"expr": "dump1090_recent_aircraft_with_multilateration{job=\"dump1090\", time_period=\"latest\"}",
"format": "time_series",
"intervalFactor": 2,
"legendFormat": "mlat",
"refId": "B",
"step": 10
}
],
"thresholds": [],
"timeFrom": null,
"timeShift": null,
"title": "Aircraft",
"tooltip": {
"msResolution": true,
"shared": true,
"sort": 0,
"value_type": "cumulative"
},
"transparent": false,
"type": "graph",
"xaxis": {
"buckets": null,
"mode": "time",
"name": null,
"show": true,
"values": []
},
"yaxes": [
{
"format": "short",
"label": null,
"logBase": 1,
"max": null,
"min": null,
"show": true
},
{
"format": "short",
"label": null,
"logBase": 1,
"max": null,
"min": null,
"show": true
}
],
"yaxis": {
"align": false,
"alignLevel": null
}
},
{
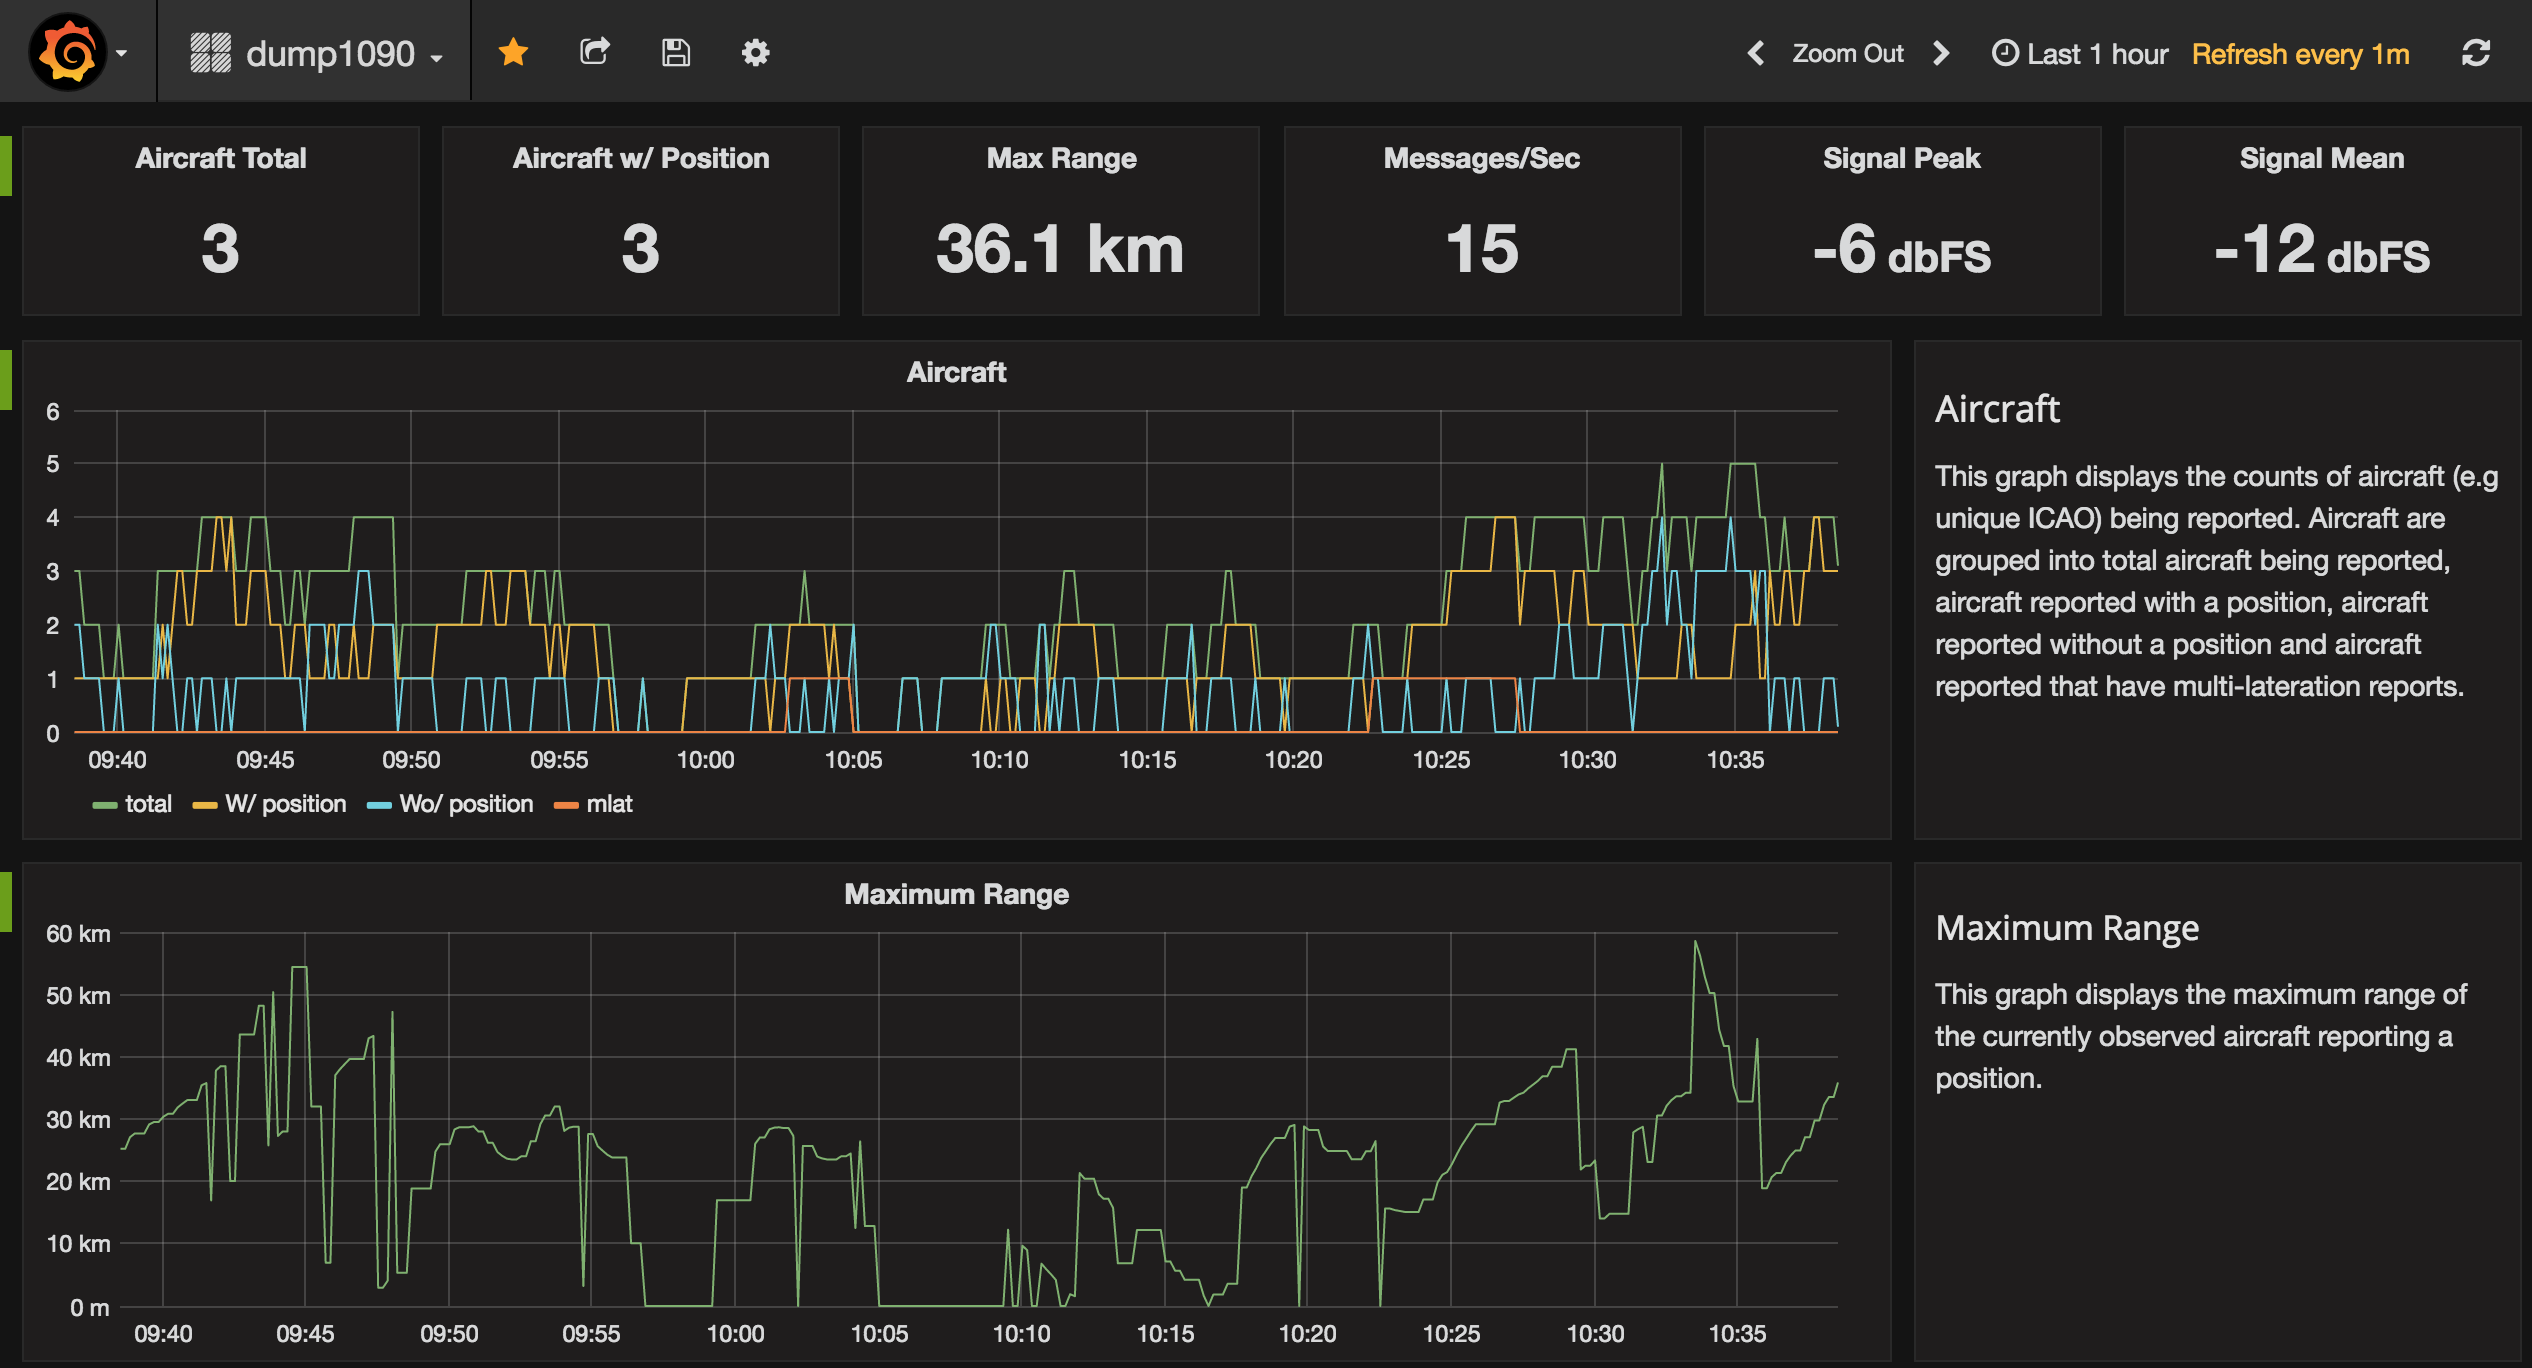
"content": "#### Aircraft\nThis graph displays the counts of aircraft (e.g unique ICAO) being reported. Aircraft are grouped into total aircraft being reported, aircraft reported with a position, aircraft reported without a position and aircraft reported that have multi-lateration reports.",
"editable": true,
"error": false,
"gridPos": {
"h": 7,
"w": 6,
"x": 18,
"y": 3
},
"id": 14,
"isNew": true,
"links": [],
"mode": "markdown",
"title": "",
"type": "text"
},
{
"aliasColors": {},
"bars": false,
"dashLength": 10,
"dashes": false,
"datasource": "${DS_PROMETHEUS}",
"editable": true,
"error": false,
"fill": 0,
"grid": {},
"gridPos": {
"h": 7,
"w": 18,
"x": 0,
"y": 10
},
"id": 1,
"interval": "5s",
"isNew": true,
"legend": {
"alignAsTable": false,
"avg": false,
"current": false,
"max": false,
"min": false,
"rightSide": false,
"show": false,
"total": false,
"values": false
},
"lines": true,
"linewidth": 1,
"links": [],
"nullPointMode": "connected",
"percentage": false,
"pointradius": 5,
"points": false,
"renderer": "flot",
"seriesOverrides": [],
"spaceLength": 10,
"stack": false,
"steppedLine": false,
"targets": [
{
"expr": "sum(dump1090_recent_aircraft_max_range{job=\"dump1090\"}*0.00062137)",
"format": "time_series",
"hide": false,
"intervalFactor": 2,
"legendFormat": "{{ time_period }}",
"metric": "",
"refId": "A",
"step": 10
}
],
"thresholds": [],
"timeFrom": null,
"timeShift": null,
"title": "Maximum Range",
"tooltip": {
"msResolution": true,
"shared": true,
"sort": 0,
"value_type": "cumulative"
},
"transparent": false,
"type": "graph",
"xaxis": {
"buckets": null,
"mode": "time",
"name": null,
"show": true,
"values": []
},
"yaxes": [
{
"format": "lengthmi",
"label": null,
"logBase": 1,
"max": null,
"min": 0,
"show": true
},
{
"format": "short",
"label": null,
"logBase": 1,
"max": null,
"min": null,
"show": true
}
],
"yaxis": {
"align": false,
"alignLevel": null
}
},
{
"content": "##### Maximum Range\nThis graph displays the maximum range of the currently observed aircraft reporting a position.",
"editable": true,
"error": false,
"gridPos": {
"h": 7,
"w": 6,
"x": 18,
"y": 10
},
"id": 15,
"isNew": true,
"links": [],
"mode": "markdown",
"title": "",
"type": "text"
},
{
"aliasColors": {},
"bars": false,
"dashLength": 10,
"dashes": false,
"datasource": "${DS_PROMETHEUS}",
"editable": true,
"error": false,
"fill": 0,
"grid": {},
"gridPos": {
"h": 7,
"w": 18,
"x": 0,
"y": 17
},
"id": 8,
"interval": "5s",
"isNew": true,
"legend": {
"avg": false,
"current": false,
"max": false,
"min": false,
"show": true,
"total": false,
"values": false
},
"lines": true,
"linewidth": 1,
"links": [],
"nullPointMode": "connected",
"percentage": false,
"pointradius": 5,
"points": false,
"renderer": "flot",
"seriesOverrides": [],
"spaceLength": 10,
"stack": false,
"steppedLine": false,
"targets": [
{
"expr": "rate(dump1090_messages_total{job=\"dump1090\", time_period=\"latest\"}[1m])",
"format": "time_series",
"intervalFactor": 2,
"legendFormat": "latest",
"metric": "dump1090_messages_total",
"refId": "A",
"step": 10
},
{
"expr": "dump1090_stats_messages_total{job=\"dump1090\", time_period=\"last1min\"} / 60",
"format": "time_series",
"intervalFactor": 2,
"legendFormat": "last1min",
"refId": "B",
"step": 10
}
],
"thresholds": [],
"timeFrom": null,
"timeShift": null,
"title": "messages / sec",
"tooltip": {
"msResolution": true,
"shared": true,
"sort": 0,
"value_type": "cumulative"
},
"transparent": false,
"type": "graph",
"xaxis": {
"buckets": null,
"mode": "time",
"name": null,
"show": true,
"values": []
},
"yaxes": [
{
"format": "short",
"label": null,
"logBase": 1,
"max": null,
"min": null,
"show": true
},
{
"format": "short",
"label": null,
"logBase": 1,
"max": null,
"min": null,
"show": true
}
],
"yaxis": {
"align": false,
"alignLevel": null
}
},
{
"content": "##### Messages\nThis graph displays the messages received per second.",
"editable": true,
"error": false,
"gridPos": {
"h": 7,
"w": 6,
"x": 18,
"y": 17
},
"id": 16,
"isNew": true,
"links": [],
"mode": "markdown",
"title": "",
"type": "text"
},
{
"aliasColors": {},
"bars": false,
"dashLength": 10,
"dashes": false,
"datasource": "${DS_PROMETHEUS}",
"editable": true,
"error": false,
"fill": 0,
"grid": {},
"gridPos": {
"h": 7,
"w": 18,
"x": 0,
"y": 24
},
"id": 5,
"interval": "5s",
"isNew": true,
"legend": {
"avg": false,
"current": false,
"hideEmpty": false,
"hideZero": false,
"max": false,
"min": false,
"show": true,
"total": false,
"values": false
},
"lines": true,
"linewidth": 1,
"links": [],
"nullPointMode": "connected",
"percentage": false,
"pointradius": 5,
"points": false,
"renderer": "flot",
"seriesOverrides": [],
"spaceLength": 10,
"stack": false,
"steppedLine": false,
"targets": [
{
"expr": "dump1090_stats_local_signal_strength_dbFS{job=\"dump1090\", time_period=\"last1min\"}",
"format": "time_series",
"intervalFactor": 2,
"legendFormat": "mean",
"metric": "dump1090_stats_local_signal_strength_dbFS",
"refId": "A",
"step": 10
},
{
"expr": "dump1090_stats_local_peak_signal_strength_dbFS{job=\"dump1090\", time_period=\"last1min\"}",
"format": "time_series",
"intervalFactor": 2,
"legendFormat": "peak",
"metric": "dump1090_stats_local_peak_signal_strength_dbFS",
"refId": "B",
"step": 10
},
{
"expr": "dump1090_stats_local_noise_level_dbFS{job=\"dump1090\", time_period=\"last1min\"}",
"format": "time_series",
"intervalFactor": 2,
"legendFormat": "noise",
"metric": "dump1090_stats_local_noise_level_dbFS",
"refId": "C",
"step": 10
}
],
"thresholds": [
{
"colorMode": "custom",
"line": true,
"lineColor": "rgba(241, 13, 41, 0.27)",
"op": "gt",
"value": -3
}
],
"timeFrom": null,
"timeShift": null,
"title": "Signal Strength",
"tooltip": {
"msResolution": true,
"shared": true,
"sort": 0,
"value_type": "cumulative"
},
"transparent": false,
"type": "graph",
"xaxis": {
"buckets": null,
"mode": "time",
"name": null,
"show": true,
"values": []
},
"yaxes": [
{
"format": "short",
"label": "dbFS",
"logBase": 1,
"max": null,
"min": null,
"show": true
},
{
"format": "short",
"label": null,
"logBase": 1,
"max": null,
"min": null,
"show": true
}
],
"yaxis": {
"align": false,
"alignLevel": null
}
},
{
"content": "##### Signal Strength\nThis graph displays the signal levels reported for noise, mean and peak signal levels. The values are reported in [dbFS](https://en.wikipedia.org/wiki/DBFS).",
"editable": true,
"error": false,
"gridPos": {
"h": 7,
"w": 6,
"x": 18,
"y": 24
},
"id": 17,
"isNew": true,
"links": [],
"mode": "markdown",
"title": "",
"type": "text"
},
{
"aliasColors": {},
"bars": false,
"dashLength": 10,
"dashes": false,
"datasource": "${DS_PROMETHEUS}",
"editable": true,
"error": false,
"fill": 0,
"grid": {},
"gridPos": {
"h": 7,
"w": 18,
"x": 0,
"y": 31
},
"id": 7,
"interval": "5s",
"isNew": true,
"legend": {
"avg": false,
"current": false,
"max": false,
"min": false,
"show": true,
"total": false,
"values": false
},
"lines": true,
"linewidth": 1,
"links": [],
"nullPointMode": "connected",
"percentage": false,
"pointradius": 5,
"points": false,
"renderer": "flot",
"seriesOverrides": [],
"spaceLength": 10,
"stack": false,
"steppedLine": false,
"targets": [
{
"expr": "dump1090_stats_cpu_demod_milliseconds{job=\"dump1090\", time_period=\"last1min\"}",
"format": "time_series",
"intervalFactor": 2,
"legendFormat": "demod",
"metric": "",
"refId": "B",
"step": 10
},
{
"expr": "dump1090_stats_cpu_reader_milliseconds{job=\"dump1090\", time_period=\"last1min\"}",
"format": "time_series",
"intervalFactor": 2,
"legendFormat": "usb",
"metric": "",
"refId": "A",
"step": 10
},
{
"expr": "dump1090_stats_cpu_background_milliseconds{job=\"dump1090\", time_period=\"last1min\"}",
"format": "time_series",
"intervalFactor": 2,
"legendFormat": "other",
"metric": "",
"refId": "C",
"step": 10
}
],
"thresholds": [],
"timeFrom": null,
"timeShift": null,
"title": "CPU Utilisation",
"tooltip": {
"msResolution": true,
"shared": true,
"sort": 0,
"value_type": "cumulative"
},
"type": "graph",
"xaxis": {
"buckets": null,
"mode": "time",
"name": null,
"show": true,
"values": []
},
"yaxes": [
{
"format": "ms",
"label": null,
"logBase": 1,
"max": null,
"min": null,
"show": true
},
{
"format": "short",
"label": null,
"logBase": 1,
"max": null,
"min": null,
"show": true
}
],
"yaxis": {
"align": false,
"alignLevel": null
}
},
{
"content": "##### CPU Utilisation\nThis graph displays how much CPU time is used by the dump1090 tool. demod reports the time spent demodulating and decoding data from the USB SDR dongle. usb reports time spent reading sample data from the USB SDR dongle. other reports time spent doing network I/O, processing network messages, and periodic tasks.\n",
"editable": true,
"error": false,
"gridPos": {
"h": 7,
"w": 6,
"x": 18,
"y": 31
},
"id": 18,
"isNew": true,
"links": [],
"mode": "markdown",
"title": "",
"type": "text"
}
],
"refresh": "5s",
"schemaVersion": 16,
"style": "dark",
"tags": [],
"templating": {
"list": []
},
"time": {
"from": "now-1h",
"to": "now"
},
"timepicker": {
"refresh_intervals": [
"5s",
"10s",
"30s",
"1m",
"5m",
"15m",
"30m",
"1h",
"2h",
"1d"
],
"time_options": [
"5m",
"15m",
"1h",
"6h",
"12h",
"24h",
"2d",
"7d",
"30d"
]
},
"timezone": "browser",
"title": "dump1090",
"uid": "jYDJZoviz",
"version": 3
}