#Webpagetest Charts UI
This is a chart UI built on top of webpagetest-charts-api
and all the data and chart types that it exposes. Goal is to make it easy to quickly analyze WPT results.
Display charts to see trends and some local data, but always link off to the WPT page for full data.
Don't wanna rebuild WPT, just make it more accessible.
-
Get webpagetest-charts-api up and running first.
-
clone this repo
-
npm installinside the repo. -
WPT_API="http://where-your-wpt-api-is-running:port" npm start -
Visit the app and port and you should see a list of available tests (assuming your API has completed some test runs).
If things get weird You can get into debug mode with:
DEBUG=wpt-ui* npm start and it'll talk to you some.
Once everything is working well wrap it up in forever or pm2 or whatever you want to keep it up and running.
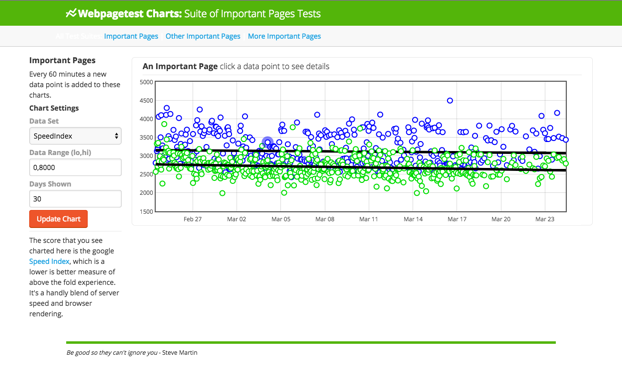
lists the available tests suites the app is currently running. Imagine a nice list on a webpage :-)
Shows charts for all of the tests in the suites. Chart datapoints are clickable, so that you can see exactly what's going on. This example only has one chart, but more would populate here if the suite had more tests. This UI is better served by smaller suites.
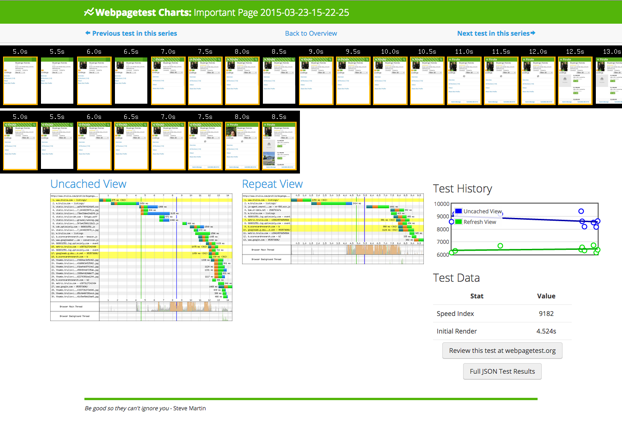
A summary of the WPT results for that datapoint. You can page through these results, or click through to the full WPT test page to get even more data.
PRs are Happily Accepted! The preferred PR method is:
- Fork this repo
- Create a feature branch on your fork
- code things
- PR your feature branch to this master
- We'll check out your PR, test, code review and when it's ready merge it in.
If you have a larger idea, feel free to bring it up in an issue first
- chage the UI to better display a suite that has lots of tests
- Get off of Trulia's CSS and into a known framework
Please note that this project is released with a Contributor Code of Conduct. By participating in this project you agree to abide by its terms.


