Code Monkey home page Code Monkey logo

splatstats's Introduction

SplatStats

PyPI - Python Version PyPI version License: GPL v3 Open Source? Yes!

This codebase works in tandem with the s3s package to refactor and analayze Splatoon 3's data. When finished, it will be able to load s3s package json files, re-shape them, and visualize the data from battles history.

Have a look at our documentation for more information on how to install and use this package!


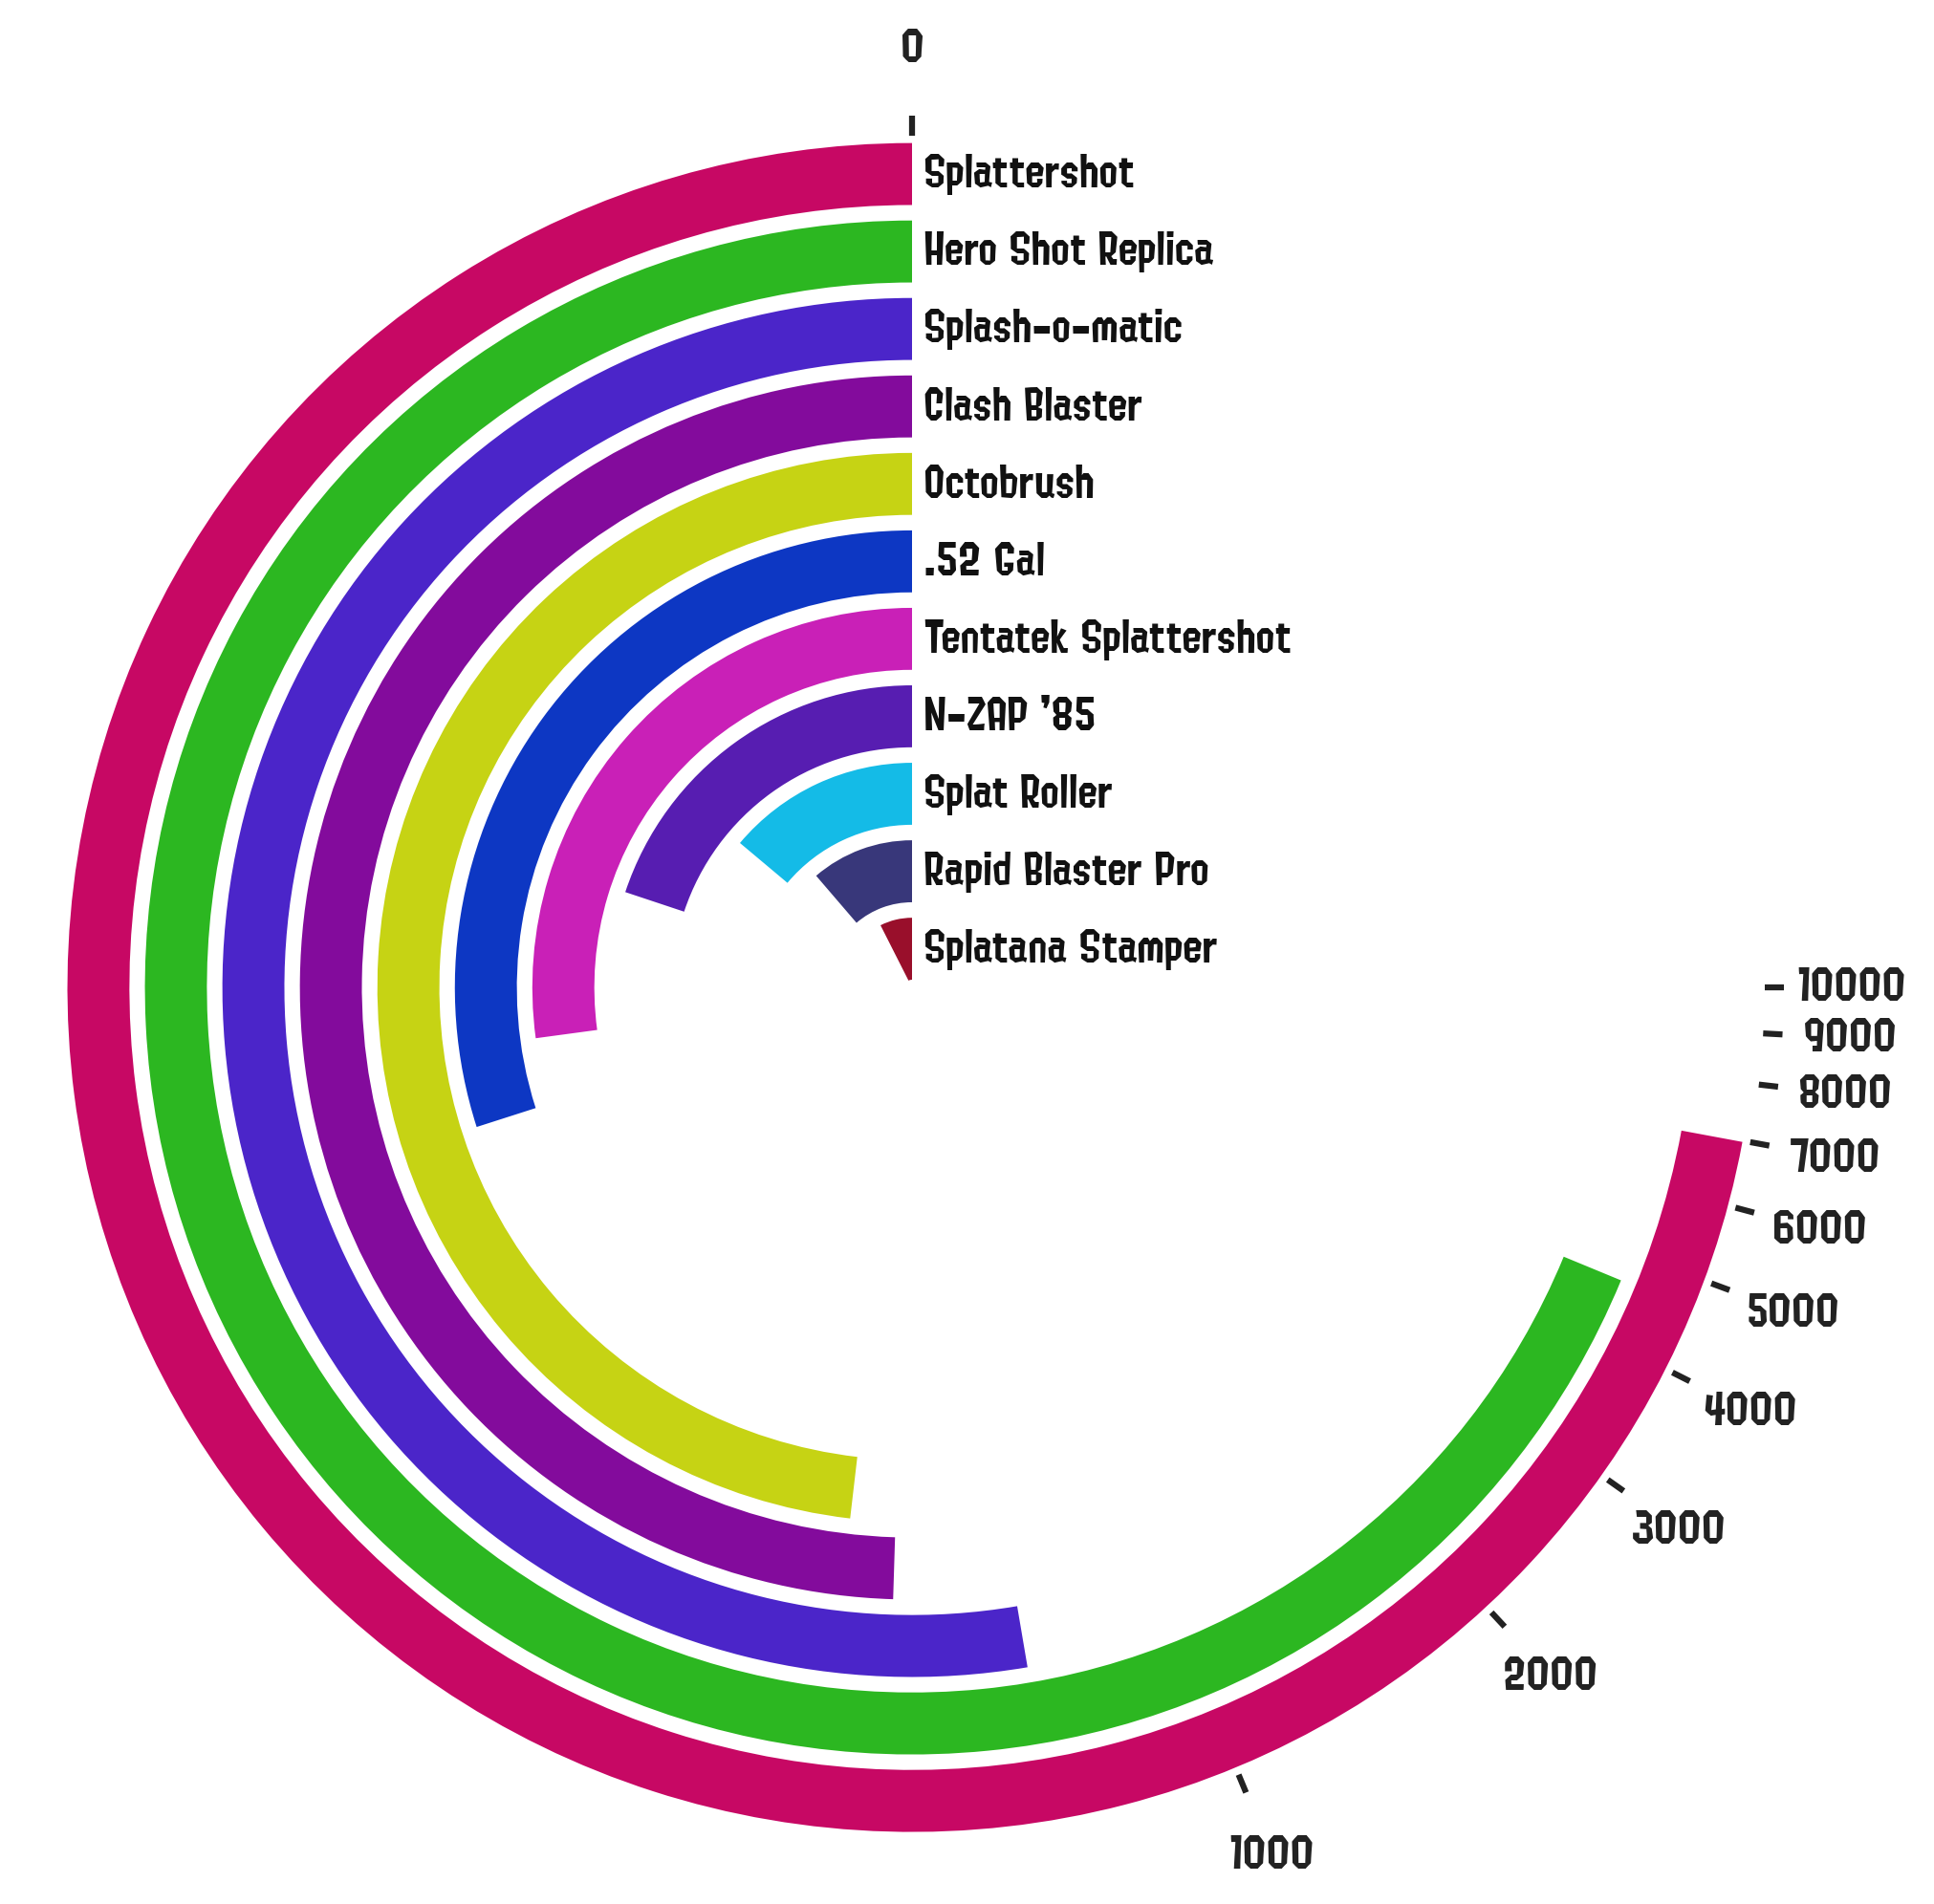
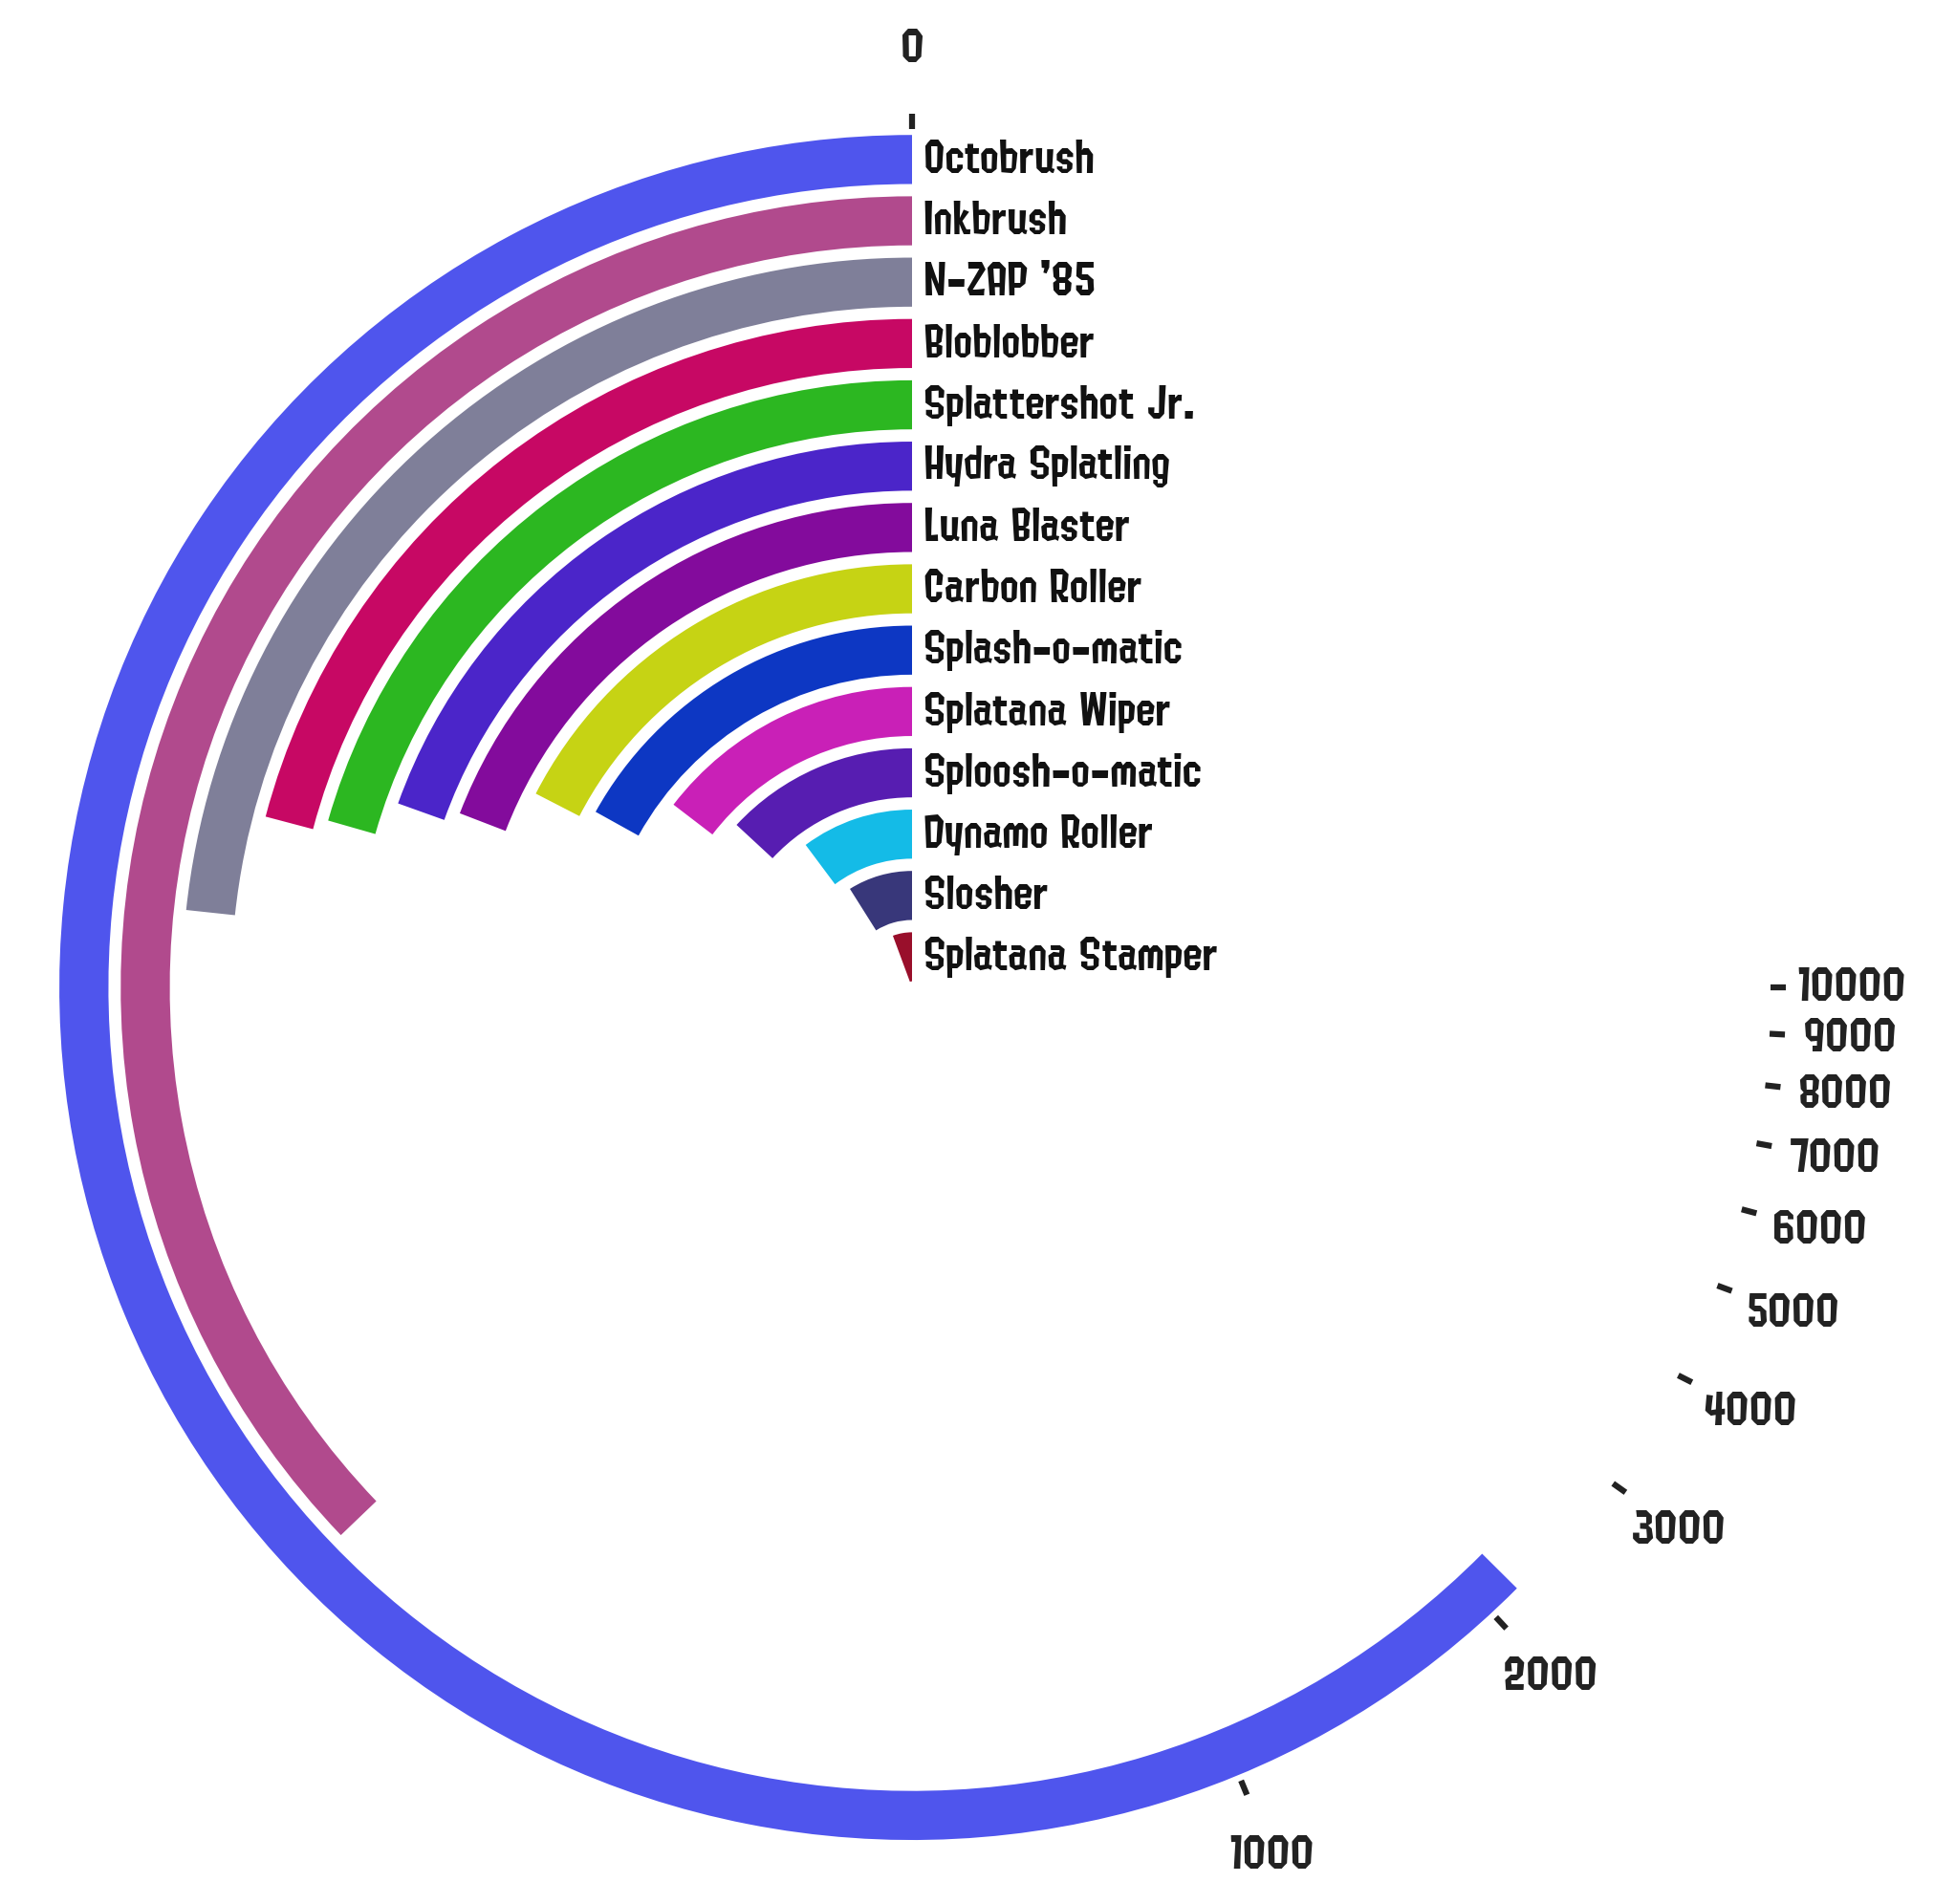
These plots show the breakdown of a given statistic by category shown in a polar barchart. In the following examples we show kills+1/2*assists (kassists) by main weapon.


These barcharts show the frequency of a given statistic broken down by match-type and stage.


These paired histograms show the frequency distributions of the number of kills or kassists (top, blue), and the number of deaths (bottom, magenta) across matches.

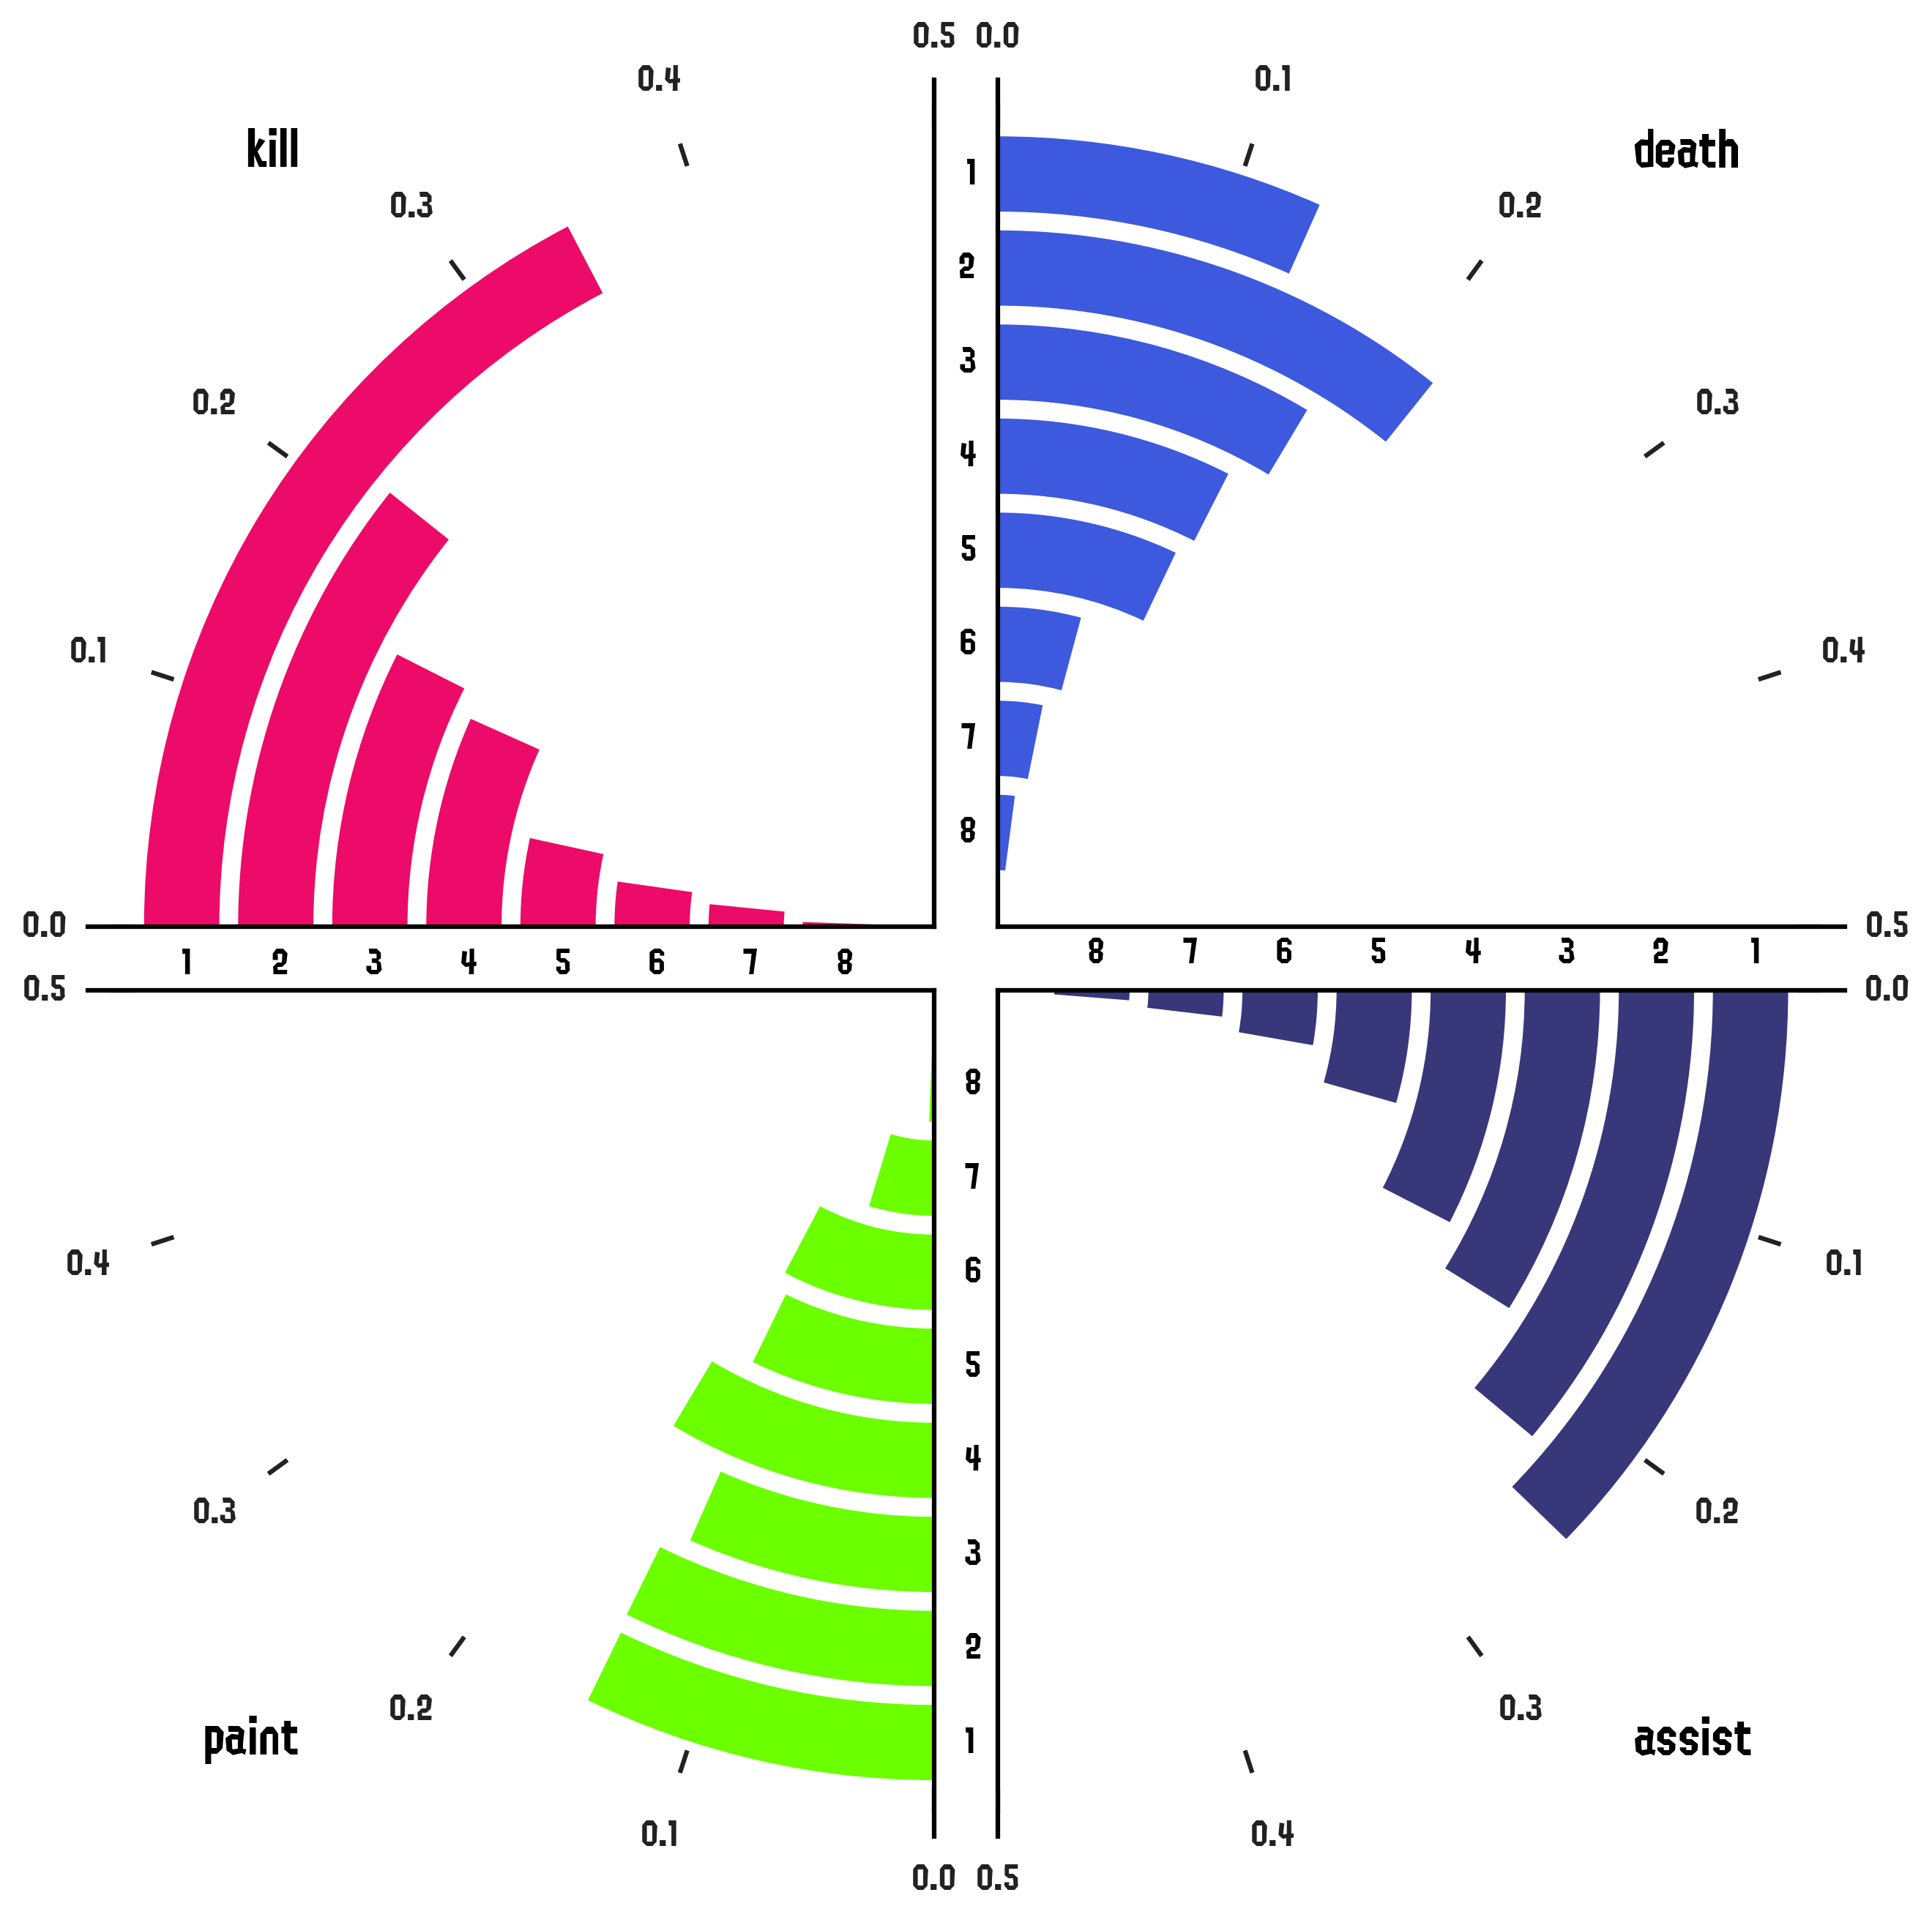
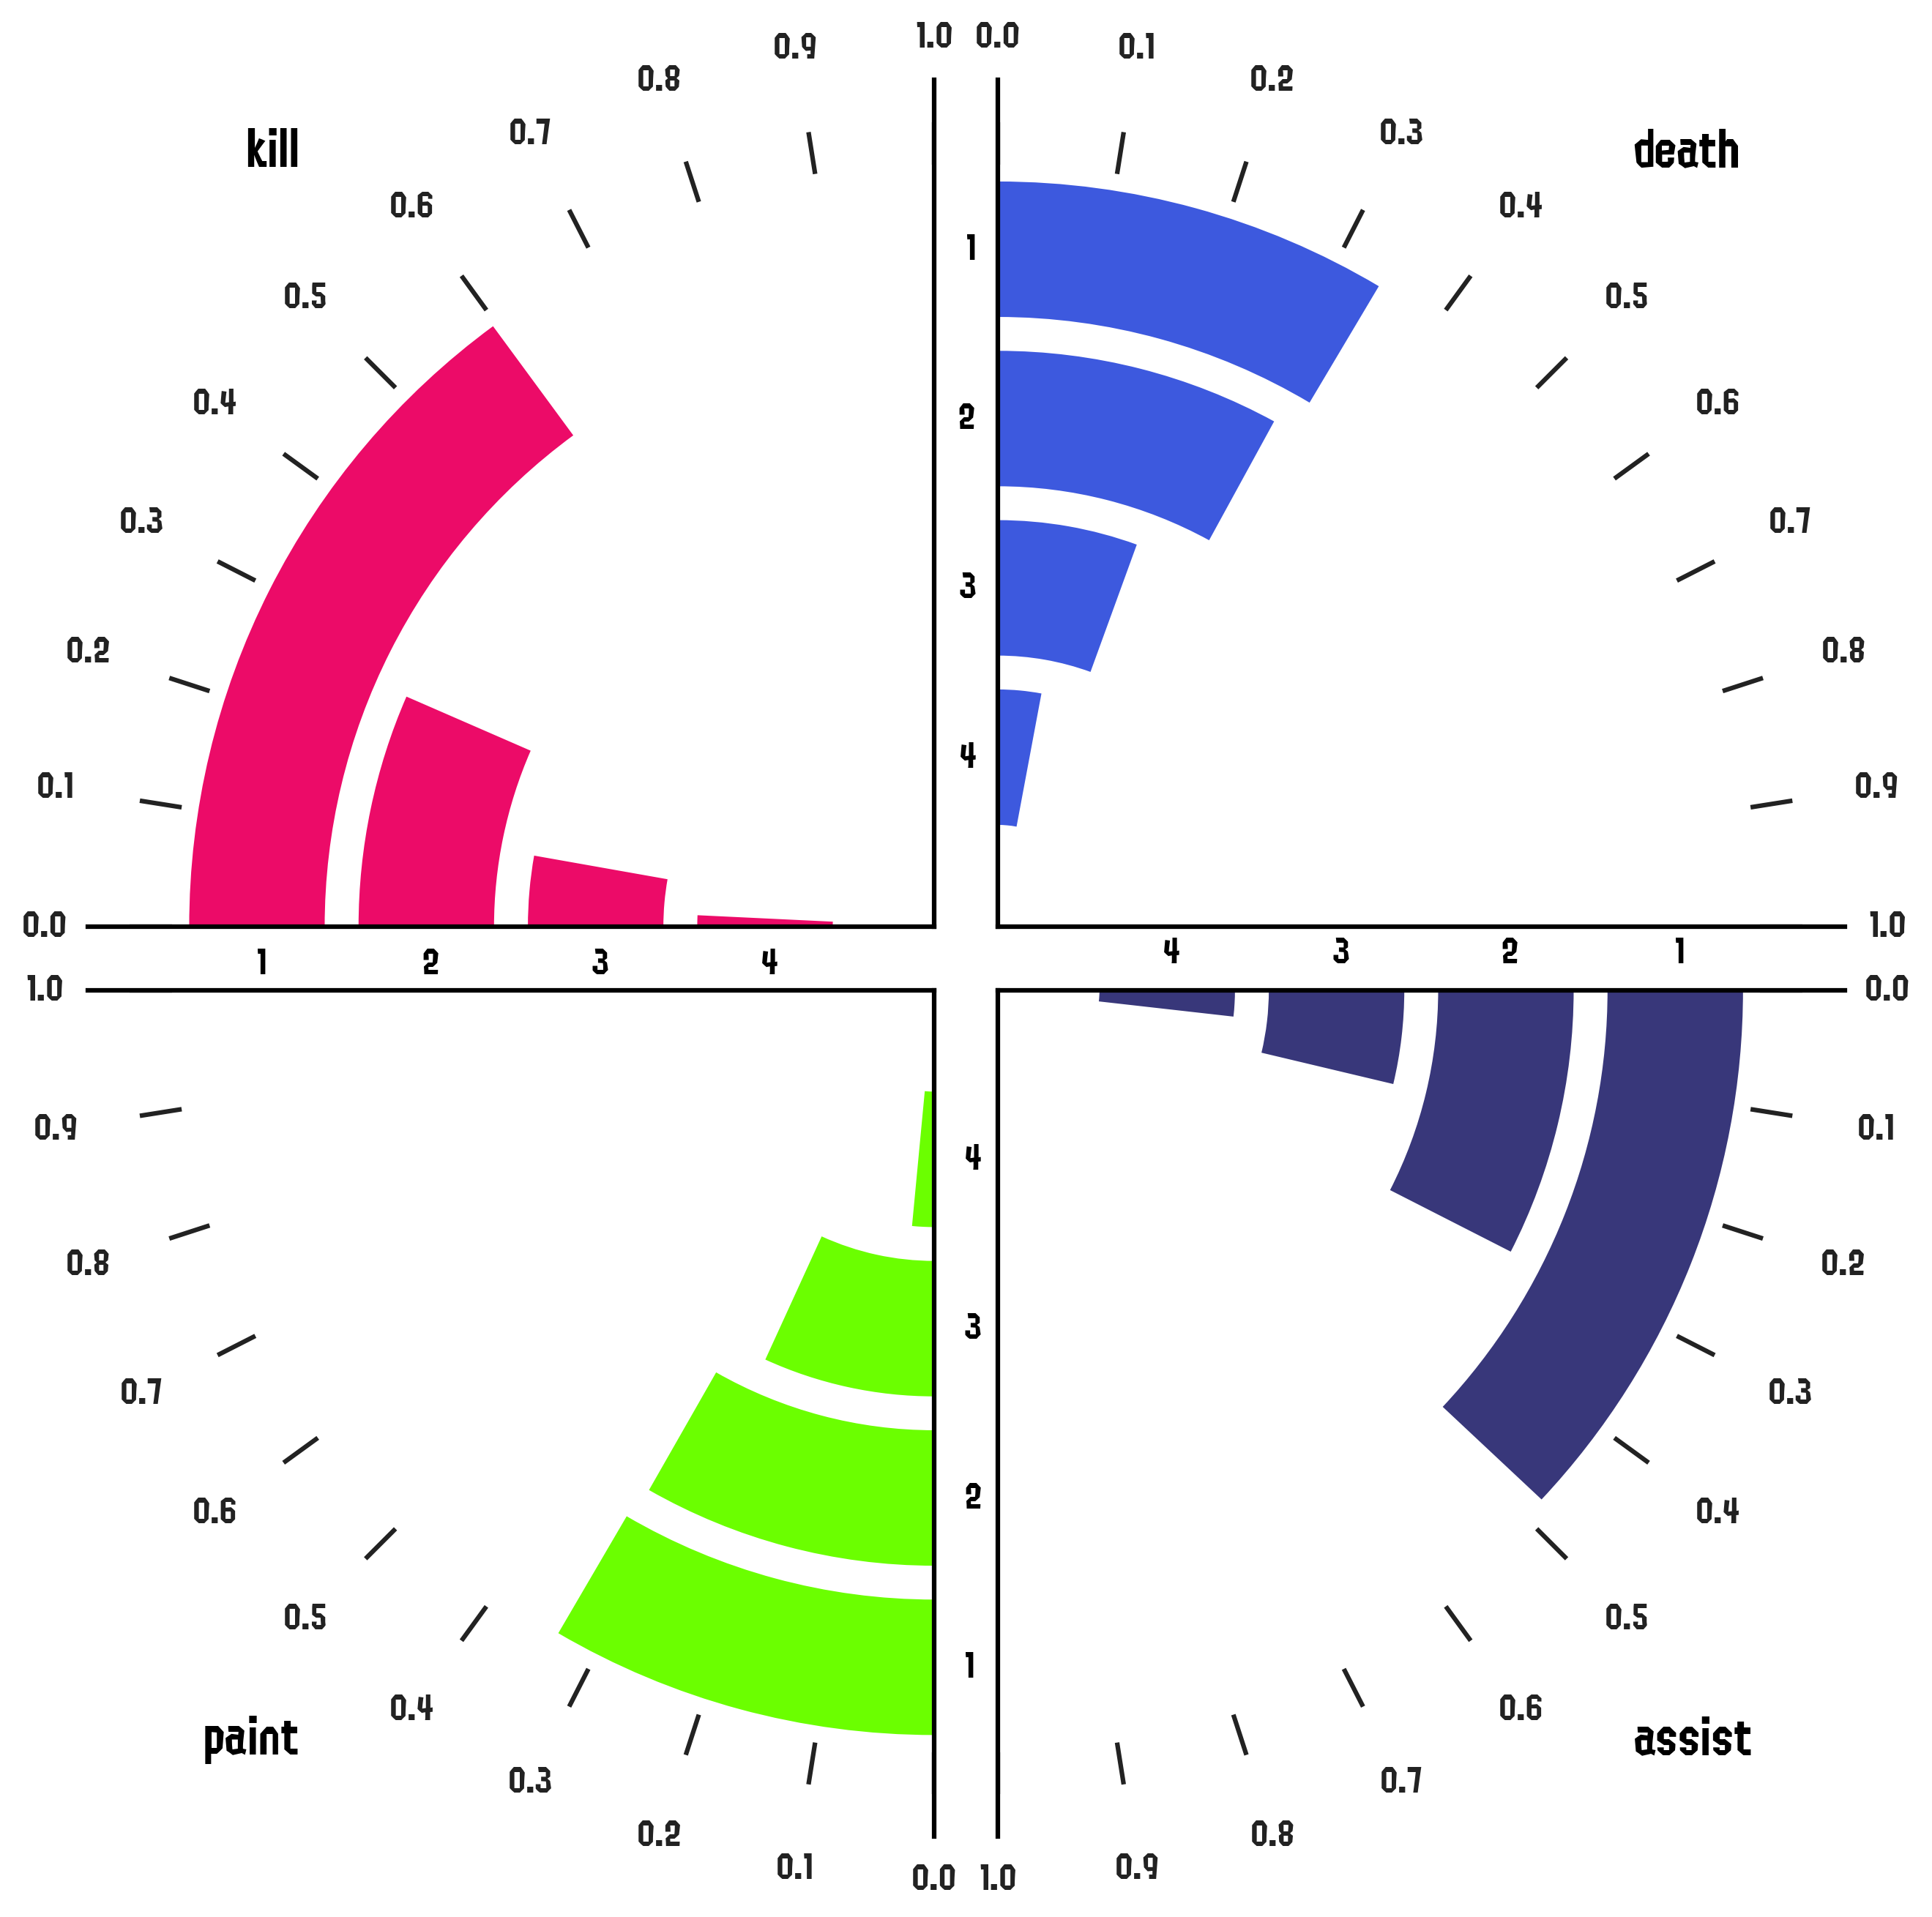
These plots show the player's results as compared to the other players in the match (left) and on the player's team (right).

A simple bar chart of the times awards have been given to the player.


This panel is constructed as a panel composed of two different figures. The top one is a detailed breakdown of the statistics of each battle. Each column on the x axis represents a single battle; where the left y axis shows the number of kills, deaths, assists and specials; and the right y axis the turf painted over the match (bars on the plot).

Shows the contributions of given categories to a certain stat. In this example, we show the total number of (kills+1/2*assists) broken down by weapon.


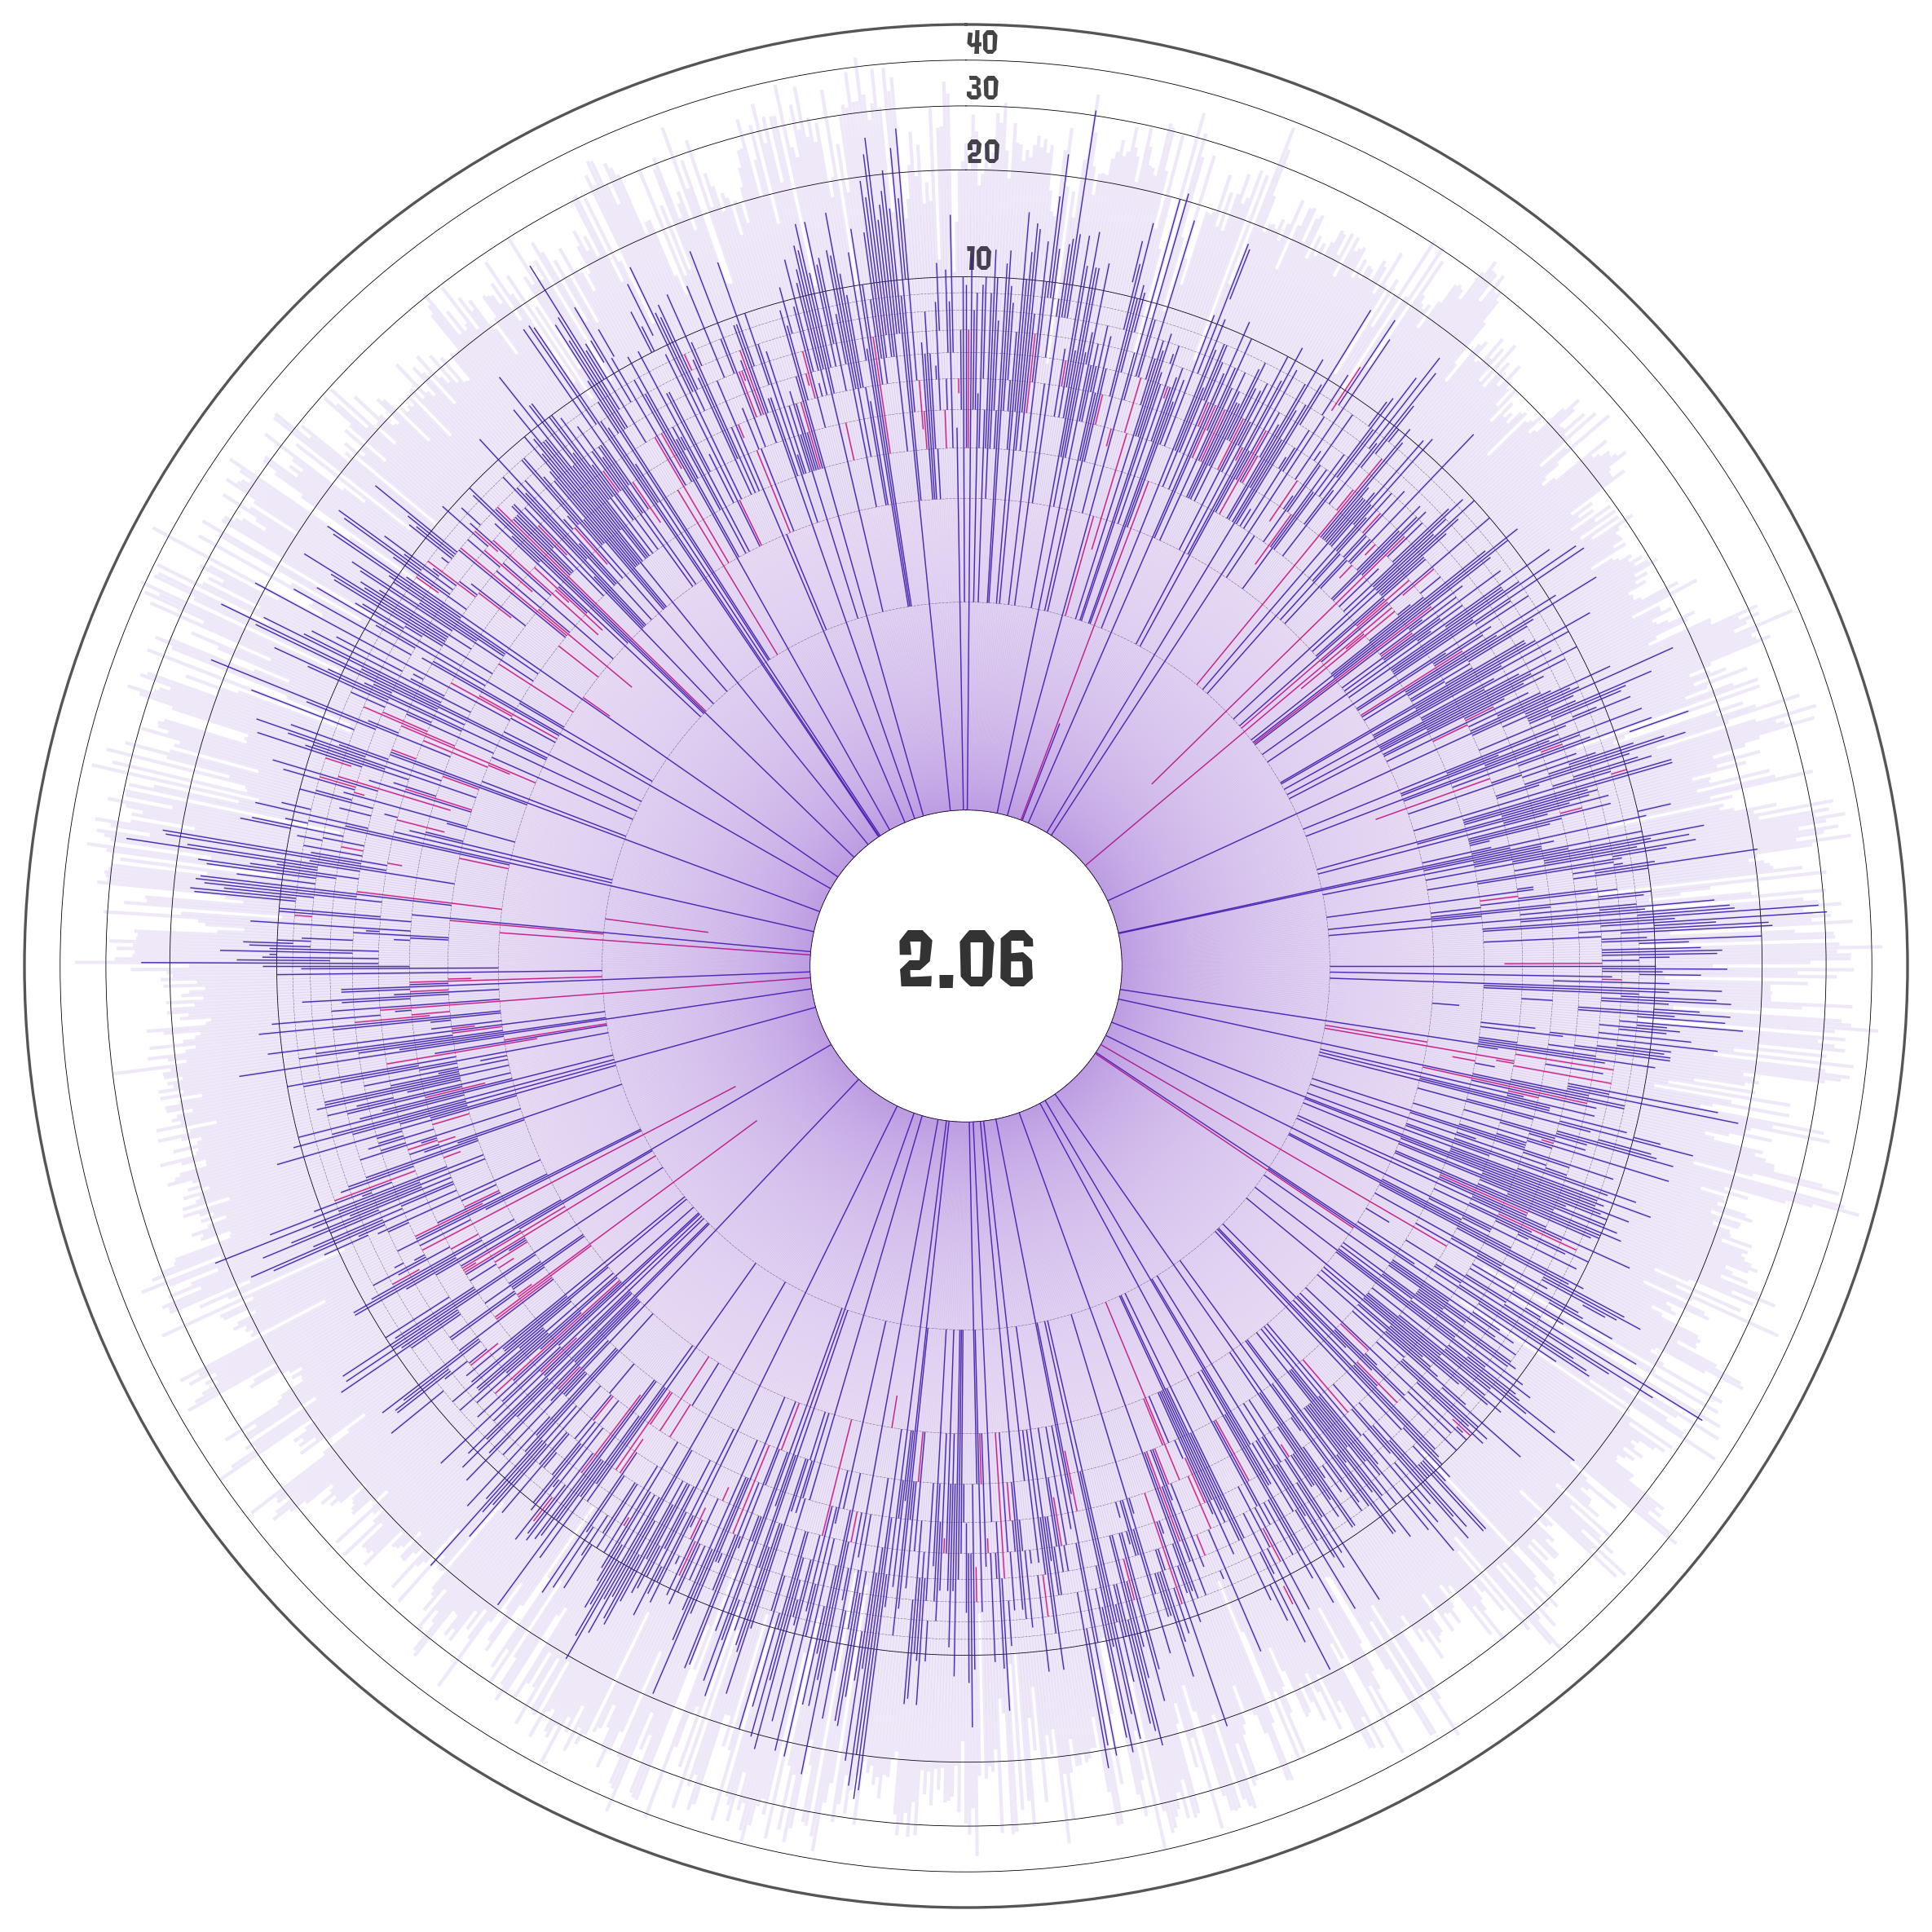
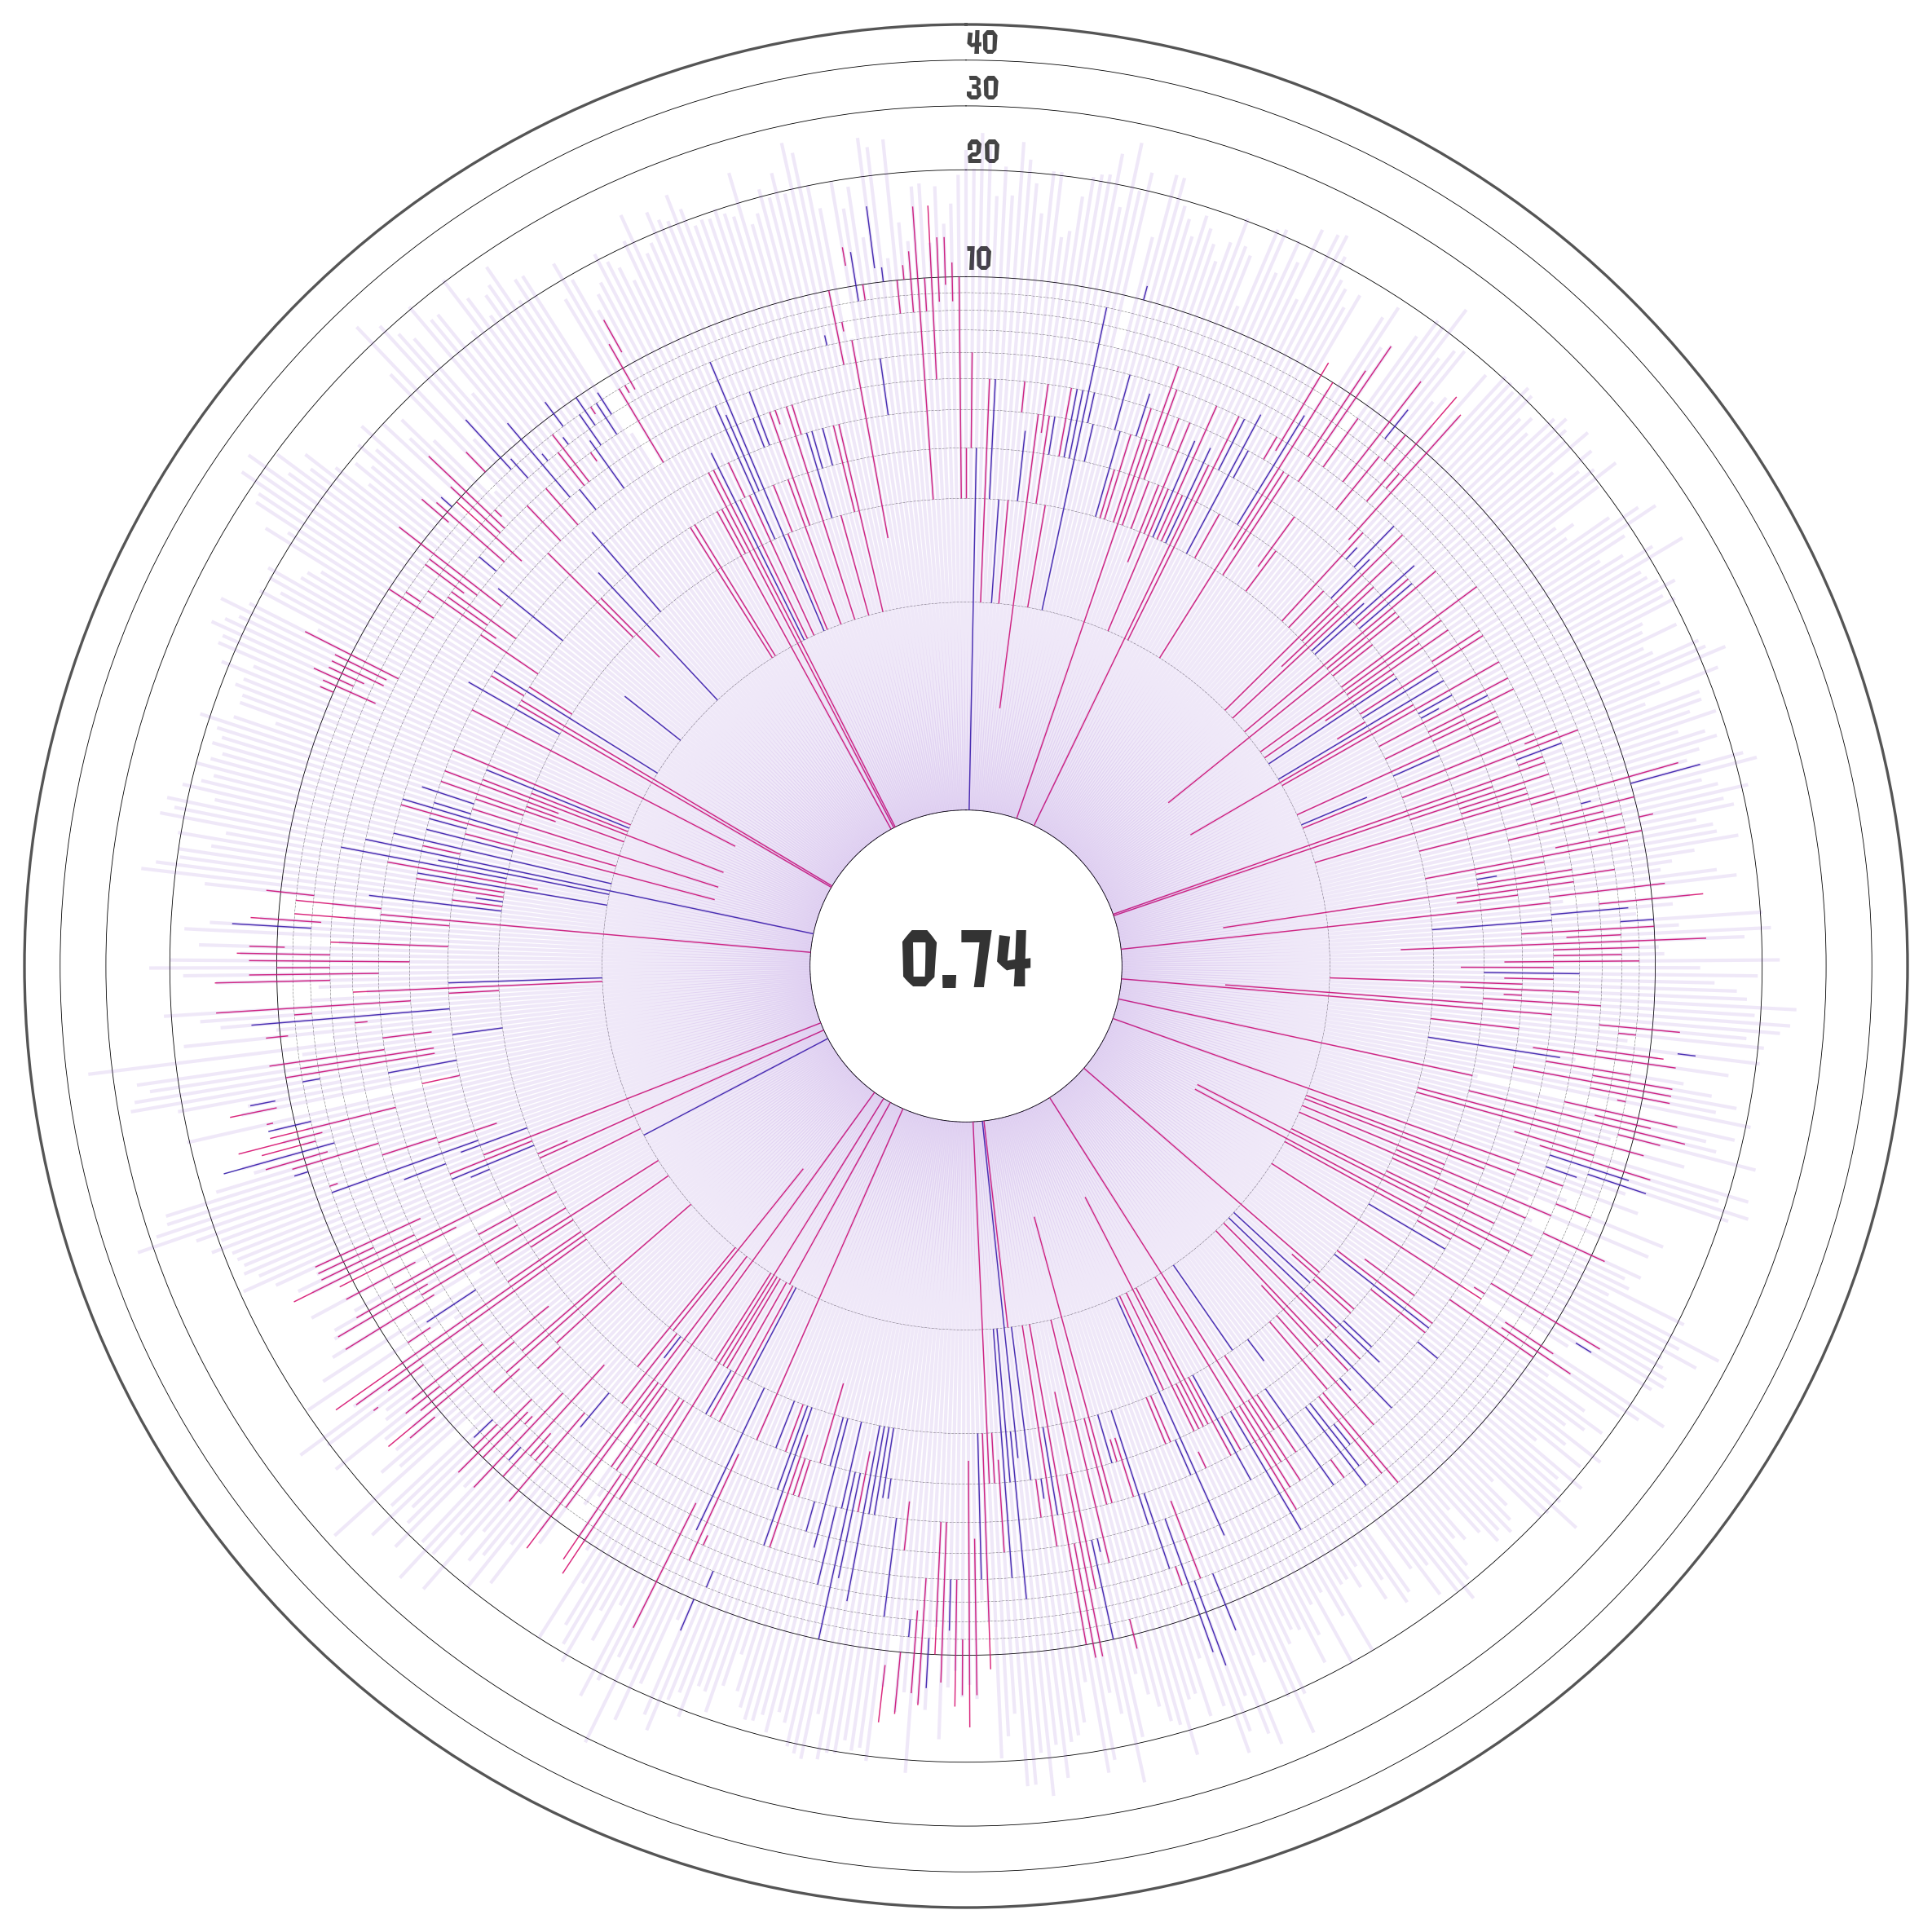
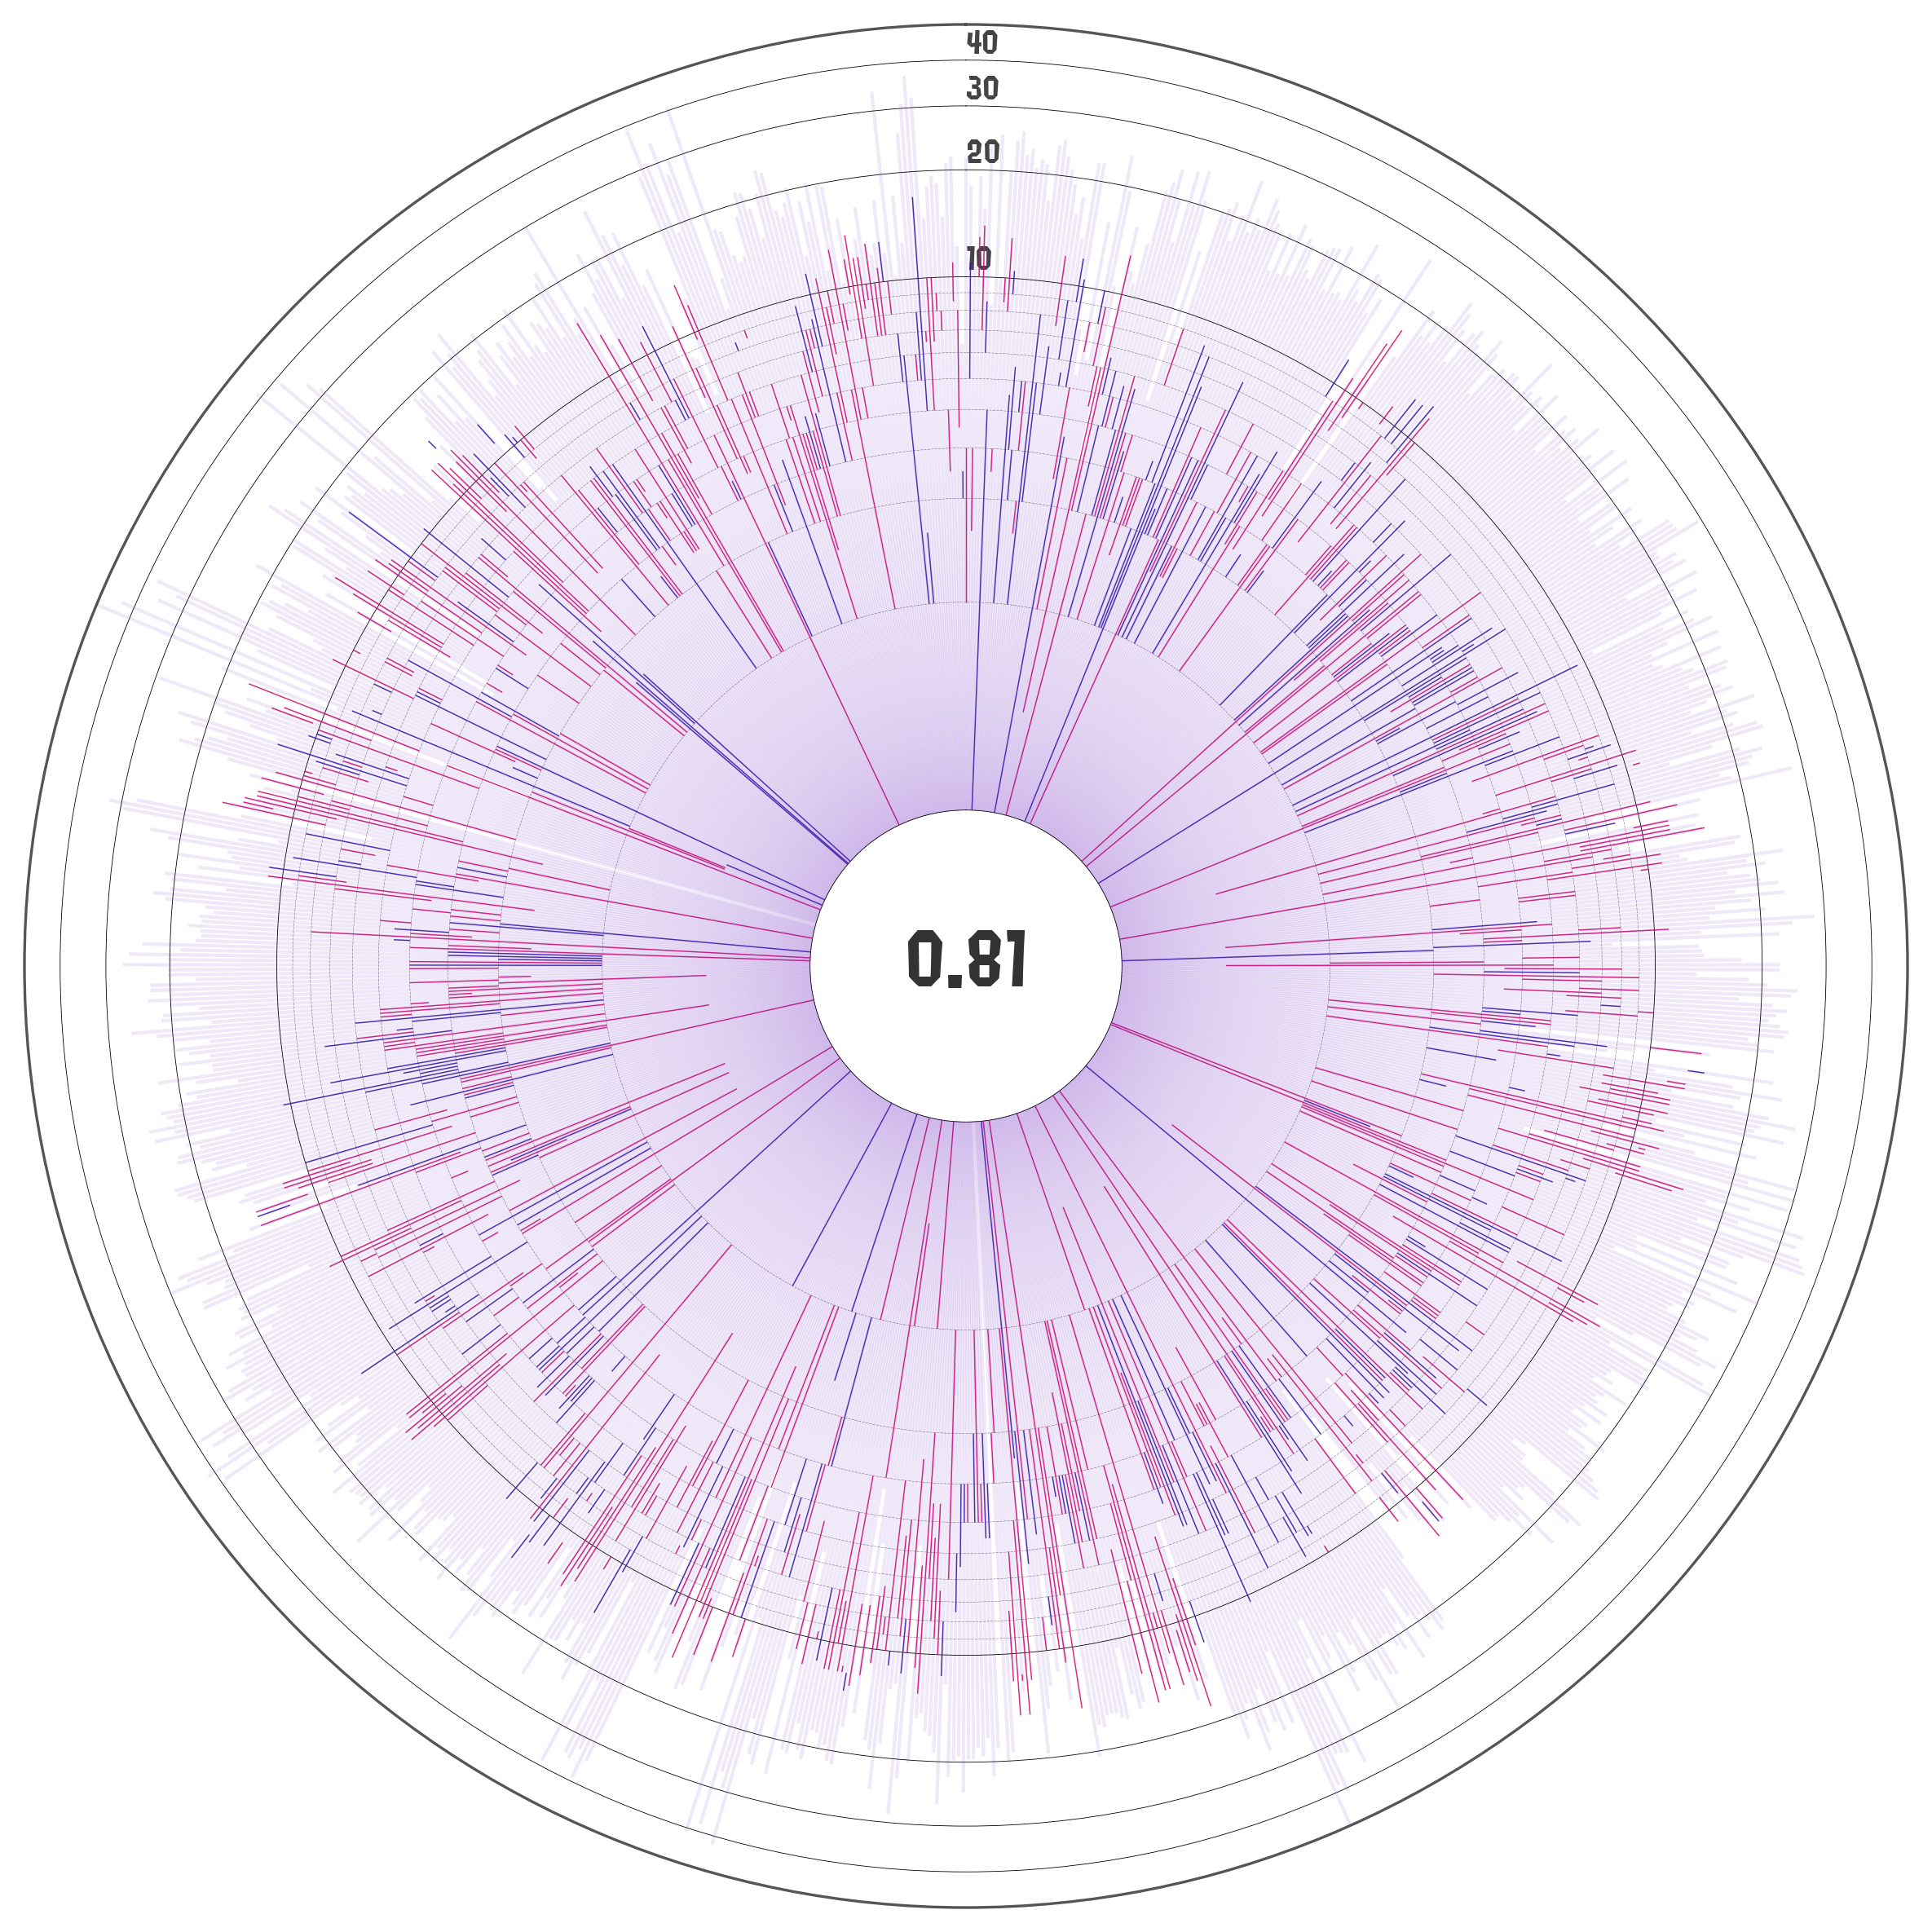
Similar to the matches history panel, these plots show the kill to death ratios as bars but this time they are arranged in a circular pattern to keep it more compact. The radial axis is log-scaled by default with the (kill+1/2*assist) to deaths ratio highlighted at the center of the plot.

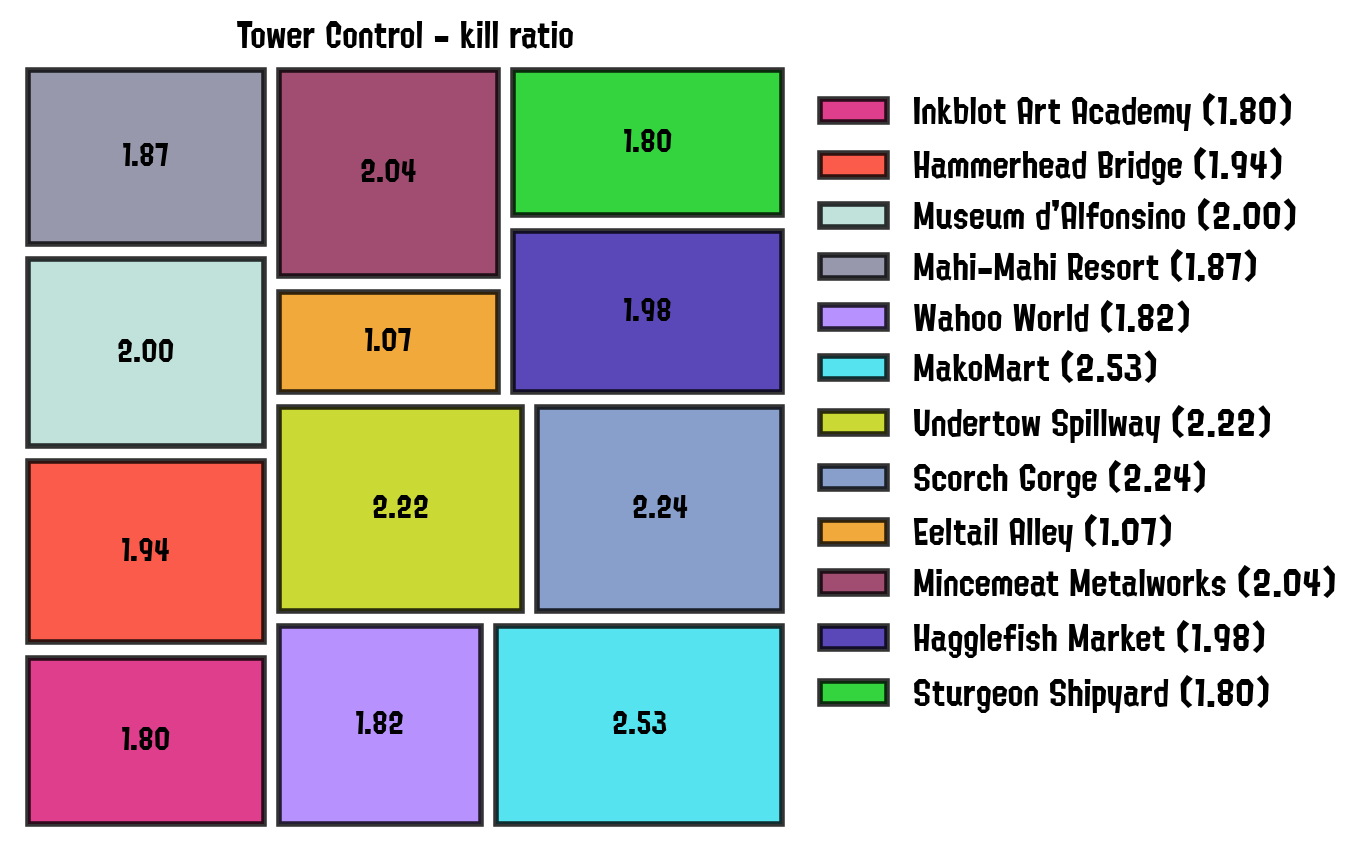
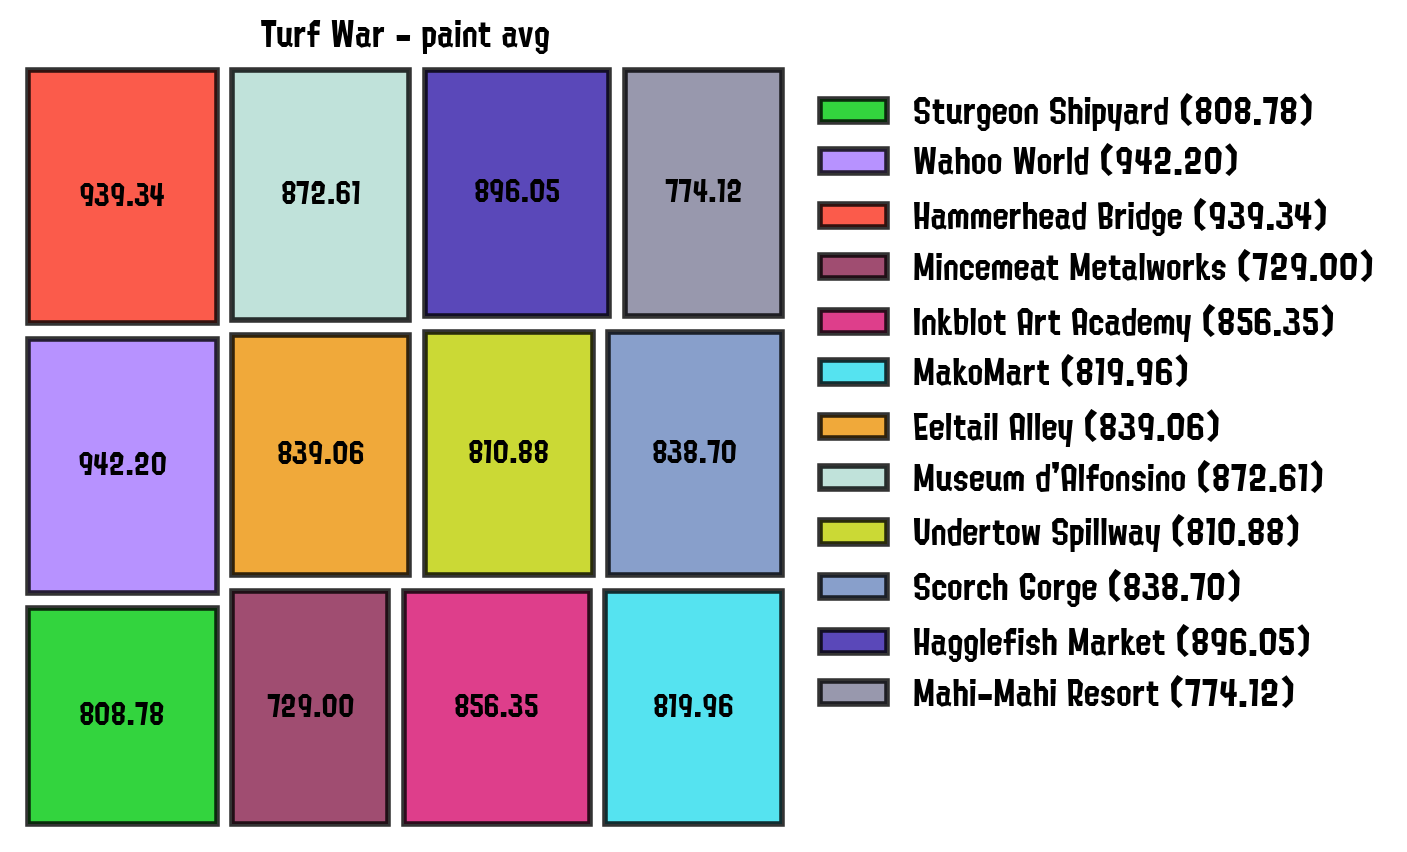
These plots are designed to show which stages are the ones in which the player performs best on any given stage with respect to a selected metric. Auxiliary provided functions generate the statistics dataframe required for these plots, which includes: kills, deaths, win ratio, paint, total matches; amongst many others. These statistics can be also generated for a specific match type (Rainmaker, Turf War, Tower Control, etc), or for a combination of them.

Moreover, these plots can be generated for any arbitrary key in the dataframe: main weapon, sub weapon, head gear, etc.

Author

Check out the blogposts on my website with more information about the development, planned features, and some analyses on my own Splatoon matches data!

Héctor M. Sánchez C. ([email protected])

splatstats's People

Contributors

chipdelmal avatar

Stargazers

 avatar  avatar  avatar  avatar  avatar  avatar  avatar  avatar

Watchers

 avatar  avatar  avatar  avatar

Forkers

cesaregarza

splatstats's Issues

Suppport for X power (ideally for multiple users)

After watching another team create an X power leaderboard for their team over the course of sizzle season 2024, I became interested in doing something similar for my own team leveraging SplatStats. Skimming through the documentation, I don't see any X power or Anarchy Open powers exposed, nor a way to create any plot similar to the ones below.

Would it be possible to implement an X power plot showing both current X power and a plot of the progression over a desired time period? It would be especially nice if multiple players could be rendered on the same plot, but I understand if that is out of scope seeing as the existing plot types all seem to focus on individual results.

Thanks!

image
image

Recommend Projects

  • React photo React

    A declarative, efficient, and flexible JavaScript library for building user interfaces.

  • Vue.js photo Vue.js

    🖖 Vue.js is a progressive, incrementally-adoptable JavaScript framework for building UI on the web.

  • Typescript photo Typescript

    TypeScript is a superset of JavaScript that compiles to clean JavaScript output.

  • TensorFlow photo TensorFlow

    An Open Source Machine Learning Framework for Everyone

  • Django photo Django

    The Web framework for perfectionists with deadlines.

  • D3 photo D3

    Bring data to life with SVG, Canvas and HTML. 📊📈🎉

Recommend Topics

  • javascript

    JavaScript (JS) is a lightweight interpreted programming language with first-class functions.

  • web

    Some thing interesting about web. New door for the world.

  • server

    A server is a program made to process requests and deliver data to clients.

  • Machine learning

    Machine learning is a way of modeling and interpreting data that allows a piece of software to respond intelligently.

  • Game

    Some thing interesting about game, make everyone happy.

Recommend Org

  • Facebook photo Facebook

    We are working to build community through open source technology. NB: members must have two-factor auth.

  • Microsoft photo Microsoft

    Open source projects and samples from Microsoft.

  • Google photo Google

    Google ❤️ Open Source for everyone.

  • D3 photo D3

    Data-Driven Documents codes.