Code Monkey home page Code Monkey logo

stemflow's Introduction

stemflow ๐Ÿฆ

stemflow logo

A Python Package for Adaptive Spatio-Temporal Exploratory Model (AdaSTEM)

GitHub Anaconda version PyPI version Downloads Downloads GitHub last commit codecov status


Documentation ๐Ÿ“–

stemflow Documentation

JOSS paper


Installation ๐Ÿ”ง

pip install stemflow

To install the latest beta version from github:

pip install pip@git+https://github.com/chenyangkang/stemflow.git

Or using conda:

conda install -c conda-forge stemflow

Brief introduction โ„น๏ธ

stemflow is a toolkit for Adaptive Spatio-Temporal Exploratory Model (AdaSTEM [1, 2]) in Python. Typical usage is daily abundance estimation using eBird citizen science data (survey data).

stemflow adopts "split-apply-combine" philosophy. It

  1. Splits input data using Quadtree or Sphere Quadtree.
  2. Trains each spatiotemporal split (called stixel) separately.
  3. Aggregates the ensemble to make the prediction.

The framework leverages the "adjacency" information of surroundings in space and time to model/predict the values of target spatiotemporal points. This framework ameliorates the long-distance/long-range prediction problem [3], and has a good spatiotemporal smoothing effect.

For more information, please see an introduction to stemflow and learning curve analysis


Model and data ๐ŸŽฐ

Main functionality of stemflow Supported indexing Supported tasks
โœ… Spatiotemporal modeling & prediction
โœ… User-defined 2D spatial indexing (CRS)
โœ… Binary classification task
โœ… Calculate overall feature importances
โœ… 3D spherical indexing
โœ… Regression task
โœ… Plot spatiotemporal dynamics
โœ… User-defined temporal indexing
โœ… Hurdle task (two step regression โ€“ classify then regress the non-zero part)
โœ… Spatial-only modeling
For details see AdaSTEM Demo For details and tips see Tips for spatiotemporal indexing For details and tips see Tips for different tasks
Supported data types Supported base models
โœ… Both continuous and categorical features (prefer one-hot encoding)
โœ… sklearn style BaseEstimator classes (you can make your own base model), for example here
โœ… Both static (e.g., yearly mean temperature) and dynamic features (e.g., daily temperature)
โœ… sklearn style Maxent model. Example here.
For details and tips see Tips for data types For details see Base model choices

Usage โญ

Use Hurdle model as the base model of AdaSTEMRegressor:

from stemflow.model.AdaSTEM import AdaSTEM, AdaSTEMClassifier, AdaSTEMRegressor
from stemflow.model.Hurdle import Hurdle
from xgboost import XGBClassifier, XGBRegressor

## "hurdle in Ada"
model = AdaSTEMRegressor(
    base_model=Hurdle(
        classifier=XGBClassifier(tree_method='hist',random_state=42, verbosity = 0, n_jobs=1),
        regressor=XGBRegressor(tree_method='hist',random_state=42, verbosity = 0, n_jobs=1)
    ),                                      # hurdel model for zero-inflated problem (e.g., count)
    save_gridding_plot = True,
    ensemble_fold=10,                       # data are modeled 10 times, each time with jitter and rotation in Quadtree algo
    min_ensemble_required=7,                # Only points covered by > 7 ensembles will be predicted
    grid_len_upper_threshold=25,            # force splitting if the grid length exceeds 25
    grid_len_lower_threshold=5,             # stop splitting if the grid length fall short 5         
    temporal_start=1,                       # The next 4 params define the temporal sliding window
    temporal_end=366,                            
    temporal_step=20,                       # The window takes steps of 20 DOY (see AdaSTEM demo for details)
    temporal_bin_interval=50,               # Each window will contain data of 50 DOY
    points_lower_threshold=50,              # Only stixels with more than 50 samples are trained and used for prediction
    Spatio1='longitude',                    # The next three params define the name of 
    Spatio2='latitude',                     # spatial coordinates shown in the dataframe
    Temporal1='DOY',
    use_temporal_to_train=True,             # In each stixel, whether 'DOY' should be a predictor
    njobs=1
)

Fitting and prediction methods follow the style of sklearn BaseEstimator class:

## fit
model = model.fit(X_train.reset_index(drop=True), y_train)

## predict
pred = model.predict(X_test)
pred = np.where(pred<0, 0, pred)
eval_metrics = AdaSTEM.eval_STEM_res('hurdle',y_test, pred_mean)
print(eval_metrics)

Where the pred is the mean of the predicted values across ensembles.

See AdaSTEM demo for further functionality.
See Optimizing stixel size for why and how you should tune the important gridding parameters.


Plot QuadTree ensembles ๐ŸŒฒ

model.gridding_plot
# Here, the model is a AdaSTEM class, not a hurdle class

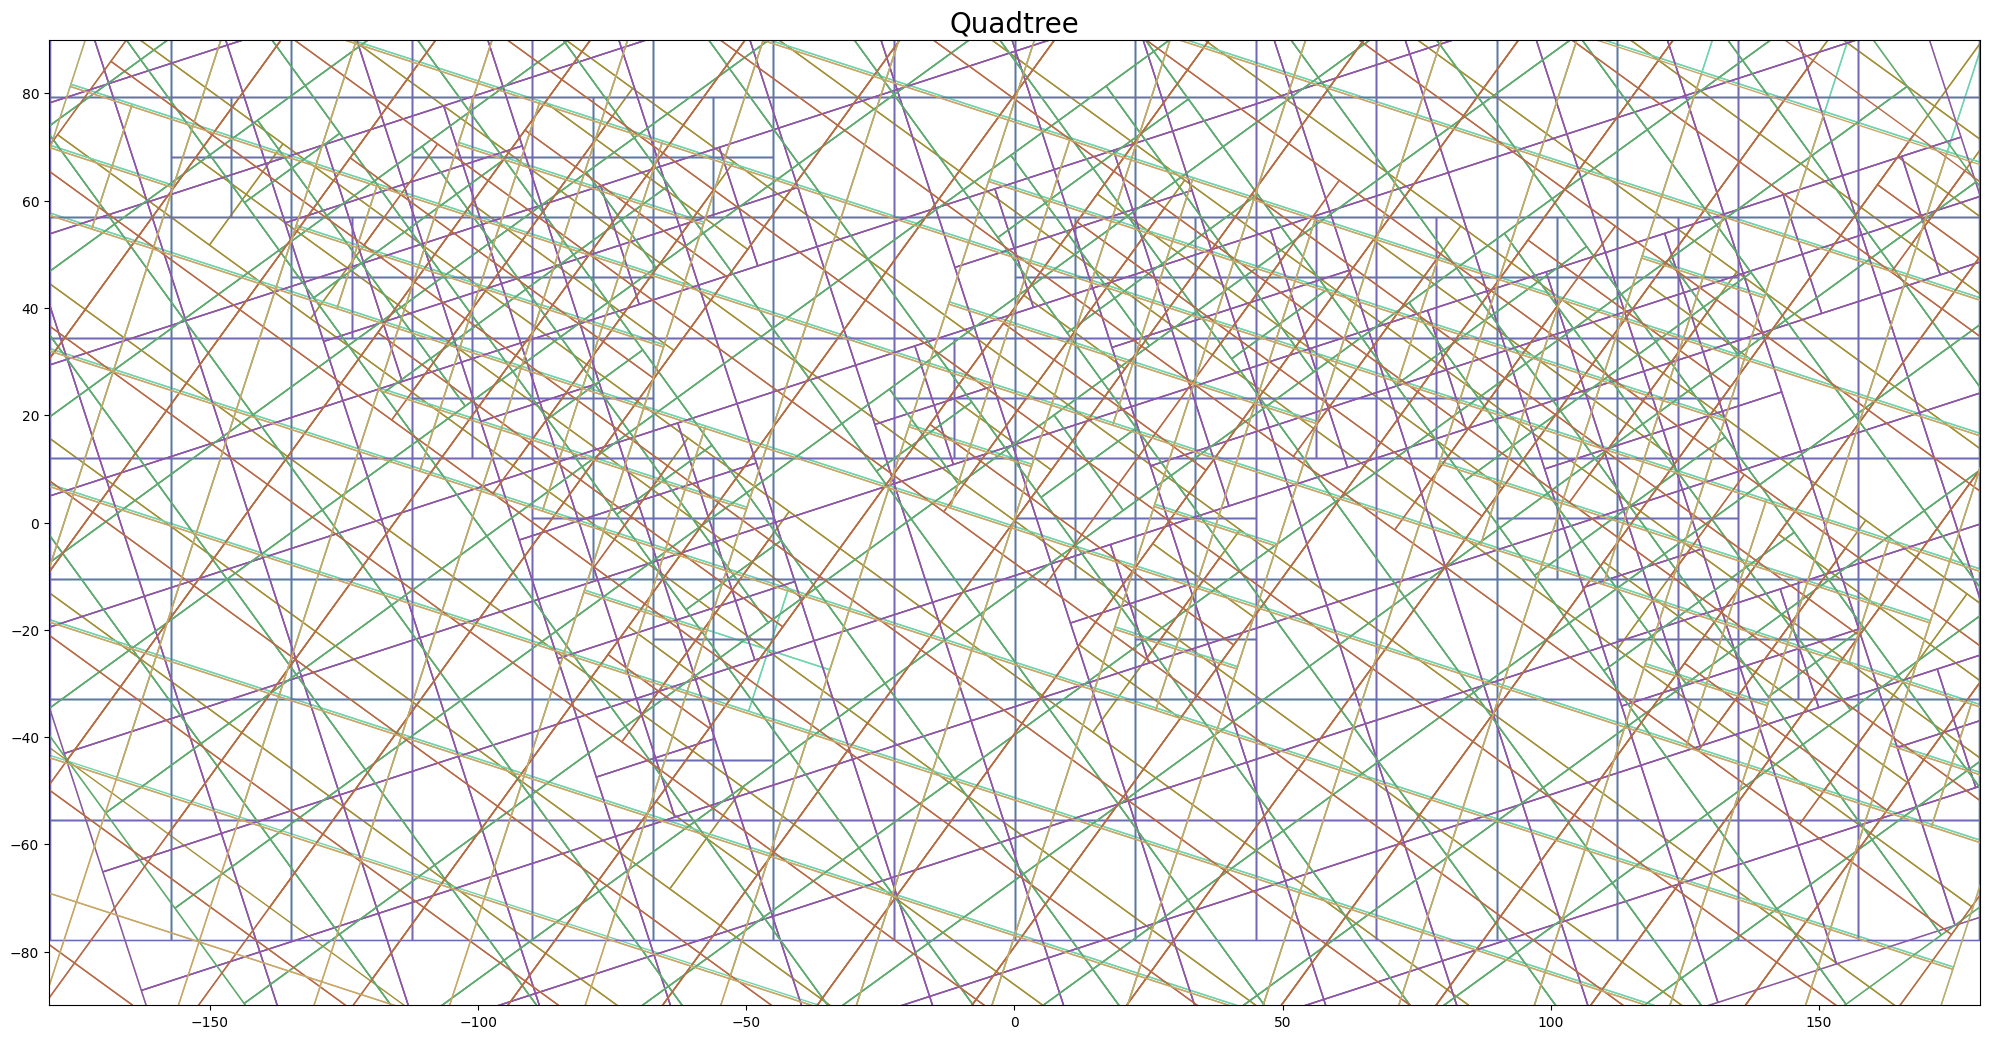
QuadTree example

Here, each color shows an ensemble generated during model fitting. In each of the 10 ensembles, regions (in terms of space and time) with more training samples were gridded into finer resolution, while the sparse one remained coarse. Prediction results were aggregated across the ensembles (that is, in this example, data were modeled 10 times).

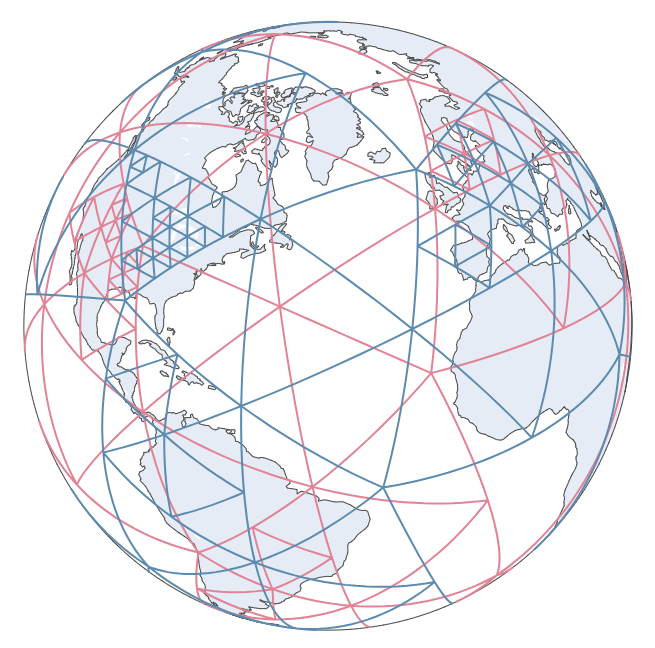
If you use SphereAdaSTEM module, the gridding plot is a plotly generated interactive object by default:

See SphereAdaSTEM demo and Interactive spherical gridding plot.


Example of visualization ๐Ÿ—บ๏ธ

Daily Abundance Map of Barn Swallow

GIF visualization

See section AdaSTEM demo for how to generate this GIF.


Citation

Chen et al., (2024). stemflow: A Python Package for Adaptive Spatio-Temporal Exploratory Model. Journal of Open Source Software, 9(94), 6158, https://doi.org/10.21105/joss.06158

@article{Chen2024, 
  doi = {10.21105/joss.06158}, 
  url = {https://doi.org/10.21105/joss.06158}, 
  year = {2024}, 
  publisher = {The Open Journal}, 
  volume = {9}, 
  number = {94}, 
  pages = {6158}, 
  author = {Yangkang Chen and Zhongru Gu and Xiangjiang Zhan}, 
  title = {stemflow: A Python Package for Adaptive Spatio-Temporal Exploratory Model}, 
  journal = {Journal of Open Source Software} 
}

Contribute to stemflow ๐Ÿ’œ

We welcome pull requests. Contributors should follow contributor guidelines.

Application-level cooperation is also welcomed. We recognized that stemflow may consume large computational resources especially as data volume boosts in the future. We always welcome research collaboration of all kinds.


References:

  1. Fink, D., Damoulas, T., & Dave, J. (2013, June). Adaptive Spatio-Temporal Exploratory Models: Hemisphere-wide species distributions from massively crowdsourced eBird data. In Proceedings of the AAAI Conference on Artificial Intelligence (Vol. 27, No. 1, pp. 1284-1290).

  2. Fink, D., Auer, T., Johnston, A., Ruizโ€Gutierrez, V., Hochachka, W. M., & Kelling, S. (2020). Modeling avian full annual cycle distribution and population trends with citizen science data. Ecological Applications, 30(3), e02056.

  3. Fink, D., Hochachka, W. M., Zuckerberg, B., Winkler, D. W., Shaby, B., Munson, M. A., ... & Kelling, S. (2010). Spatiotemporal exploratory models for broadโ€scale survey data. Ecological Applications, 20(8), 2131-2147.

  4. Johnston, A., Fink, D., Reynolds, M. D., Hochachka, W. M., Sullivan, B. L., Bruns, N. E., ... & Kelling, S. (2015). Abundance models improve spatial and temporal prioritization of conservation resources. Ecological Applications, 25(7), 1749-1756.

stemflow's People

Contributors

chenyangkang avatar

Stargazers

 avatar  avatar  avatar  avatar  avatar  avatar  avatar  avatar  avatar  avatar  avatar  avatar

Watchers

 avatar  avatar  avatar

Forkers

taxingzhang

stemflow's Issues

NAs detection

Add NAs detection and raise errors when X or y input has NAs. #43

[Feature] Make parallel computing available

Is your feature request related to a problem? Please describe.
Add parallel modeling for:

  1. split
  2. fit
  3. predict
  4. assign importance to points

Describe the solution you'd like
Add joblib as parallel backend.

Describe alternatives you've considered
multiprocessing with shared memory

Additional context
Add any other context or screenshots about the feature request here.

[REVIEW] consider updating contributor guidelines

The stemflow README contains a sentence on welcoming contributions, but does not specify how those contributions are best made. There are some nice guides available for providing a contributor guide, and I recommend adding a more detailed guide for users.

[BUG] unique_stixel_id

First, thanks for the package! It seems that it would be very useful for my analyses!

I managed to run the example with your data with no problem :) However, when I try to run it with my own data, the fitting crashes with the error: "unique_stixel_id". Specifically, when I use the function .fit() it seems to Generate Ensemble with no problem but later in the Training it crashes.
I'm working with the crs projection EPSG:3035. I tried to change the grid_len_upper_threshold and grid_len_lower_threshold to change the grid size but I always get the same error. Below is the terminal output for the error. Moreover, attached is some sample data in case you want to try yourself. Do you have any idea why the error is happening?

Thanks in advance!

Traceback (most recent call last):
File "", line 1, in
File "C:\Users\XXXX\AppData\Local\miniconda3\envs\r-reticulate\lib\site-packages\stemflow\model\AdaSTEM.py", line 577, in fit
self.SAC_training(self.ensemble_df, X_train, verbosity, njobs)
File "C:\Users\XXXX\AppData\Local\miniconda3\envs\r-reticulate\lib\site-packages\stemflow\model\AdaSTEM.py", line 526, in SAC_training
for ensemble in output_generator:
File "C:\Users\XXXX\AppData\Local\miniconda3\envs\r-reticulate\lib\site-packages\tqdm\std.py", line 1181, in iter
for obj in iterable:
File "C:\Users\XXXX\AppData\Local\miniconda3\envs\r-reticulate\lib\site-packages\stemflow\model\AdaSTEM.py", line 506, in
output_generator = (self.SAC_ensemble_training(index_df=ensemble[1], data=data) for ensemble in groups)
File "C:\Users\XXXX\AppData\Local\miniconda3\envs\r-reticulate\lib\site-packages\stemflow\model\AdaSTEM.py", line 480, in SAC_ensemble_training
.apply(lambda stixel: self.stixel_fitting(stixel))
File "C:\Users\XXXX\AppData\Local\miniconda3\envs\r-reticulate\lib\site-packages\pandas\core\groupby\groupby.py", line 1846, in apply
return self._python_apply_general(f, self._obj_with_exclusions)
File "C:\Users\XXXX\AppData\Local\miniconda3\envs\r-reticulate\lib\site-packages\pandas\core\groupby\groupby.py", line 1885, in _python_apply_general
values, mutated = self._grouper.apply_groupwise(f, data, self.axis)
File "C:\Users\XXXX\AppData\Local\miniconda3\envs\r-reticulate\lib\site-packages\pandas\core\groupby\ops.py", line 919, in apply_groupwise
res = f(group)
File "C:\Users\XXXX\AppData\Local\miniconda3\envs\r-reticulate\lib\site-packages\stemflow\model\AdaSTEM.py", line 480, in
.apply(lambda stixel: self.stixel_fitting(stixel))
File "C:\Users\XXXX\AppData\Local\miniconda3\envs\r-reticulate\lib\site-packages\stemflow\model\AdaSTEM.py", line 403, in stixel_fitting
unique_stixel_id = stixel["unique_stixel_id"].iloc[0]
File "C:\Users\XXXX\AppData\Local\miniconda3\envs\r-reticulate\lib\site-packages\pandas\core\frame.py", line 4102, in getitem
indexer = self.columns.get_loc(key)
File "C:\Users\XXXX\AppData\Local\miniconda3\envs\r-reticulate\lib\site-packages\pandas\core\indexes\base.py", line 3812, in get_loc
raise KeyError(key) from err
KeyError: 'unique_stixel_id'

Sample data:
traindata_sample.csv

Watermark:
image

[Feature] STEM module

STEM module will allow users to keep the stixel size fixed, rather than adaptive. This is to solve the issue partial to #23 . It's a quite large project so I open an independent issue.

[REVIEW] consider adding automated testing

Automated testing is a best practice for open source projects, reducing the risk of software regression through breaking changes. stemflow includes a mini_test module that appears to test many parts of the software, but this is run manually. I recommend adding automated tests in CI to verify (and to provide verification to users) that the software continues to function as expected.

[JOSS review] Add spherical indexing system

This issue is to solve the problem suggested by [at]jedalong (openjournals/joss-reviews#6158)

I think it is probably associated with the tools used for modelling that do not expect spatial objects, but binning the data correctly based on spatial objects and then back transforming to the expected data structure migth be a more correct way to deal with the spherical geometry issue.

TODO:

  1. Implement spherical indexing system

[JOSS review] paper revision

This issue is opened for paper revision suggested by [at]jedalong (openjournals/joss-reviews#6158)

original comments:

L10 - I think you need to explain what AdaSTEM is more explicitly at the beginning of the abstract similar to line 32 so the reader knows what this is.
L18 consider rephrasing this sentence.
L26 - consider rephrasing 'mine its merits'
L79 - rephrase 'mounting'
L85 - rephrase this entire sentence, not sure this is what you mean, confusing 'dependency conjugated with bias in data abundance'?
L89 - rephrase 'potentials'

[JOSS review] Improve cartesian indexing system

This issue is to solve the problems in cartesian indexing system. Suggestions proposed by [at]jedalong (openjournals/joss-reviews#6158)


In the mallard example you use 50 spatial and temporal blocks for the global distribution of mallards.
That is, if the data X have longitude ranging from (-180, 180), latitude ranging from (-90, 90), and whole year data (1, 366), each block will approximately contain data of 7.2 longitude (about 720km), 3.6 latitude (about 360km), and 7 days, which approximately catch the spatiotemporal scale of bird migration. These are rough estimates to get a sense of the scale.

One degree of longitude is always about 110km so 7.2 km is about 792 km. The big issue is that 1 degree of latitude varies from 110km at the equator to 0 km at the poles, so the area of your blocks varies greatly from equator to pole. Gridding data on the globe without accounting for the spherical geometry of the earth is problematic (your package is not alone in ignoring this major issue). Could you instead allow the users to pass in spatial objects or define bins based on actual geometry so that bins are more equally sized to reflect global distribution data.

TODO:

  1. Edit the notebook. Change the specific number (720km? 792km?) and add caveat for distortion problem towards the poles.2.
  2. Allow user to pass parameters of actual geometry.

To me it would be more approparite for a user to pass in a single parameter associated with the desired output spatial resolution of the grid size (e.g., grids with a size of 100km x 100km) and then the package would create the grid on the fly from a single parameter. You expecte 4 parameters for this same gridding process? I note that your package s does not force grid cells to be square in area, which is IMO unusual.

TODO:
3. reduce the number of parameters.


This issue is further demonstrated in the Tips section for using a different coordinate system where the user must pass in 1000 to 10000 m as the range for "latitude" and "longitude" values in another coordinate system that does not use latidtude and longitude but rather x and y.

TODO:
4. Not related but consider: Allow concrete gridding parameters instead of only "adaptive".

[REVIEW] JOSS feedback

Hi @chenyangkang,

I'm providing my review of stemflow here in this issue. I don't have many detailed software issues, since the package installs correctly and works as demonstrated in the documentation, for what I've tested. I have a few other comments that I believe will improve user experience.

First, thank you for preparing this package. It is a valuable contribution to the community. The goals of my comments are to make it easier for others to use this package with their own data. It is very easy to run the examples provided using pre-processed data, but there appears to be a series of assumptions regarding how these data should be formatted that are not clear.

Since this package is designed around spatial and temporal data, it would help to clarify how time and space are encoded in the model. Do input dataframes require a DOY column? Does anything change if data are provided at other temporal scales (weekly, monthly, yearly, etc.)? I see latitude and longitude encoded in the mini test data - is that the only supported CRS? I see that geopandas is a dependency - does the model class support passing a GeoDataFrame, or do you need to explicitly encode column names?

Next, I think more guidance regarding feature data could be provided. I was assuming most of the input covariates would be datasets that are temporally resolved at a similar scale as the abundance data (e.g. daily NDVI). But it looks like the mini_data example is nearly all static features, with DOY being the only dynamic variable. Is this how other datasets are expected to be formatted? Can users provide a combination of static and dynamic covariates? Are categorical features supported? More clarification regarding best practices for how to extract and format covariate data would help a lot.

The example notebooks provide clear usage examples, but there is little to no explanation of why certain routines are performed. There are titles for groups of code, but little contextual information. In the intro notebook, for example, why were the parameters Spatio_blocks_count=50, Temporal_blocks_count=50 selected? what would turning these numbers up and down do? What are the grid_len_{}_{}_threshold parameters, and what do those defaults encode? Tracing back to the original function is often still challenging, as there are many parameters with slightly varying names that are still hard to understand. As a user I would appreciate more narrative clarification.

There are lots of great features in this package and in the documentation that I don't feel like I understand as well as I would like to. I'm not familiar with the Hurdle modeling approach, which seems great and appears foundational to AdaSTEM - tips on best practices here would be valuable. You mentioned using other base models from sklearn in the manuscript - when would this be advantageous? You also provide great examples for comparing learning curves and optimizing strixel sizes, but these notebooks are just code blocks with some plots and little interpretation. I found myself wanting more guidance for how to interpret these results, or even guidance on why such optimization is important (do you optimize strixel size to minimize overfitting, for example?).

Overall, I think this is a great package and will make a valuable contribution to the growing ecosystem of python biogeography tools. I mostly recommend providing more guidance to users for how to best use this valuable resource.

Cheers,

[JOSS review] Documentation revision

This issue is to solve the problem suggested by [at]jedalong (openjournals/joss-reviews#6158)

What is the difference between temporal_step and temporal_bin_interval? I didnt follow the whole 'sliding' window part of this are they bins/blocks or a moving window?

Documentation Notes:
Rephrase: stemflow have 4 important gridding parameters. Actually only two:
The maximum grid length, and the minimum grid length. It can be separately set by longitude and latitude, and that will be 4.

TODO:

  1. Add documentation on sliding window.
  2. Add docs on the difference between temporal_step and temporal_bin_interval .
  3. Revise the gridding params docs.

Recommend Projects

  • React photo React

    A declarative, efficient, and flexible JavaScript library for building user interfaces.

  • Vue.js photo Vue.js

    ๐Ÿ–– Vue.js is a progressive, incrementally-adoptable JavaScript framework for building UI on the web.

  • Typescript photo Typescript

    TypeScript is a superset of JavaScript that compiles to clean JavaScript output.

  • TensorFlow photo TensorFlow

    An Open Source Machine Learning Framework for Everyone

  • Django photo Django

    The Web framework for perfectionists with deadlines.

  • D3 photo D3

    Bring data to life with SVG, Canvas and HTML. ๐Ÿ“Š๐Ÿ“ˆ๐ŸŽ‰

Recommend Topics

  • javascript

    JavaScript (JS) is a lightweight interpreted programming language with first-class functions.

  • web

    Some thing interesting about web. New door for the world.

  • server

    A server is a program made to process requests and deliver data to clients.

  • Machine learning

    Machine learning is a way of modeling and interpreting data that allows a piece of software to respond intelligently.

  • Game

    Some thing interesting about game, make everyone happy.

Recommend Org

  • Facebook photo Facebook

    We are working to build community through open source technology. NB: members must have two-factor auth.

  • Microsoft photo Microsoft

    Open source projects and samples from Microsoft.

  • Google photo Google

    Google โค๏ธ Open Source for everyone.

  • D3 photo D3

    Data-Driven Documents codes.