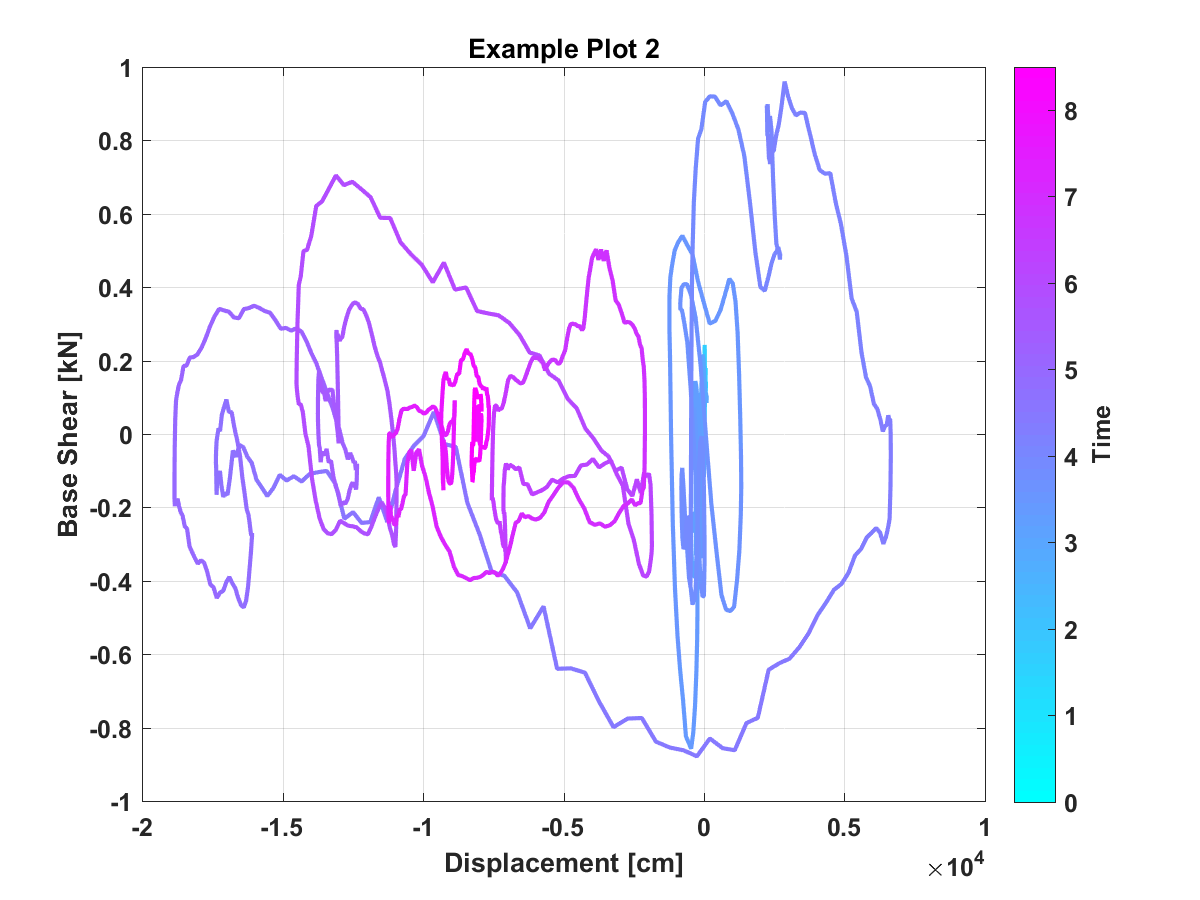
Data visualization script in MATLAB which creates three-dimensional material hysteresis loops, with time as a color gradient along the path of the loops.
NOTE: Script requires all .xls, .xlsx, and .csv files to be in the same directory as the script. All spreadsheet files must have x-axis data in the first column and y-axis data in the second column.
EXAMPLE OUTPUT: