Code Monkey home page Code Monkey logo

map's Introduction

mAP (mean Average Precision)

GitHub stars

This code will evaluate the performance of your neural net for object recognition.

In practice, a higher mAP value indicates a better performance of your neural net, given your ground-truth and set of classes.

Citation

This project was developed for the following paper, please consider citing it:

@INPROCEEDINGS{8594067,
  author={J. {Cartucho} and R. {Ventura} and M. {Veloso}},
  booktitle={2018 IEEE/RSJ International Conference on Intelligent Robots and Systems (IROS)}, 
  title={Robust Object Recognition Through Symbiotic Deep Learning In Mobile Robots}, 
  year={2018},
  pages={2336-2341},
}

Table of contents

Explanation

The performance of your neural net will be judged using the mAP criterium defined in the PASCAL VOC 2012 competition. We simply adapted the official Matlab code into Python (in our tests they both give the same results).

First (1.), we calculate the Average Precision (AP), for each of the classes present in the ground-truth. Finally (2.), we calculate the mAP (mean Average Precision) value.

1. Calculate AP

For each class:

First, your neural net detection-results are sorted by decreasing confidence and are assigned to ground-truth objects. We have "a match" when they share the same label and an IoU >= 0.5 (Intersection over Union greater than 50%). This "match" is considered a true positive if that ground-truth object has not been already used (to avoid multiple detections of the same object).

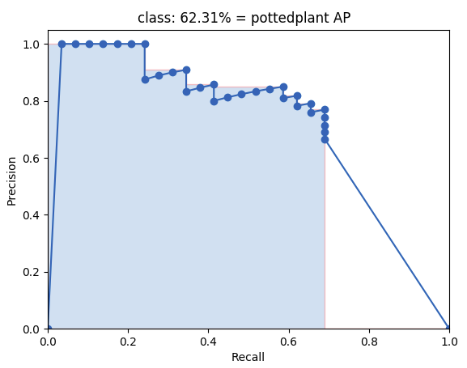
Using this criterium, we calculate the precision/recall curve. E.g:

Then we compute a version of the measured precision/recall curve with precision monotonically decreasing (shown in light red), by setting the precision for recall r to the maximum precision obtained for any recall r' > r.

Finally, we compute the AP as the area under this curve (shown in light blue) by numerical integration. No approximation is involved since the curve is piecewise constant.

2. Calculate mAP

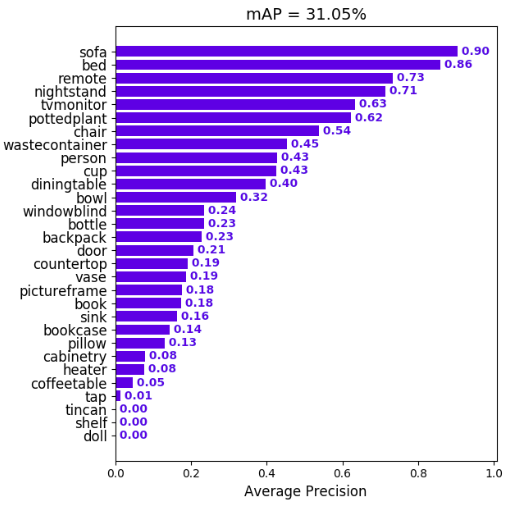
We calculate the mean of all the AP's, resulting in an mAP value from 0 to 100%. E.g:

Prerequisites

You need to install:

Optional:

  • plot the results by installing Matplotlib - Linux, macOS and Windows:
    1. python -mpip install -U pip
    2. python -mpip install -U matplotlib
  • show animation by installing OpenCV:
    1. python -mpip install -U pip
    2. python -mpip install -U opencv-python

Quick-start

To start using the mAP you need to clone the repo:

git clone https://github.com/Cartucho/mAP

Running the code

Step by step:

  1. Create the ground-truth files
  2. Copy the ground-truth files into the folder input/ground-truth/
  3. Create the detection-results files
  4. Copy the detection-results files into the folder input/detection-results/
  5. Run the code: python main.py

Optional (if you want to see the animation):

  1. Insert the images into the folder input/images-optional/

PASCAL VOC, Darkflow and YOLO users

In the scripts/extra folder you can find additional scripts to convert PASCAL VOC, darkflow and YOLO files into the required format.

Create the ground-truth files

  • Create a separate ground-truth text file for each image.
  • Use matching names for the files (e.g. image: "image_1.jpg", ground-truth: "image_1.txt").
  • In these files, each line should be in the following format:
    <class_name> <left> <top> <right> <bottom> [<difficult>]
    
  • The difficult parameter is optional, use it if you want the calculation to ignore a specific detection.
  • E.g. "image_1.txt":
    tvmonitor 2 10 173 238
    book 439 157 556 241
    book 437 246 518 351 difficult
    pottedplant 272 190 316 259
    

Create the detection-results files

  • Create a separate detection-results text file for each image.
  • Use matching names for the files (e.g. image: "image_1.jpg", detection-results: "image_1.txt").
  • In these files, each line should be in the following format:
    <class_name> <confidence> <left> <top> <right> <bottom>
    
  • E.g. "image_1.txt":
    tvmonitor 0.471781 0 13 174 244
    cup 0.414941 274 226 301 265
    book 0.460851 429 219 528 247
    chair 0.292345 0 199 88 436
    book 0.269833 433 260 506 336
    

Authors:

  • João Cartucho

    Feel free to contribute

    GitHub contributors

map's People

Contributors

cartucho avatar gustavovaliati avatar jeallybeans avatar jo-tham avatar k-maheshkumar avatar laxos96 avatar leyuan avatar nh1922 avatar oalsing avatar offchan42 avatar timlueg avatar viniciusarruda avatar

Stargazers

 avatar  avatar  avatar  avatar  avatar  avatar  avatar  avatar  avatar  avatar  avatar  avatar  avatar  avatar  avatar  avatar  avatar  avatar  avatar  avatar  avatar  avatar  avatar  avatar  avatar  avatar  avatar  avatar  avatar  avatar  avatar  avatar  avatar  avatar  avatar  avatar  avatar  avatar  avatar  avatar  avatar  avatar  avatar  avatar  avatar  avatar  avatar  avatar  avatar  avatar  avatar  avatar  avatar  avatar  avatar  avatar  avatar  avatar  avatar  avatar  avatar  avatar  avatar  avatar  avatar  avatar  avatar  avatar  avatar  avatar  avatar  avatar  avatar  avatar  avatar  avatar  avatar  avatar  avatar  avatar  avatar  avatar  avatar  avatar  avatar  avatar  avatar  avatar  avatar  avatar  avatar  avatar  avatar  avatar  avatar  avatar  avatar  avatar  avatar  avatar

Watchers

 avatar  avatar  avatar  avatar  avatar  avatar  avatar  avatar  avatar  avatar  avatar  avatar  avatar  avatar  avatar  avatar  avatar  avatar  avatar  avatar  avatar  avatar  avatar  avatar  avatar  avatar  avatar  avatar  avatar  avatar  avatar  avatar  avatar  avatar  avatar  avatar  avatar  avatar  avatar

map's Issues

R_P curve graph

When I run the main.py, there are not R_P curve graph, do need it plot by coding myself?

missing a '+' in convert_pred_yolo.py

Hi, @Cartucho

First of all, I want to thank you for this wonderful mAP code.
I am using darknet and darkflow. This code helps me benchmark their performance much easier.

Here is a small problem I'd like to report.
This is probably a typo:
in the file extra/convert_pred_yolo.py line 82: a missing '+' before "str(left)"

Thank you.

Why cannot show bb for mutiple objects?

I trained my dataset with yolo. and then I calculated mAP using this repo. But the output shows only the bounding boxes although there are 4 bounding boxes. Why? How can I get with multiple bounding boxes in my output result?
hand_prediction10

Error Message: "if there are no classes to ignore then replace None by empty list"

Hi,

I got the following error message when running main.py.

---> 19 args = parser.parse_args()
20
21 # if there are no classes to ignore then replace None by empty list

I am only detecting one class e.g. person. In some images, there are no people hence I leave a blank file each for these images. Does the error message mean I need to append a word None in the empty text file for all the images where there is no detected person?

Thanks,
Lobbie

TypeError : integer argument expected, got float

Hello @Cartucho , this repo improvement is so great.
I got some error in this update, like this
image

Maybe this is because i have no predict any "Platelets", when i have 3 classes (RBC, WBC, platelets)
I hope you can solve this, thank you.

prjeddie/darknet Results Format

The prjeddie Darknet implementation https://github.com/pjreddie/darknet produces separate result files for each class in the result folder. I'm just wondering how I can consolidate them to work with your implementation?

In your extras README it mentioned running Darknet with darknet.exe and I know that the prjeddie version doesn't support Windows so which implementation are you expecting the output from? I could probably work on hunting down the answer myself if I could get that.

mAP question

Hello @Cartucho i have some question about mAP.
as far as i know the mAP is method for evaluate object detection task, but i have confuse for the result.
I try to set a different threshold and i got mAP and predicted object. when i set the threshold very low (0.01) i got higher mAP but more false prediciton and when i set the threshold to 0.5 i got lower mAP but fewer false prediction, like pic below
image

image

i'm newbie in object detection, but i think the more false prediction mean lower mAP, am i right ?
another question, is the mAP doesn't represent the object detection performance ? or there are another way to evaluate object detection task ?

i'm sorry when this question is not proper to ask here, if yes i will close/delete it asap.
thank you.

Possibility to have class specific overlap threshold

At first glance, your repo looks nice. You have lots of illustrations to explain the interpolated average precision which is really nice. However, is it possible to have a different threshold for different classes? For example, on the KITTI benchmark, the cars require an IoU over 70% to be considered as a correct detection while the pedestrians require 50%.

New Features Discussion

Calculating AP for each class given the PR (Precision Recall) curve.
tvmonitor

Calculating the mAP:
map

About Map

I have some models to test map:
the first model map is 99.9% we called A
the second model map is 99.9% too,we called B
can we say both A and B are good?
But the result A's Fp =2 , the resut B's Fp=109,obviously the model B seems not good
the input boundingbox txt values are generated by opencv, and the confidence score was set very small value 0.005.
I am confused how to evalute the models, and when use the model at actual situation, how to set the confidence score?

Confused about confidence

Hi!

First off thank you for creating this repo. I've been looking for something to test the accuracy of my data.

I trained and tested following AlexeyAB's step by step guide. Everything works well. But now when I go for testing using this repo I was curious about how to get confidence for the predicted object files. I see that in the extras folder there is a script to convert from YOLO to the predicted format but the way mine works is I run the command to test a single picture so how would that work trying to save for mAP? I think I need to have bounding boxes of predictions similar to my labels but am unsure of how to do this. Any help is appreciated. Thank you!

class_list.txt

Hi, thanks for your nice codes.
I modified class_list.txt and then run main.py,
It shows aeroplane AP, bicycle AP, bird AP ,... regardless of the class_list file.
How can I change this?

Threshold for detection

Hello,

I'm training yolov2 on 248 of my own classes using Darkflow.

I found your great repo to evaluate my training (thanks alot)!

I am using a set of 100k images to train and a set of 1k images to evaluate my model while training (training on one gpu and evaluating at the same time on an other gpu). My goal is to find the sweet spot to decrease my learning rate and continue with the training.

I have been trying a few things out and here is what I got:

step 47 750, detection threshold of 0.5 gives me mAP of 18.95
step 47 750, detection threshold of 0.2 gives me mAP of 39.68
step 47 750, detection threshold of 0.1 gives me mAP of 44.71
step 47 750, detection threshold of 0.01 gives me mAP of 46.34

step 52 500, detection threshold of 0.5 gives me mAP of 31.73
step 52 500, detection threshold of 0.2 gives me mAP of 52.56
step 52 500, detection threshold of 0.1 gives me mAP of 56.18
step 52 500, detection threshold of 0.01 gives me mAP of 57.42

My conclusion here is that the model is still learning and I should keep going.

My question, what detection threshold should I be using ? Does it make a difference if my goal is only to evaluate one step to an other ? Should I keep calculating many of them like this ?

Thanks

Animation and Row Order of Objects

Hi,

Just wondering if it is true that the animation will show the boundary boxes of predictions, or where gt and predictions overlapped? I.e. ground truth boxes without predictions overlapping will not be shown?

Does the row order of objects in the prediction files matter? Example for Image A, the ground truth has 3 cars and the row order of the cars in the ground truth file is sorted by xmin in ascending order. However, the prediction is ordered by car 2, car 1 and then car 3.

cheers,
Lobbie

mAP calculation for yoloV2 and yoloV2-tiny-voc

I have taken the latest config and weigths file from https://pjreddie.com/darknet/yolov2/ and used https://github.com/Cartucho/mAP/tree/master to calculate mAP with considering difficult ground truths however i am getting around 73% for yolov2-voc and around 53% for tiny yolov2-voc which is around 4% inferior to mAP mentioned at https://pjreddie.com/darknet/yolov2/. I have used following command to generate the prediction for 4952 VOC 2007 test images ./flow --imgdir sample_img/ --model cfg/yolov2-tiny-voc.cfg --load bin/yolov2-tiny-voc.weights --json --gpu 1.0 --threshold 0.001.
./flow --imgdir sample_img/ --model cfg/yolov2-voc.cfg --load bin/yolov2-voc.weights --json --gpu 1.0 --threshold 0.001

Please let me know if i missed something

No detection result in image

Hello @Cartucho,

What if there is no detection result in some image, but the ground truth does? My project contains some small difficult objects to detect.

Thank you.

YOLOv3 mAP

Hi, I was trying to use your code with YOLOv3, but I have some problems to make predictions txt files.
With ./darknet detector test cfg/voc.data yolo-voc.cfg yolo-voc.weights -dont_show -ext_output < data/train.txt > result.txt I can generate a unique txt file with all results, but I really don't have idea how to parse it.
This is an example of result.txt file:
<Total BFLOPS 65.864

seen 64
Enter Image Path: data/horses.jpg: Predicted in 42.076185 seconds.
horse: 88% (left_x: 3 top_y: 185 width: 150 height: 167)
horse: 99% (left_x: 5 top_y: 198 width: 307 height: 214)
horse: 96% (left_x: 236 top_y: 180 width: 215 height: 169)
horse: 99% (left_x: 440 top_y: 209 width: 156 height: 142)
Enter Image Path: data/person.jpg: Predicted in 41.767213 seconds.
dog: 99% (left_x: 58 top_y: 262 width: 147 height: 89)
person: 100% (left_x: 190 top_y: 95 width: 86 height: 284)
horse: 100% (left_x: 394 top_y: 137 width: 215 height: 206)
Enter Image Path: >

Thank you so much for your help.

Convert different format .xml and .json

Hallo @Cartucho, i am newbie in computer programming i got frustrated to search how to calculate mAP, i think this is good repo for that.
But i have some problem, i use darkflow to train my own data. The result of test data prediction is .json file format like this (to fill in predicted folder)

[{"label": "RBC", "confidence": 0.98, "topleft": {"x": 252, "y": 0}, "bottomright": {"x": 373, "y": 81}} . . . ]

and annotation in .xml like this (to fill in ground-truth folder)
image

i think information for ground-truth and predicted is enough for run in your repo but this form in different format. Do you have any suggestion how to convert both of that to match in your repo ?

thanks in advance and sorry for my bad English

KITTI mAP higher than what this code gives

As far as I know this code is based on the PASCAL VOC definition of mAP. When I use the KITTI's evaluation tool I consistently get a higher mAP as opposed to using this one. Is the any difference between them?
Any help is appreciated. Thank you for the code.

Yolo-V3 results are matching with original paper results

map

I used darknet yolo-v3(alexeyAB) to predict the validation 5000 images from COCO2014 which gives mAP of 54.37%

detections_count = 237764, unique_truth_count = 35757
class_id = 0, name = person, ap = 70.23 %
class_id = 1, name = bicycle, ap = 51.34 %
class_id = 2, name = car, ap = 59.17 %
class_id = 3, name = motorbike, ap = 66.61 %
class_id = 4, name = aeroplane, ap = 74.85 %
class_id = 5, name = bus, ap = 82.59 %
class_id = 6, name = train, ap = 78.15 %
class_id = 7, name = truck, ap = 53.73 %
class_id = 8, name = boat, ap = 46.05 %
class_id = 9, name = traffic light, ap = 49.60 %
class_id = 10, name = fire hydrant, ap = 79.95 %
class_id = 11, name = stop sign, ap = 75.76 %
class_id = 12, name = parking meter, ap = 55.05 %
class_id = 13, name = bench, ap = 35.32 %
class_id = 14, name = bird, ap = 45.61 %
class_id = 15, name = cat, ap = 78.01 %
class_id = 16, name = dog, ap = 78.04 %
class_id = 17, name = horse, ap = 74.77 %
class_id = 18, name = sheep, ap = 56.76 %
class_id = 19, name = cow, ap = 54.29 %
class_id = 20, name = elephant, ap = 83.35 %
class_id = 21, name = bear, ap = 79.79 %
class_id = 22, name = zebra, ap = 78.85 %
class_id = 23, name = giraffe, ap = 85.39 %
class_id = 24, name = backpack, ap = 34.76 %
class_id = 25, name = umbrella, ap = 57.99 %
class_id = 26, name = handbag, ap = 24.16 %
class_id = 27, name = tie, ap = 50.52 %
class_id = 28, name = suitcase, ap = 48.95 %
class_id = 29, name = frisbee, ap = 74.17 %
class_id = 30, name = skis, ap = 39.38 %
class_id = 31, name = snowboard, ap = 49.56 %
class_id = 32, name = sports ball, ap = 59.74 %
class_id = 33, name = kite, ap = 44.62 %
class_id = 34, name = baseball bat, ap = 50.73 %
class_id = 35, name = baseball glove, ap = 50.52 %
class_id = 36, name = skateboard, ap = 68.65 %
class_id = 37, name = surfboard, ap = 63.51 %
class_id = 38, name = tennis racket, ap = 71.90 %
class_id = 39, name = bottle, ap = 44.34 %
class_id = 40, name = wine glass, ap = 52.10 %
class_id = 41, name = cup, ap = 50.68 %
class_id = 42, name = fork, ap = 40.13 %
class_id = 43, name = knife, ap = 31.97 %
class_id = 44, name = spoon, ap = 28.30 %
class_id = 45, name = bowl, ap = 50.64 %
class_id = 46, name = banana, ap = 34.18 %
class_id = 47, name = apple, ap = 20.15 %
class_id = 48, name = sandwich, ap = 51.30 %
class_id = 49, name = orange, ap = 34.27 %
class_id = 50, name = broccoli, ap = 33.78 %
class_id = 51, name = carrot, ap = 25.55 %
class_id = 52, name = hot dog, ap = 43.00 %
class_id = 53, name = pizza, ap = 59.55 %
class_id = 54, name = donut, ap = 45.72 %
class_id = 55, name = cake, ap = 50.14 %
class_id = 56, name = chair, ap = 44.06 %
class_id = 57, name = sofa, ap = 59.58 %
class_id = 58, name = pottedplant, ap = 44.44 %
class_id = 59, name = bed, ap = 67.93 %
class_id = 60, name = diningtable, ap = 46.87 %
class_id = 61, name = toilet, ap = 75.49 %
class_id = 62, name = tvmonitor, ap = 74.30 %
class_id = 63, name = laptop, ap = 70.49 %
class_id = 64, name = mouse, ap = 71.63 %
class_id = 65, name = remote, ap = 48.55 %
class_id = 66, name = keyboard, ap = 67.07 %
class_id = 67, name = cell phone, ap = 43.15 %
class_id = 68, name = microwave, ap = 70.85 %
class_id = 69, name = oven, ap = 51.24 %
class_id = 70, name = toaster, ap = 17.49 %
class_id = 71, name = sink, ap = 59.61 %
class_id = 72, name = refrigerator, ap = 72.01 %
class_id = 73, name = book, ap = 17.17 %
class_id = 74, name = clock, ap = 72.50 %
class_id = 75, name = vase, ap = 51.54 %
class_id = 76, name = scissors, ap = 39.51 %
class_id = 77, name = teddy bear, ap = 59.71 %
class_id = 78, name = hair drier, ap = 9.48 %
class_id = 79, name = toothbrush, ap = 36.30 %
for thresh = 0.25, precision = 0.61, recall = 0.51, F1-score = 0.56
for thresh = 0.25, TP = 18389, FP = 11799, FN = 17368, average IoU = 48.14 %

mean average precision (mAP) = 0.543651, or 54.37 %
Total Detection Time: 227.000000 Seconds

I found your code to add some visualizations for the results. But it gives the mAP of 45.74% only. I didnt change any files in your code. Both AlexeyAB implementation and yours kept the IOU-Threshold of 0.5 but gives different result for AP@50 even in each classes.

Data Format

Hi,

I have my ground truth in Pascal VOC formal which I'm planning to extract the coordinates of the objects my images contain. Pascal VOC xml files have coordinates as:
xmin: 235
ymin: 100
xmax: 324
ymax: 171

what is the proper order to use for your implementation since you your format is:
left, top,right,bottom?

Thanks!

Why one class appear?

Hi Cartucho. thanks for metrix

My question is in extra/class_list.txt should I change the list that I want to get metrix??

When I run your code only one class('Bus') which is even not in the 'class_list.txt' can be calculated.

Thanks.

Questions

Hello @Cartucho
Thank you for all your support. This repo is extremely helpful.

I have few questions. Could you please help me.
I have 1 class and predicted using tinyYolo
Q1 ) How should we know which threshold is best to choose?
at 0.1 Threshold I got mAP : 63.07% , lamr : 0.52 , FP : 3942 and TP 1460.
at 0.3 Threshold mAP : 59.72% , lamr : 0.52 , FP : 861 and TP 1325.
at 0.5 Threshold mAP : 52.24% , lamr : 0.57 , FP : 861 and TP 1121

So. Is there a way to find an optimal threshold at one go?

Q2.) What is the difference between lamr and ROC? (I am not clear with both terms)

Q3 ) Is there any difference between IOUThreshold and threshold?If so could you please explain.

Sorry. If the question look dumb or illogical. I am new to the topic

Thank you for your time.

Cannot understand this error

Traceback (most recent call last):
File "main.py", line 215, in
class_name, left, top, right, bottom = line.split()
ValueError: too many values to unpack

Fail to show bounding box in multiple object

Hello @Cartucho i want to ask you something about image result.
i got a different bounding box picture between mAP result folder and my actual prediction, like this
sa_w_51_50
actual prediction
basofil_prediction17
image from mAP result folder

this happen when there is a multiple object in one image.
do you know why ?
thank you sir

AP and mAP is 0

Even though I have correctly converted ground-truth .xml files and predicted .json files in .txt files. I'm running python path/to/main.py --no-plot (because it gives me an 'unpacking error' I cannot solve). Any ideas why?

I donot understand readme

there is no json file in readme,but json file need to be read in code,I want to the format of json file?

TypeError : unorderable type : str() > int ()

Hello @Cartucho, there is error in your new feature (always from me 😆 ).
image

i think this error occur because i have 0 prediction for "eosinofil" (0% AP). This error make your new graph not generate in the result folder.
Thank you, as usual this is will be easy for you. 😆

Question Regarding the Shape of mAP Graphs Produced by this Repository

@Cartucho

As seen in the below image taken from your ReadMe. Why is there a linear segment in the graph stretching from 0.65 Recall to 1 Recall? I see the same thing when I test my own results. It looks like no points are being plotted after 0.65 Recall and that a linear line is drawn from the last plotted point to the intercept (1,0).

I previously thought that the curve was produced by plotting precision vs recall as our confidence threshold was decreased until 0. I.e. As 0 confidence corresponds to 1 recall, I would expect to see plotted points along the x-axis up until the point that recall reaches 1. If you have any insight into how I might be misunderstanding this, I would be interested in hearing your thoughts.

image

IndexError: list index out of range

Hello @Cartucho i've tried your repo, when i run main.py without any change in your repo (ground truth, images, and predicted folder) i got some error says

Traceback (most recent call last):
File "main.py", line 178, in
file_id = file_id.split("/",1)[1]
IndexError: list index out of range

i'm using
windows 10
python 3.6.4 using anaconda 3
opencv 3.4.1
matplotlib 2.2.2

thanks in advance

NameError : name 'xrange' is not defined

I have new issue with this repo, but i am little confuse with this problem
When i run main.py all the function run well, i got mAP score, class AP curve, and number of object per class diagram but i got error says :

Traceback (most recent call last):
File "main.py", line 476, in
plt.xticks(xrange(n_classes), rotation='vertical')
NameError : name 'xrange' is not defined

maybe i miss some diagram like mAP diagram showing average precision for each class

i use
windows 10
python 3.5.2
matplotlib 2.2.2

Errror while running main.py

I get the follwoing error:
(tensorflow1) C:\Users\gvadakku\Downloads\mAP-master>python main.py
Traceback (most recent call last):
File "main.py", line 555, in
bbgt = [ int(x) for x in gt_match["bbox"].split() ]
File "main.py", line 555, in
bbgt = [ int(x) for x in gt_match["bbox"].split() ]
ValueError: invalid literal for int() with base 10: '407.0'

Is it some kind of bug or the issue is with my data

Getting very high MAP values

Hi,
I have my own data on which I have trained YOLO and trying to use your method to verify the MAP values, however, I am obtaining a result of ~98% which is too high (I calculated it using darknet v3 repo: https://github.com/AlexeyAB/darknet#how-to-calculate-map-on-pascalvoc-2007 as well, which gave me a result of ~80%). I can see that there are FP and TN from the visualizations so this high value seems weird. From top of your head, can you think of what might be the reason? I am attaching snaps of some results.
ground-truth info
map
predicted objects info

Can I modify the confidence

"class_name, confidence, left, top, right, bottom"

can I remove the confidence or set it 0.5 to create the predicted objects files?
because my code couldn't generate confidence after running.
Is it influences result a lot?

thanks for help.

True positive vs False Positive

Logic tells me that both these counts should have a considerable affect on the mAP value. However only true positive seems to matter when I run this code. Even when the false positive count goes down considerably, the mAP does not increase while if the true positive count goes a little higher up mAP increases a lot. Are you sure this is how it is supposed to work? Personally I do not think so. Is there any explanation for why this is happening?

ZeroDivisionError

Thanks for your wonderful repo, but I got the following problem.
I use parameters with different epoch to detect the same dataset (epoch_50.pth, epoch_90.pth.....), for example, detection results of epoch_50.pth can get the right AP, but when I use the results of epoch_90.pth, main.py will return ZeroDivisionError(line 589). I am confused why could this happen, please help me.

precision values goes to zero

I see that the precision values go to zero and the recall goes to one.
Can you please explain if this is correct? and why?

Precision: ['0.00', '1.00', '1.00', '1.00', '1.00', '1.00', '1.00', '1.00', '1.00', '1.00', '1.00', '1.00', '1.00', '1.00', '1.00', '1.00', '1.00', '1.00', '1.00', '1.00', '1.00', '1.00', '1.00', '1.00', '1.00', '1.00', '1.00', '1.00', '1.00', '1.00', '1.00', '1.00', '1.00', '1.00', '1.00', '1.00', '1.00', '1.00', '1.00', '1.00', '1.00', '1.00', '1.00', '1.00', '1.00', '1.00', '1.00', '1.00', '1.00', '1.00', '1.00', '1.00', '1.00', '1.00', '1.00', '1.00', '1.00', '1.00', '1.00', '1.00', '1.00', '1.00', '1.00', '1.00', '1.00', '1.00', '1.00', '1.00', '1.00', '0.99', '0.99', '0.99', '0.99', '0.99', '0.99', '0.99', '0.99', '0.99', '0.99', '0.99', '0.99', '0.99', '0.99', '0.99', '0.99', '0.99', '0.99', '0.99', '0.99', '0.98', '0.98', '0.98', '0.98', '0.98', '0.98', '0.98', '0.98', '0.98', '0.98', '0.98', '0.98', '0.98', '0.98', '0.98', '0.98', '0.98', '0.98', '0.98', '0.98', '0.98', '0.98', '0.98', '0.98', '0.98', '0.98', '0.98', '0.98', '0.98', '0.98', '0.98', '0.98', '0.98', '0.98', '0.98', '0.98', '0.98', '0.98', '0.98', '0.98', '0.98', '0.98', '0.98', '0.98', '0.98', '0.99', '0.99', '0.99', '0.99', '0.99', '0.99', '0.99', '0.99', '0.99', '0.99', '0.99', '0.99', '0.99', '0.99', '0.99', '0.99', '0.99', '0.99', '0.99', '0.99', '0.99', '0.99', '0.99', '0.99', '0.99', '0.99', '0.99', '0.99', '0.99', '0.99', '0.99', '0.99', '0.99', '0.99', '0.99', '0.98', '0.98', '0.98', '0.98', '0.98', '0.98', '0.98', '0.98', '0.98', '0.98', '0.98', '0.98', '0.98', '0.98', '0.98', '0.98', '0.98', '0.98', '0.98', '0.98', '0.98', '0.98', '0.98', '0.98', '0.98', '0.98', '0.98', '0.98', '0.98', '0.98', '0.98', '0.98', '0.99', '0.99', '0.99', '0.99', '0.99', '0.99', '0.99', '0.99', '0.99', '0.99', '0.99', '0.99', '0.99', '0.99', '0.99', '0.99', '0.99', '0.99', '0.99', '0.99', '0.99', '0.99', '0.99', '0.99', '0.99', '0.99', '0.99', '0.98', '0.98', '0.98', '0.98', '0.98', '0.98', '0.98', '0.98', '0.98', '0.98', '0.98', '0.98', '0.98', '0.98', '0.98', '0.98', '0.98', '0.98', '0.98', '0.98', '0.98', '0.98', '0.98', '0.98', '0.98', '0.98', '0.98', '0.98', '0.98', '0.98', '0.97', '0.97', '0.97', '0.97', '0.97', '0.97', '0.97', '0.97', '0.97', '0.97', '0.97', '0.97', '0.97', '0.97', '0.97', '0.96', '0.96', '0.96', '0.96', '0.96', '0.96', '0.96', '0.96', '0.96', '0.96', '0.96', '0.96', '0.96', '0.95', '0.95', '0.95', '0.95', '0.94', '0.95', '0.95', '0.95', '0.95', '0.95', '0.95', '0.95', '0.95', '0.95', '0.94', '0.00']
Recall :['0.00', '0.00', '0.01', '0.01', '0.01', '0.02', '0.02', '0.02', '0.03', '0.03', '0.03', '0.04', '0.04', '0.04', '0.05', '0.05', '0.05', '0.06', '0.06', '0.06', '0.07', '0.07', '0.07', '0.08', '0.08', '0.08', '0.09', '0.09', '0.09', '0.10', '0.10', '0.10', '0.11', '0.11', '0.11', '0.12', '0.12', '0.12', '0.13', '0.13', '0.13', '0.14', '0.14', '0.14', '0.15', '0.15', '0.15', '0.16', '0.16', '0.16', '0.17', '0.17', '0.17', '0.18', '0.18', '0.18', '0.19', '0.19', '0.19', '0.20', '0.20', '0.20', '0.21', '0.21', '0.21', '0.22', '0.22', '0.22', '0.23', '0.23', '0.23', '0.23', '0.24', '0.24', '0.24', '0.25', '0.25', '0.25', '0.26', '0.26', '0.26', '0.27', '0.27', '0.27', '0.28', '0.28', '0.28', '0.29', '0.29', '0.29', '0.29', '0.30', '0.30', '0.30', '0.31', '0.31', '0.31', '0.32', '0.32', '0.32', '0.33', '0.33', '0.33', '0.34', '0.34', '0.34', '0.35', '0.35', '0.35', '0.36', '0.36', '0.36', '0.37', '0.37', '0.37', '0.38', '0.38', '0.38', '0.39', '0.39', '0.39', '0.40', '0.40', '0.40', '0.41', '0.41', '0.41', '0.42', '0.42', '0.42', '0.43', '0.43', '0.43', '0.44', '0.44', '0.44', '0.45', '0.45', '0.45', '0.46', '0.46', '0.46', '0.47', '0.47', '0.47', '0.48', '0.48', '0.48', '0.49', '0.49', '0.49', '0.50', '0.50', '0.50', '0.51', '0.51', '0.51', '0.52', '0.52', '0.52', '0.53', '0.53', '0.53', '0.54', '0.54', '0.54', '0.55', '0.55', '0.55', '0.55', '0.56', '0.56', '0.56', '0.57', '0.57', '0.57', '0.58', '0.58', '0.58', '0.59', '0.59', '0.59', '0.60', '0.60', '0.60', '0.61', '0.61', '0.61', '0.62', '0.62', '0.62', '0.63', '0.63', '0.63', '0.64', '0.64', '0.64', '0.65', '0.65', '0.65', '0.66', '0.66', '0.66', '0.67', '0.67', '0.67', '0.68', '0.68', '0.68', '0.69', '0.69', '0.69', '0.70', '0.70', '0.70', '0.71', '0.71', '0.71', '0.72', '0.72', '0.72', '0.73', '0.73', '0.73', '0.74', '0.74', '0.74', '0.75', '0.75', '0.75', '0.75', '0.76', '0.76', '0.76', '0.77', '0.77', '0.77', '0.78', '0.78', '0.78', '0.78', '0.79', '0.79', '0.79', '0.80', '0.80', '0.80', '0.81', '0.81', '0.81', '0.82', '0.82', '0.82', '0.82', '0.83', '0.83', '0.83', '0.84', '0.84', '0.84', '0.84', '0.84', '0.85', '0.85', '0.85', '0.86', '0.86', '0.86', '0.87', '0.87', '0.87', '0.88', '0.88', '0.88', '0.88', '0.88', '0.89', '0.89', '0.89', '0.90', '0.90', '0.90', '0.90', '0.90', '0.91', '0.91', '0.91', '0.91', '0.91', '0.91', '0.91', '0.92', '0.92', '0.92', '0.93', '0.93', '0.93', '0.94', '0.94', '0.94', '0.94', '1.00']

class

hi,thanks for your code. But I want to know how to use this program to detect the face class I defined? In my dataset it just one class.

Recommend Projects

  • React photo React

    A declarative, efficient, and flexible JavaScript library for building user interfaces.

  • Vue.js photo Vue.js

    🖖 Vue.js is a progressive, incrementally-adoptable JavaScript framework for building UI on the web.

  • Typescript photo Typescript

    TypeScript is a superset of JavaScript that compiles to clean JavaScript output.

  • TensorFlow photo TensorFlow

    An Open Source Machine Learning Framework for Everyone

  • Django photo Django

    The Web framework for perfectionists with deadlines.

  • D3 photo D3

    Bring data to life with SVG, Canvas and HTML. 📊📈🎉

Recommend Topics

  • javascript

    JavaScript (JS) is a lightweight interpreted programming language with first-class functions.

  • web

    Some thing interesting about web. New door for the world.

  • server

    A server is a program made to process requests and deliver data to clients.

  • Machine learning

    Machine learning is a way of modeling and interpreting data that allows a piece of software to respond intelligently.

  • Game

    Some thing interesting about game, make everyone happy.

Recommend Org

  • Facebook photo Facebook

    We are working to build community through open source technology. NB: members must have two-factor auth.

  • Microsoft photo Microsoft

    Open source projects and samples from Microsoft.

  • Google photo Google

    Google ❤️ Open Source for everyone.

  • D3 photo D3

    Data-Driven Documents codes.