LineChartView is a subclass of NSView. It can be used to easily represent numeric values on a line graph.
let ratesValues = [19.10, 19.34, 19.25, 19.50, 19.30, 19.70, 19.55, 19.60, 19.20, 19.3, 19.10, 19.0]
let xValues = Array(1...12)
let frame = CGRect(x: 0, y: 0, width: 400, height: 600)
Create an instance of LineChartView:
let diagram = LineChartView<Int, Double>(frame: frame)
diagram.data(xPoints: xValues, yPoints: ratesValues)
or
let diagram = LineChartView<Int, Double>(frame: diagramView.frame, xValues: xValues, yValues: ratesValues)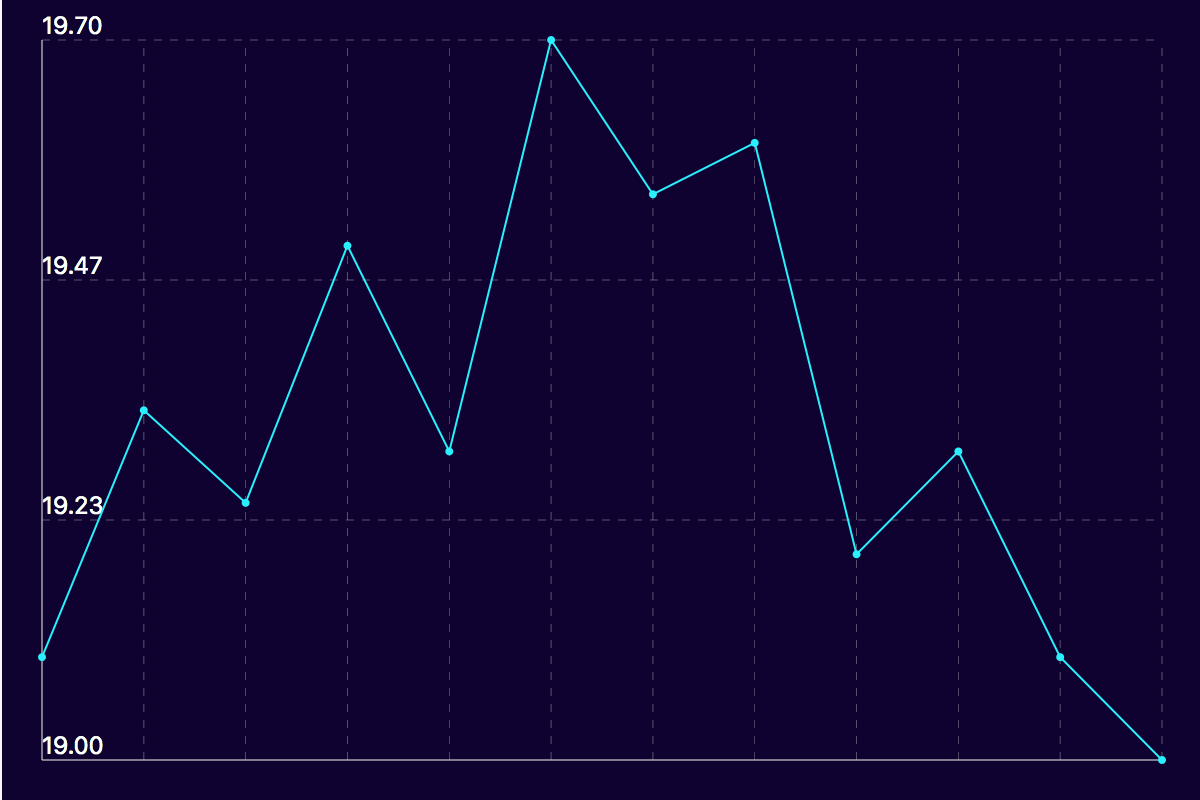
Style LineChartView by changing properties
diagram.chartLineWidth = 0.4
diagram.chartLineColour = NSColor(red: 1, green: 0.5, blue: 1, alpha: 1)
diagram.chartPointColour = NSColor(red: 1, green: 0.3, blue: 1, alpha: 1)
diagram.yAxisLabelsNumberOfDecimal = 1
diagram.chartPointRadius = 4
diagram.yAxisUnitStep = 0.21
diagram.padding = 40
diagram.labelsColor(color: NSColor(red: 0.55, green: 1, blue: 0.4, alpha: 1))
diagram.hideYGridlines = true
diagram.hideXGridlines = true
diagram.hideYAxisLabels = true

let font = NSFont.systemFont(ofSize: 8, weight: .ultraLight)
diagram.editAttributes(font: font, color: NSColor(red: 1, green: 1, blue: 0, alpha: 1))

