Code Monkey home page Code Monkey logo

react-native-pathjs-charts's Introduction

** Capital One built this project to help our engineers as well as users in the react native community. We have decided to focus on alternatives to react native, and, unfortunately, we are no longer able to fully support the project. We have archived the project oas of Mar 1 2018 where it will be available in a read-only state. Feel free to fork the project and maintain your own version. **

react-native-pathjs-charts

npm version

This library is a cross-platform (iOS/Android) library of charts/graphs using react-native-svg and paths-js based on the excellent work done by Roman Samec in the react-pathjs-chart library. The project is an early attempt at providing a ubiquitous solution for charts & graphs for React Native that offer a unified view across devices.

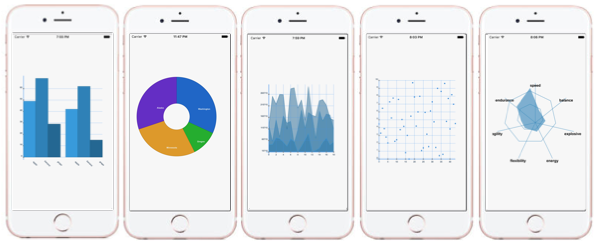
Components include Pie charts, Bar charts, Smoothline charts, Stockline charts, Scatterplots, Tree graphs and Radar graphs. Since Paths-Js makes no assumptions about rendering, this library is perfect for using SVG path objects to render custom charts easily.

This library is in its early stages, but I welcome contributors who would like to help make this the charting solution for React Native. Many of our mobile experiences need to create dashboards. Up to now, we've only been seeing libraries that are native bridges. Wouldn't it be great to have a cross platform solution that just worked?

Installation

To add the library to your React Native project:

npm install react-native-pathjs-charts --save
react-native link react-native-svg

For further information on usage, see the docs

Current Features

  • Pie, Bar, Smoothline, Stockline, Scatterplot, Tree and Radar graphs
  • Configuration of format, labels, colors, axis, ticks, lines
  • No touch support (yet)
  • No animations (yet)
  • Chart information configurable based on data parameters which specify which variables are accessors
  • Rendering works on iOS/Android
  • No native dependencies for linking (except linking required by react-native-svg)

Example Application

To run the example application (from a cloned repo):

cd example
npm install
react-native link react-native-svg
react-native run-ios
# or
react-native run-android

Developing and Testing With The Example App

As you are working on changing src files in this library and testing those changes against the example app, it is necessary to copy files to example/node_modules/react-native-pathjs-charts each time a change is made. To automate this, a sync-rnpc script has been added that will create a background process to watch for src file changes and automatically copy them. To enable this:

cd example
npm run sync-rnpc

Todo

For this library to really shine, there are a lot of improvements to be made. Here are some of my top ideas:

  • Add basic animations to draw the charts
  • Add touch functionality (as the react-native-svg library adds touch features)
  • Add the ability to absolutely position regular React-Native views in relation to SVG chart elements
  • More chart types
  • More axis controls (to control scale)
  • Add View component support to allow custom components instead of message when no data appears
  • Events
  • More documentation, information on configuration
  • Extended examples
  • Bug fixing, unit testing, cleanup
  • CICD pipeline with confirmed build success

Contributing

Contributors: We welcome your interest in Capital One’s Open Source Projects (the “Project”). Any Contributor to the project must accept and sign a CLA indicating agreement to the license terms. Except for the license granted in this CLA to Capital One and to recipients of software distributed by Capital One, you reserve all right, title, and interest in and to your contributions; this CLA does not impact your rights to use your own contributions for any other purpose.

Link to CLA

This project adheres to the Open Source Code of Conduct. By participating, you are expected to honor this code.

react-native-pathjs-charts's People

Contributors

caledhwa avatar ctscoville avatar dgladkov avatar dupk avatar edencakir avatar hineshmandalia avatar katscott avatar kensongoo avatar kurtsergey avatar maarekj avatar marzolfb avatar melkayam92 avatar microwavesafe avatar minishlink avatar mlabrum avatar santhisridharan avatar shagamii avatar simchashats avatar superandrew213 avatar tonyneel923 avatar

Stargazers

 avatar  avatar  avatar  avatar  avatar  avatar  avatar  avatar  avatar  avatar  avatar  avatar  avatar  avatar  avatar  avatar  avatar  avatar  avatar  avatar  avatar  avatar  avatar  avatar  avatar  avatar  avatar  avatar  avatar  avatar  avatar  avatar  avatar  avatar  avatar  avatar  avatar  avatar  avatar  avatar  avatar  avatar  avatar  avatar  avatar  avatar  avatar  avatar  avatar  avatar  avatar  avatar  avatar  avatar  avatar  avatar  avatar  avatar  avatar  avatar  avatar  avatar  avatar  avatar  avatar  avatar  avatar  avatar  avatar  avatar  avatar  avatar  avatar  avatar  avatar  avatar  avatar  avatar  avatar  avatar  avatar  avatar  avatar  avatar  avatar  avatar  avatar  avatar  avatar  avatar  avatar  avatar  avatar  avatar  avatar  avatar  avatar  avatar  avatar  avatar

Watchers

 avatar  avatar  avatar  avatar  avatar  avatar  avatar  avatar  avatar  avatar  avatar  avatar  avatar  avatar  avatar  avatar  avatar  avatar  avatar  avatar  avatar  avatar  avatar  avatar  avatar  avatar  avatar  avatar  avatar  avatar  avatar  avatar  avatar  avatar  avatar

react-native-pathjs-charts's Issues

Add Gauge chart

Any plans on adding a Gauge chart?


  • I have searched for existing issues

Passed an invalid numeric value (NaN, or not-a-number) to CoreGraphics API

I installed 0.0.24 and am trying to use SmoothLine but nothing is appearing except for this error now:

<Error>: Error: this application, or a library it uses, has passed an invalid numeric value (NaN, or not-a-number) to CoreGraphics API and this value is being ignored. Please fix this problem.

Any solution? I tried using some sample data but still doesn't work.

[[{x:0,y:1}, {x:1, y:1}], [{x: 4, y:5}, {x:6, y:4}]]

Running Example app fails - updated versions of react-native and react-native-svg needed

Hi!

I have tried to run the example as described in the readme. I tried it on 2 different computers. On the second one I did a completely fresh install of react-native / android-studio, just to be sure.

Both computers run on Ubuntu 16.10. When i am building with "react-native run-android" I always get the following errors:

`../react-native-pathjs-charts/example/node_modules/react-native-svg/android/src/main/java/com/horcrux/svg/SvgViewManager.java:14: error: package com.facebook.yoga does not exist
import com.facebook.yoga.YogaMeasureMode;
^
../react-native-pathjs-charts/example/node_modules/react-native-svg/android/src/main/java/com/horcrux/svg/SvgViewManager.java:15: error: package com.facebook.yoga does not exist
import com.facebook.yoga.YogaMeasureFunction;
^
../react-native-pathjs-charts/example/node_modules/react-native-svg/android/src/main/java/com/horcrux/svg/SvgViewManager.java:16: error: package com.facebook.yoga does not exist
import com.facebook.yoga.YogaNodeAPI;
^
../react-native-pathjs-charts/example/node_modules/react-native-svg/android/src/main/java/com/horcrux/svg/SvgViewManager.java:35: error: cannot find symbol
private static final YogaMeasureFunction MEASURE_FUNCTION = new YogaMeasureFunction() {
^
symbol: class YogaMeasureFunction
location: class SvgViewManager
5 errors
:react-native-svg:compileReleaseJavaWithJavac FAILED

FAILURE: Build failed with an exception.

  • What went wrong:
    Execution failed for task ':react-native-svg:compileReleaseJavaWithJavac'.

Compilation failed; see the compiler error output for details.
`

Anyone else getting this error?

Errors when using RN 0.40

So I upgraded my project to RN 0.40 and pathjs charts doesn't seem to work anymore as seen below. I read in another issue that this library may not work with 0.40 just yet but wanted to make sure that's the case and that there is no workaround.

I'm using pathjs-chart 0.0.24 and RN 0.40 running on iOS.

Drawing a basic bar chart like this:

...
<Bar data={data} options={options} accessorKey='v' />
...

image

Cheers.

Extra vertical gridline on the StockLine chart with a specific data set

(An extension of #17)
There is an extra vertical gridline on the StockLine chart with a specific data set.

image

It can be reproduced with the following on both emulators for iOS and Android (Nexus 5, Android 7.1.1 - API level 25) using the following:

import React from 'react';
import { AppRegistry, View } from 'react-native';
import {StockLine} from 'react-native-pathjs-charts';

export class StockLineExample extends React.Component {
  render() {
    var data = [[{"x":3,"y":71},{"x":6,"y":75},{"x":7,"y":61}]];

    var options = {
      width: 275 ,
      height: 200,
      color: '#2980B9',
      margin: {
        top: 20,
        left: 20,
        bottom: 20,
        right: 15
      },
      animate: {
        type: 'delayed',
        duration: 200
      },
      axisX: {
        showAxis: false,
        showLines: true,
        showLabels: true,
        showTicks: true,
        zeroAxis: true,
        orient: 'bottom',
        tickValues: [],
        label: {
          fontFamily: 'Arial',
          fontSize: 8,
          fontWeight: true,
          fill: '#34495E'
        }
      },
      axisY: {
        showAxis: false,
        showLines: true,
        showLabels: true,
        showTicks: true,
        zeroAxis: true,
        orient: 'left',
        tickValues: [],
        label: {
          fontFamily: 'Arial',
          fontSize: 8,
          fontWeight: true,
          fill: '#34495E'
        }
      }
    };

    return (
      <View style={{flex:1,alignItems:"center",justifyContent:"center"}}>
        <StockLine
          data={data}
          options={options}
          xKey='x' yKey='y' />
      </View>
    );
  }
}

AppRegistry.registerComponent('example', () => StockLineExample);

react-native-svg库不能正常使用

debug模式一切正常 编译成release以后 安装完成 打开就直接报 not find DSO libcsslayout.so
release过程中 没有报任何错误
目前RN版本0.41.2

Charts not showing properly on Android

I have installed this library by the guide also used your example as starting point (used your example data also). But when i opened it the chart wasnt showing properly

unnamed

I have tried this with every chart, its the same there is always "offset" (see picture). Also i tried to change margins (i have set chart margins to 0 and margins of the View to 20) this sets dots ok but since the x,y axis are out of view their titles don't show.

Also to add i am using Android 6.0.1 on device.

Please add SPDX lines in license headers.

Before filing an issue please ensure the following boxes are checked, if applicable:

  • [ X] I have searched for existing issues
  • [ X] I have provided detailed instructions that can reproduce the issue (including code and data necessary)

Include the following lines in the license headers within the scripts. This is to ensure that the automated license scanning tools can identify the license.

SPDX-Copyright: Copyright (c) Capital One Services, LLC
SPDX-License-Identifier: Apache-2.0

Unknown name module:'react-native-pathjs-charts'

  I had  added  the library to My React Native project:

npm install react-native-pathjs-charts --save
react-native link react-native-svn.Then do like example pie ,import { Pie } from 'react-native-paths-charts' and run My project in android ,it output 'Unknow named module::'react-native-paths-charts''.
What should I do to resolute this ?I predicated somebody can help me.

Floats improperly handled in axis scaling / points calculation

My dataset has the following X values: 1.78, 1.83, 2.0, 2.46.

16731731_1255859791150820_448227196_o

As you can see, it gets quite ugly...some (simple?) solutions would be to limit the number of digits after the decimal point (I imagine 2 digits for the fractional part would be sufficient for scenarios that involve mobile graphs....), or rounding the fractional part after a number of digits over the decimal point.

Edit: I see this is an issue from the lodash range method...maybe since lodash is MIT licensed the method can simply be copied and improved with the proper handling?

Drawing empty smooth line graph

I would like to put up a graph with no data, just x and y axes. If I pass in empty data arrays, I get an exception. How can I draw an empty graph?

undefined is not an object (evaluating '_reactNative.UIManager.RNSVGRenderable.NativeProps')

Hi there,

I've created a new React Native project (RN 0.30.0, React 15.2.1, Node 4.4.0) and installed this package as follows:

$ react-native init PathJSChartsDemo
$ cd PathJSChartsDemo
$ npm install --save react-native-pathjs-charts
$ rnpm link

I then imported Bar and added the example and data the index.ios.js file:

import React, { Component } from 'react';
import {
  AppRegistry,
  StyleSheet,
  Text,
  View
} from 'react-native';
import {Bar} from 'react-native-pathjs-charts';

class PathJSChartsDemo extends Component {
  render() {
    return (
      <View style={styles.container}>
        <Bar
          data={sampleData.bar.data}
          options={sampleData.bar.options}
          accessorKey='v'/>
      </View>
    );
  }
}

const sampleData = {
    bar: {
        data: [
            [{
                "v": 49,......

I noticed that rnpm link completes with no output, in case that's relevant. When running the app I get the error in the issue title. The top of the stack is createNativeComponent.ios.js:36 in react-native-svg/lib. Do you have any ideas what I might be doing wrong?

Thanks!
James

There are no numbers for axis on android

screen shot 2016-11-08 at 12 26 45 pm

Before filing an issue please ensure the following boxes are checked, if applicable:

Hi I'm using react-native 0.32, and there are no numbers for axis on android, only one in top left corner.

I checked for bar graph... there are also no labels on axis...

Error while updating property 'd' in shadow node of type RNSVGPath

Hi

When trying out the examples I'm getting the following error for them all (only tested on android):

"Error while updating property 'd' in shadow node of type RNSVGPath"

This is my set up:

 "dependencies": {
    "react": "15.4.2",
    "react-native": "0.40.0",
    "react-native-svg": "^5.1.4",
    "react-native-pathjs-charts": "0.0.24",
    ...
    }

I've run react-native link react-native-svg and it linked successfully.

Has anyone else has this?

I've found the same error message here: steveliles/react-native-circular-slider-example#1 but I am able to run this example.

Thank you for your help.

No chart visible

I added one of your chart exemple, and i have an empty view. I added a text before to be sure it wasn't render outside of the visible field....
capture d ecran 2016-10-13 a 17 08 48

It should be rendered in the StockLine.

Am i doing something wrong?

Custom access functions for the LineChart?

LineChart hard codes (lines 71-75, 79-80) the accessor function that it passes to the underlying chartType.

The ability for the using code to pass an alternative set of functions would enable more flexibility for the data structure passed in.

Maybe fall back to this default if a function is not passed.

build failed with example app

I'm getting an error when trying to start the example app

Undefined symbols for architecture x86_64:
  "std::terminate()", referenced from:
      ___clang_call_terminate in libReact.a(RCTJSCExecutor.o)
  "operator delete[](void*)", referenced from:
      -[RCTJSCExecutor dealloc] in libReact.a(RCTJSCExecutor.o)
      executeRandomAccessModule(RCTJSCExecutor*, unsigned int, unsigned long, unsigned long) in libReact.a(RCTJSCExecutor.o)
      readRAMBundle(std::__1::unique_ptr<__sFILE, int (*)(__sFILE*)>, RandomAccessBundleData&) in libReact.a(RCTJSCExecutor.o)
      RandomAccessBundleData::~RandomAccessBundleData() in libReact.a(RCTJSCExecutor.o)
  "operator new[](unsigned long)", referenced from:
      executeRandomAccessModule(RCTJSCExecutor*, unsigned int, unsigned long, unsigned long) in libReact.a(RCTJSCExecutor.o)
      readRAMBundle(std::__1::unique_ptr<__sFILE, int (*)(__sFILE*)>, RandomAccessBundleData&) in libReact.a(RCTJSCExecutor.o)
  "___cxa_begin_catch", referenced from:
      ___clang_call_terminate in libReact.a(RCTJSCExecutor.o)
  "___gxx_personality_v0", referenced from:
      -[RCTJavaScriptContext initWithJSContext:onThread:] in libReact.a(RCTJSCExecutor.o)
      -[RCTJavaScriptContext init] in libReact.a(RCTJSCExecutor.o)
      -[RCTJavaScriptContext invalidate] in libReact.a(RCTJSCExecutor.o)
      RCTNSErrorFromJSError(RCTJSCWrapper*, OpaqueJSContext const*, OpaqueJSValue const*) in libReact.a(RCTJSCExecutor.o)
      +[RCTJSCExecutor runRunLoopThread] in libReact.a(RCTJSCExecutor.o)
      -[RCTJSCExecutor init] in libReact.a(RCTJSCExecutor.o)
      -[RCTJSCExecutor initWithUseCustomJSCLibrary:] in libReact.a(RCTJSCExecutor.o)
      ...
ld: symbol(s) not found for architecture x86_64
clang: error: linker command failed with exit code 1 (use -v to see invocation)

** BUILD FAILED **

Example cannot run

I just tried to run the example, using the react-native run-android, but I get this error:

Failed to finalize session : -26: Package com.example new target SDK 22 doesn't support runtime permissions but the old target SDK 23 does.

SmoothLine graph plot doesn't actually go through data points

I'm not exactly sure if this is expected behavior or not, but here's an example:

    let data = [[
        {"x": 8, "y": 82},
        {"x": 13, "y": 70},
        {"x": 15, "y": 120},
        {"x": 19, "y": 80}
    ]]

    let regions = [{
        label: '',
        from: 70,
        to: 130,
        fill: '#18c947'
    }]

16729614_1253781768025289_1799773077_n

As you can see, even though the datapoint is right on the edge of the region, the plot goes under it, which is deceiving and gives the impression that the value is outside of the bounds designated by the region.

Example cannot run

I just tried to run the example, using the react-native run-android, but I get this error:

Failed to finalize session : -26: Package com.example new target SDK 22 doesn't support runtime permissions but the old target SDK 23 does.

Pie graph doesn't render with only 1 data item

When there is only data field, it draw only one line instead of circle.
By the wat StockLine and SmoothLine need minimum 3 ponts of data to build it or if there are less then 3 points it crashes.

How to use flex width on charts?

In order to let my app work on both phone and tablet, I need to apply flex to everything.
Is there any way to set chart width/height to flex?

NPM Update

NPM package installs [email protected]

From react-native-svg:

react-native-svg >= 3.2.0 only supports react-native >= 0.29.0

I'm currenntly using:
"react-native": "0.36.0"

Can you update the npm package? Currently, I'm using npm install with github link as a solution.

Way to extend y axis line within scale?

I wanted to extend y axis line (showing no data but to be drawn in smoothline graph) in the scale ratio. I just cant figure out how would i do it. this.chartType handles this (if i am correct)

How to Represent Color to Data

Hi, This is very awesome library.
I just want to ask that how can i represent my data to the color filled.
If there are thousands of data I cannot statically assign color to each of them.

For Example :-
In screenshot How can i make user understand that upper color is for a and below is for b
capture

Thanks in advance for your help

Missing onload property

Is not an issue but it will be awesome to have a onload property while the chart is loading

Example app error - Couldn't find preset "react-native" relative to directory

I get this error when following the readme instructions to install the example app

Error: Couldn't find preset "react-native" relative to directory "<root.dir>/react-native-pathjs-charts"

Two ways to workaround this until it gets fixed:

  • Remove .babelrc from the root directory (../example)
  • Do npm install on the root directory (../example)

use react-native-pathjs-charts was wrong

"react": "15.0.2",
"react-native": "^0.26.3",
"react-native-pathjs-charts": "0.0.19",

Warning:Native component for "RNSVGGroup" dose not exist
Warning:Native component for "RNSVGClipPath" dose not exist
Warning:Native component for "RNSVGPath" dose not exist
Warning:Native component for "RNSVGRect" dose not exist
Warning:Native component for "RNSVGCircle" dose not exist
Warning:Native component for "RNSVGEllipse" dose not exist
Warning:Native component for "RNSVGLine" dose not exist
Warning:Native component for "RNSVGSvgView" dose not exist
Warning:Native component for "RNSVGSvgText" dose not exist
Warning:Native component for "RNSVGSvgImage" dose not exist

Pie chart not rendering the labels and numbers

Before filing an issue please ensure the following boxes are checked, if applicable:

  • I have searched for existing issues
  • I have provided detailed instructions that can reproduce the issue (including code and data necessary)

The graph is rendering but the labels and numbers aren't showing
(image bellow)

my dependencies:

    "react": "^15.4.2",
    "react-native": "^0.39.2",
    "react-native-svg": "^5.1.3",
    "react-native-pathjs-charts": "0.0.23",
    "react-native-router-flux": "^3.35.0",
    "react-redux": "^4.4.6",
    "redux": "^3.6.0",
    "redux-thunk": "^2.1.0",

here is my component:

import React, { Component } from 'react';
import { connect } from 'react-redux';
import { Alert, Dimensions, Platform, View, ScrollView, StyleSheet, Text } from 'react-native';
import { Button } from 'native-base/backward';
import { Actions } from 'react-native-router-flux';

import { Pie } from 'react-native-pathjs-charts';

import { fetchGraph } from '../actions';
    const data = [{ //Example for data
    "name": "Washington",
    "population": 7694980
}, {
  "name": "Oregon",
  "population": 2584160
}, {
    "name": "Minnesota",
    "population": 6590667
  }, {
    "name": "Alaska",
    "population": 7284698
  }]
const window = Dimensions.get('window');

class GraphResults extends Component {

  debate() {
    const { id, debates_size } = this.props.poll;
    if (debates_size > 0) { //eslint-disable-line
      Actions.debates({ poll_id: id });
    } else {
      Alert.alert(
        'Todavía no hay debates',
        'Por el momento esta propuesta no tiene debates, intenta más tarde.',
        [{ text: 'OK', onPress: () => console.log('OK Pressed!') }]
      );
    }
  }

  render() {
      const androidHeight = (Platform.OS === 'android') ? { marginBottom: 26 } : {};
          return (
            <View style={[{ marginTop: 65 }, androidHeight ]}>
              <ScrollView
              ref={(scrollView) => { _scrollView = scrollView; }}
              automaticallyAdjustContentInsets={false}
              scrollEventThrottle={200}
              >
                <Text style={styles.title}>{this.props.poll.title}</Text>
                <Pie
                 data={data}
                 options={pieOptions}
                 accessorKey="population"
                />
              </ScrollView>
              <Button block onPress={this.debate.bind(this)} >
              debata la propuesta
              </Button>
            </View>
          );
  }
}

const pieOptions = {
  margin: { // set the text on the graph
    top: 0,
    left: -6,
    right: 24,
    bottom: 24
  },
  width: window.width,
  height: window.height * (7 / 9),
  color: '#29EEB9',
  r: 50,
  R: 150,
  legendPosition: 'topLeft',
  animate: {
    type: 'oneByOne',
    duration: 200,
    fillTransition: 3
  },
  label: {
    fontFamily: 'Arial',
    fontSize: 12,
    fontWeight: true,
    color: '#ECF0F1'
  }
};

const styles = StyleSheet.create({
  debateButton: {
    alignItems: 'center',
    position: 'absolute',
    bottom: 0,
    right: 0,
    left: 0,
  },
  title: {
    color: '#2980B9',
    fontSize: 18,
    marginLeft: 15,
    marginRight: 15,
    marginTop: 15,
    fontWeight: '600',
    textAlign: 'center'
  },
  textResultStyle: {
    backgroundColor: 'rgba(0,0,0,0)',
    color: 'black',
    fontSize: 12,
    fontWeight: '500',
    position: 'absolute',
    zIndex: 1,
    top: window.height * 0.3,
    right: window.width * 0.45
  }
});
const mapStateToProps = (state) => {
  const { chart_type, results, id } = state.actualVotedPoll;
  return { chart_type, results, id };
};

export default connect(mapStateToProps, { fetchGraph })(GraphResults);

screen shot 2017-02-08 at 3 06 43 pm

xcode'error unknow class method in the running App

Hi, I add react-native-pathjs-charts and link this in the my project.
when running, Xcode'error: "unknow class method for selector UIFont:nil withFamily:fontDict[@"fontFamily"] size:fontDict[@"fontSize"] weight:fontDict[@"fontWeight"] style:fontDict[@"fontStyle"] scaleMultiplier:1.0]; " in the "RNSVG/Utils/RCTConvert+RNSVG.m".
I think the react-native-svn'version is too old, so I npm install react-native-svn@latest and again link, I find the code is different about upper description, and I success run app, but I don't see chats, I still failed.
I don't know the reason, who can tell me why is it that?

Issues with Y Axis Values & Decimal Values Using Bar Chart

There's an issue with the scale return for the Y axis values when using decimal numbers.
simulator screen shot dec 6 2016 11 07 05 am

When the scale is from 0-0.5, 0.3 on Y axis is rendered as 0.30000000000000004
simulator screen shot dec 6 2016 11 12 37 am

When the scale is from 0-1, 0.6 is rendered as 0.6000000000000001 on the Y axis.
simulator screen shot dec 6 2016 11 19 12 am

Visually indicate threshold for graph

Hello, I was wondering whether there is any way to make it visually clear on the graph that a certain data point has gone over / under a specified threshold? To expand on this, what I would like would be something like the ability to individually color bars in the bar chart (red for ones that go over / under a threshold that I maintain, green for others within "accepted ranges"), or like a way to draw horizontal lines over the stockline graph, indicating clearly what the threshold range is, so the user can see when those are exceeded, etc.

If there's no established way to achieve this (which I believe might be the case after a quick look over examples and code), is there a hacky way, or maybe something that I could implement if pointed in the right direction?

Thank you

Android build errors with latest move to react-native 0.35

When you run react-native run-android in the example app directory, you see this build error:

:app:mergeDebugResources
:app:bundleDebugJsAndAssets SKIPPED
:app:processDebugManifest
:app:processDebugResources
:app:generateDebugSources
:app:processDebugJavaRes UP-TO-DATE
:app:compileDebugJavaWithJavac
.../com/example/MainActivity.java:26: error: method does not override or implement a method from a supertype
    @Override
    ^
.../com/example/MainActivity.java:35: error: method does not override or implement a method from a supertype
    @Override
    ^
2 errors
:app:compileDebugJavaWithJavac FAILED

FAILURE: Build failed with an exception.

* What went wrong:
Execution failed for task ':app:compileDebugJavaWithJavac'.
> Compilation failed; see the compiler error output for details.

* Try:
Run with --stacktrace option to get the stack trace. Run with --info or --debug option to get more log output.

BUILD FAILED

Re-render charts when data changed

I tried pass data with state and how can I re-render chart if data has changed.

    return (
      <View style={styles.container}>
        <View style={styles.chartContainer}>
          <Pie 
            data={[ 
              { name: 'Value 1', value: this.state.val1 }, 
              { name: 'Value 2', value: this.state.val2 } 
            ]}
            accessorKey='value'
            options={options}
          />
        </View>
        <View style={styles.sliderContainer}>
          <Text>Option 1 {this.state.val1}</Text>
          <TextInput 
            style={styles.slider}
            onChangeText={(value) => this.setState({ val1: value })}
          />

          <Text>Option 2 {this.state.val2}</Text>
          <TextInput 
            style={styles.slider}
            onChangeText={(value) => this.setState({ val2: value })}
          />
        </View>
      </View>
    );

Values for Y where Y < min will push X axis out of view for Line graphs

It's all in the title: to replicate in the SmoothLineChartRegionsExtended example, simply assign a value for Y of a data point such that Y < min (when min is specified). Example, where min = 30, as you can see, my second data point has Y = 10, which pushes the X axis out of view:

data: [[ {"x": 0, "y": 82.5}, {"x": 13, "y": 10}, {"x": 15, "y": 100}, {"x": 17, "y": 150}, {"x": 24, "y": 50} ]]

16732084_1254450414625091_1885717428_o

Recommend Projects

  • React photo React

    A declarative, efficient, and flexible JavaScript library for building user interfaces.

  • Vue.js photo Vue.js

    🖖 Vue.js is a progressive, incrementally-adoptable JavaScript framework for building UI on the web.

  • Typescript photo Typescript

    TypeScript is a superset of JavaScript that compiles to clean JavaScript output.

  • TensorFlow photo TensorFlow

    An Open Source Machine Learning Framework for Everyone

  • Django photo Django

    The Web framework for perfectionists with deadlines.

  • D3 photo D3

    Bring data to life with SVG, Canvas and HTML. 📊📈🎉

Recommend Topics

  • javascript

    JavaScript (JS) is a lightweight interpreted programming language with first-class functions.

  • web

    Some thing interesting about web. New door for the world.

  • server

    A server is a program made to process requests and deliver data to clients.

  • Machine learning

    Machine learning is a way of modeling and interpreting data that allows a piece of software to respond intelligently.

  • Game

    Some thing interesting about game, make everyone happy.

Recommend Org

  • Facebook photo Facebook

    We are working to build community through open source technology. NB: members must have two-factor auth.

  • Microsoft photo Microsoft

    Open source projects and samples from Microsoft.

  • Google photo Google

    Google ❤️ Open Source for everyone.

  • D3 photo D3

    Data-Driven Documents codes.