![]()


pvfactors is a tool used by PV professionals to calculate the irradiance incident on surfaces of a photovoltaic array. It relies on the use of 2D geometries and view factors integrated mathematically into systems of equations to account for reflections between all of the surfaces.
pvfactors was originally ported from the SunPower developed 'vf_model' package, which was introduced at the IEEE PV Specialist Conference 44 2017 (see [1] and link to paper).
Table of contents
The documentation can be found here. It includes a lot of tutorials that describe the different ways of using pvfactors.
Given some timeseries inputs:
# Import external libraries
from datetime import datetime
import pandas as pd

# Create input data
df_inputs = pd.DataFrame(
    {'solar_zenith': [20., 50.],
     'solar_azimuth': [110., 250.],
     'surface_tilt': [10., 20.],
     'surface_azimuth': [90., 270.],
     'dni': [1000., 900.],
     'dhi': [50., 100.],
     'albedo': [0.2, 0.2]},
    index=[datetime(2017, 8, 31, 11), datetime(2017, 8, 31, 15)])
df_inputs| solar_zenith | solar_azimuth | surface_tilt | surface_azimuth | dni | dhi | albedo | |
|---|---|---|---|---|---|---|---|
| 2017-08-31 11:00:00 | 20.0 | 110.0 | 10.0 | 90.0 | 1000.0 | 50.0 | 0.2 |
| 2017-08-31 15:00:00 | 50.0 | 250.0 | 20.0 | 270.0 | 900.0 | 100.0 | 0.2 |
And some PV array parameters
pvarray_parameters = {
    'n_pvrows': 3,            # number of pv rows
    'pvrow_height': 1,        # height of pvrows (measured at center / torque tube)
    'pvrow_width': 1,         # width of pvrows
    'axis_azimuth': 0.,       # azimuth angle of rotation axis
    'gcr': 0.4,               # ground coverage ratio
}
The user can quickly create a PV array with pvfactors, and manipulate it with the engine
from pvfactors.geometry import OrderedPVArray
# Create PV array
pvarray = OrderedPVArray.init_from_dict(pvarray_parameters)
from pvfactors.engine import PVEngine
# Create engine
engine = PVEngine(pvarray)
# Fit engine to data
engine.fit(df_inputs.index, df_inputs.dni, df_inputs.dhi,
df_inputs.solar_zenith, df_inputs.solar_azimuth,
df_inputs.surface_tilt, df_inputs.surface_azimuth,
df_inputs.albedo)The user can then plot the PV array geometry at any given time of the simulation:
# Plot pvarray shapely geometries
f, ax = plt.subplots(figsize=(10, 5))
pvarray.plot_at_idx(1, ax)
plt.show()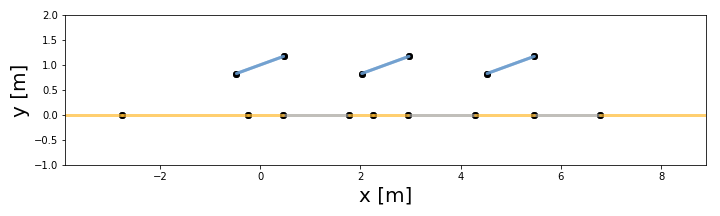
It is then very easy to run simulations using the defined engine:
pvarray = engine.run_full_mode(fn_build_report=lambda pvarray: pvarray)And inspect the results thanks to the simple geometry API
print("Incident irradiance on front surface of middle pv row: {} W/m2"
      .format(pvarray.ts_pvrows[1].front.get_param_weighted('qinc')))
print("Reflected irradiance on back surface of left pv row: {} W/m2"
      .format(pvarray.ts_pvrows[0].back.get_param_weighted('reflection')))
print("Isotropic irradiance on back surface of right pv row: {} W/m2"
      .format(pvarray.ts_pvrows[2].back.get_param_weighted('isotropic')))
Incident irradiance on front surface of middle pv row: [1034.968 886.377] W/m2 Reflected irradiance on back surface of left pv row: [112.139 86.404] W/m2 Isotropic irradiance on back surface of right pv row: [0.116 1.849] W/m2
The users can also create a "report" while running the simulations that will rely on the simple API shown above, and which will look like whatever the users want.
# Create a function that will build a report
def fn_report(pvarray): return {'total_incident_back': pvarray.ts_pvrows[1].back.get_param_weighted('qinc'),
                                'total_absorbed_back': pvarray.ts_pvrows[1].back.get_param_weighted('qabs')}

# Run full mode simulation
report = engine.run_full_mode(fn_build_report=fn_report)

# Print results (report is defined by report function passed by user)
df_report = pd.DataFrame(report, index=df_inputs.index)
df_report| total_incident_back | total_absorbed_back | |
|---|---|---|
| 2017-08-31 11:00:00 | 106.627832 | 103.428997 |
| 2017-08-31 15:00:00 | 79.668878 | 77.278812 |
pvfactors is currently compatible and tested with 3.6+, and is available in PyPI. The easiest way to install pvfactors is to use pip as follows:
$ pip install pvfactorsThe package wheel files are also available in the release section of the Github repository.
Requirements are included in the requirements.txt file of the package. Here is a list of important dependencies:
We appreciate your use of pvfactors. If you use pvfactors in a published work, we kindly ask that you cite:
Anoma, M., Jacob, D., Bourne, B.C., Scholl, J.A., Riley, D.M. and Hansen, C.W., 2017. View Factor Model and Validation for Bifacial PV and Diffuse Shade on Single-Axis Trackers. In 44th IEEE Photovoltaic Specialist Conference.
Contributions are needed in order to improve pvfactors. If you wish to contribute, you can start by forking and cloning the repository, and then installing pvfactors using pip in the root folder of the package:
$ pip install .To install the package in editable mode, you can use:
$ pip install -e .| [1] | Anoma, M., Jacob, D., Bourne, B. C., Scholl, J. A., Riley, D. M., & Hansen, C. W. (2017). View Factor Model and Validation for Bifacial PV and Diffuse Shade on Single-Axis Trackers. In 44th IEEE Photovoltaic Specialist Conference. |


