Code Monkey home page Code Monkey logo

grafana-datatable-panel's Introduction

Grafana Datatable Panel

Marketplace Downloads License

Twitter Follow Release CI (main)

Known Vulnerabilities Maintainability Test Coverage

This panel plugin provides a Datatables.net table panel for Grafana 8.x/9.x/10.x

NOTE: main branch is now v2.0.0 in progress, these docs are for v1.x

Screenshots

Paging enabled

Default Paging

Scrolling enabled

Scrolling

Light Theme with Paging

Light Theme with Paging

Numbered Rows and Compact Style

Numbered and Compact Rows

Options

Options Tab

Options

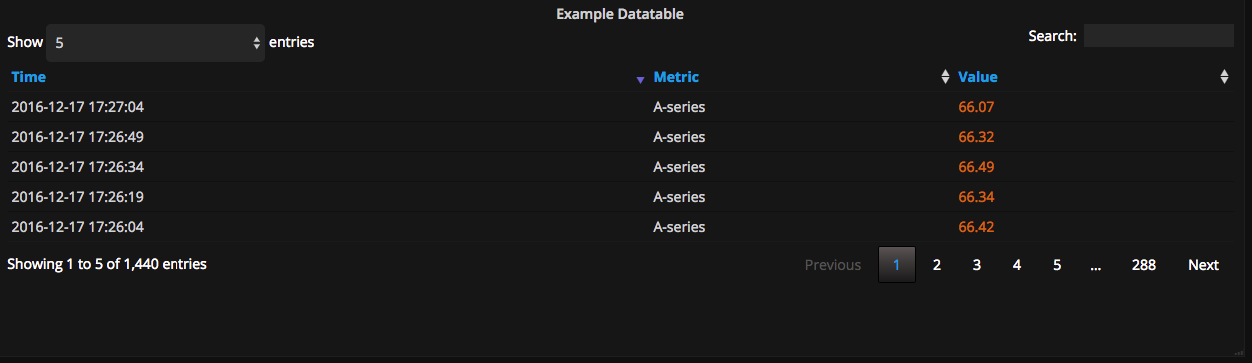
Same options as built-in table panel

Datatable Options Tab

Datatable Options

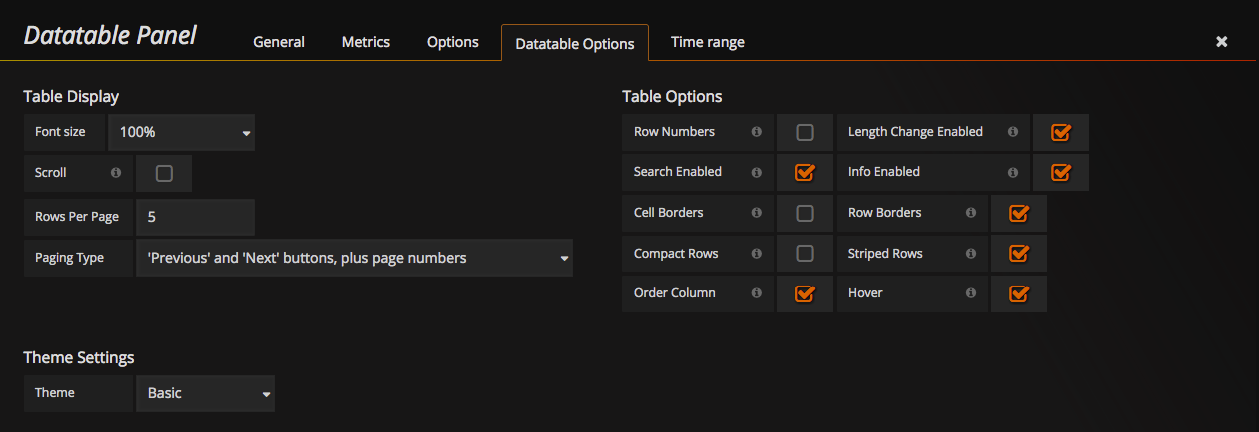
Table Display Options

  • Font Size - set font size of table content
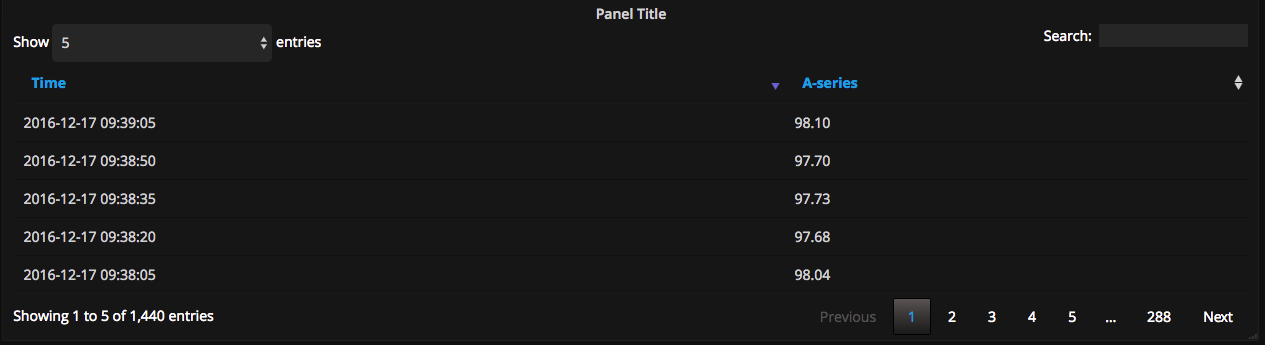
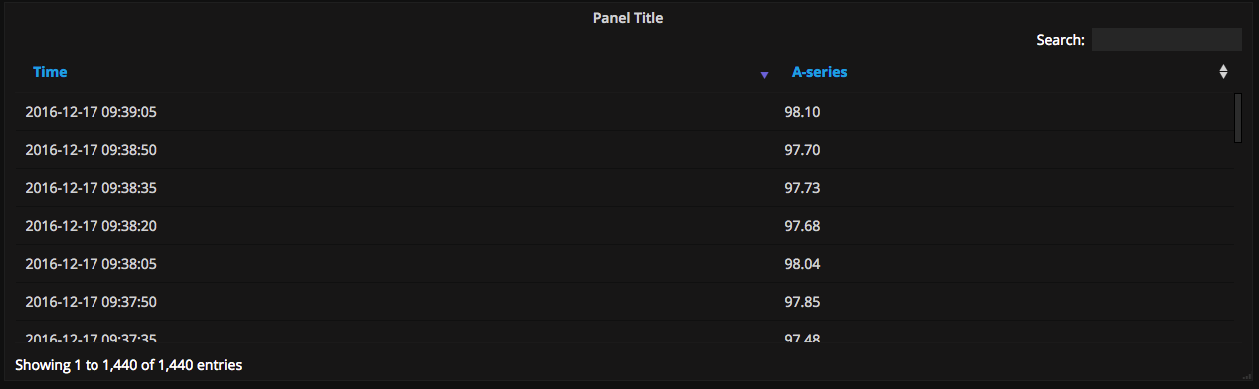
  • Scroll - toggle for scrolling vs Paging
  • Paging Options
    • Rows Per Page - number of rows to display when paging is enabled
    • Paging type - multiple navigation options

Column Aliasing

  • Override the name displayed for a column

Column Width Hints

  • Provide a width "hint" in percentage or pixels ( 100px or 10% ). Note: The table will autosize as needed, but will use the hints provided.

Column Sorting

  • Sort table by any number of columns in ascending/descending order.

Table Options

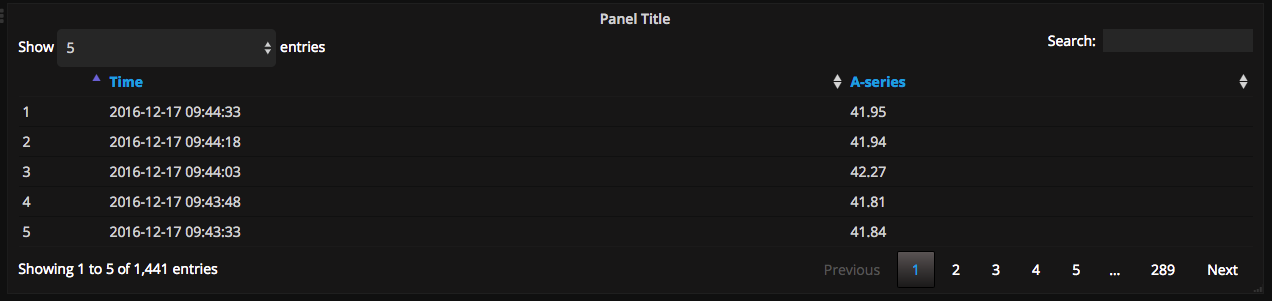
  • Row Numbers - toggle to show row numbers
  • Length Change Enabled - top left dropdown for showing alternate page sizes
  • Search Enabled - toggle to allow searching table content (regex is enabled)
  • Info - Displays the "Show N of X entries" on bottom left of table
  • Cell Borders - show borders around each Cell (cannot be enabled with Row Borders)
  • Row Borders - show border between rows
  • Compact Rows - uses less padding for denser data display
  • Striped Rows - non-colored rows will be "striped" odd/even
  • Order Column - Highlights the column used for sorting
  • Hover - Highlights row on mouse hover
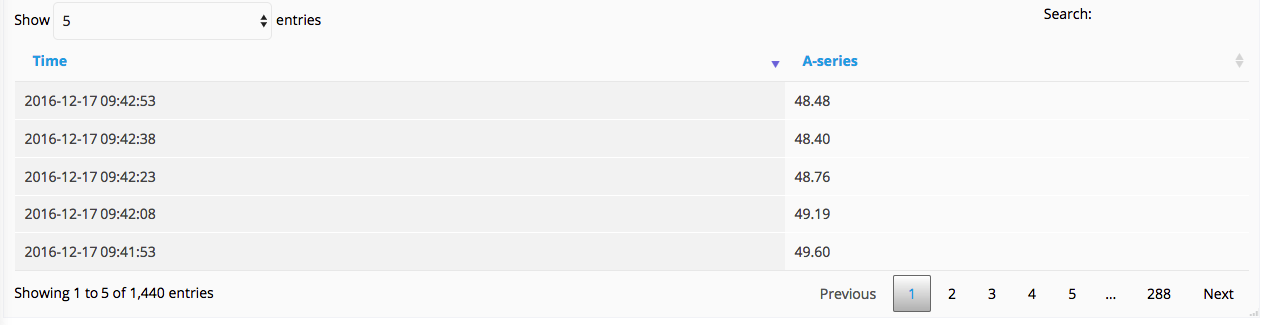
Theme Settings

  • Basic theme is currently the only option, more to be added

Thresholding

Row-based threshold coloring

Thresholding with Row Coloring

Cell based threshold coloring

Thresholding with Cell Coloring

Cell based threshold value coloring

Thresholding with Value Coloring

RowColumn threshold coloring

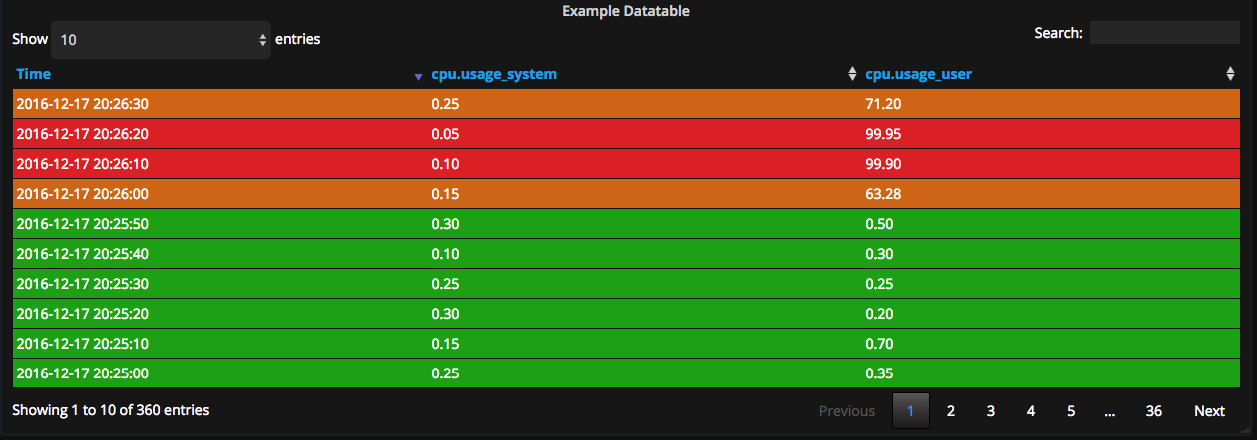
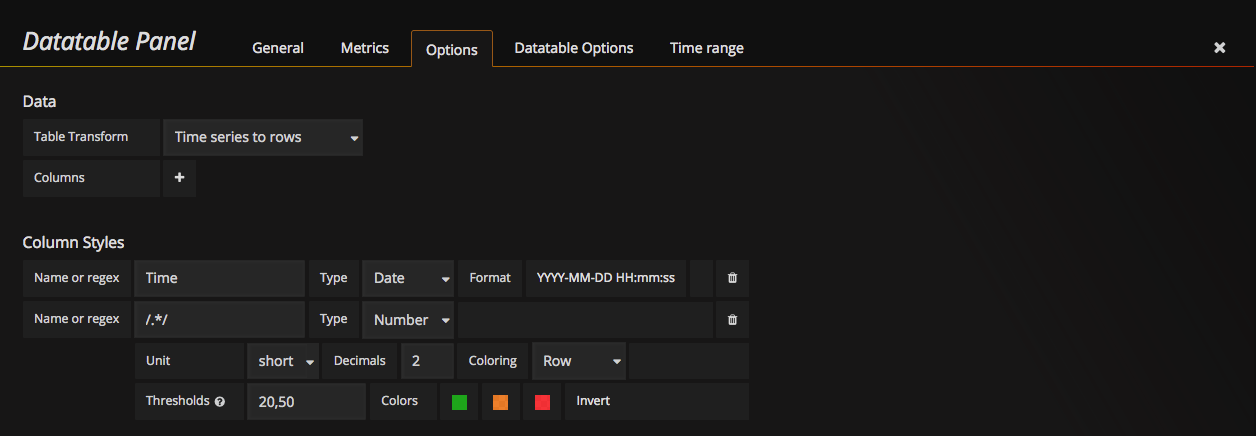
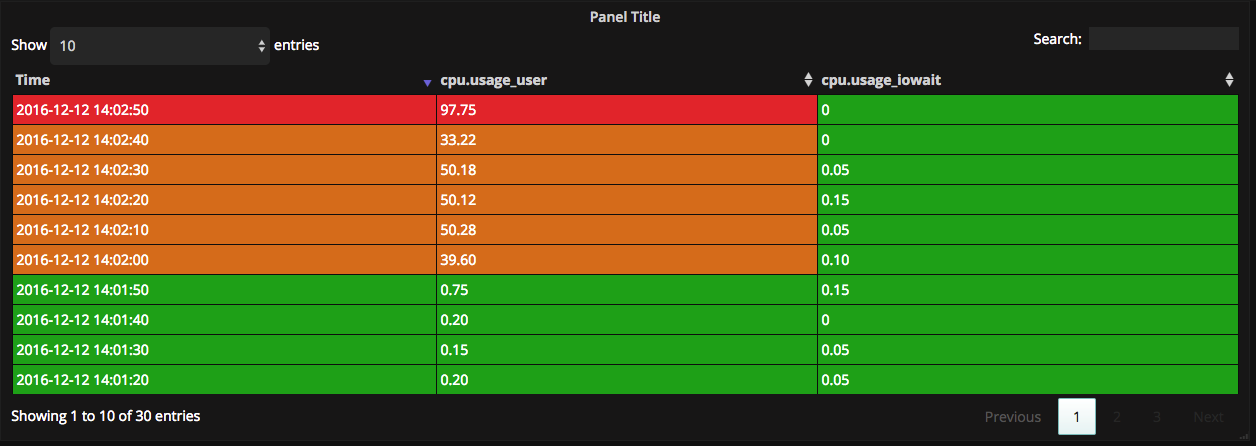
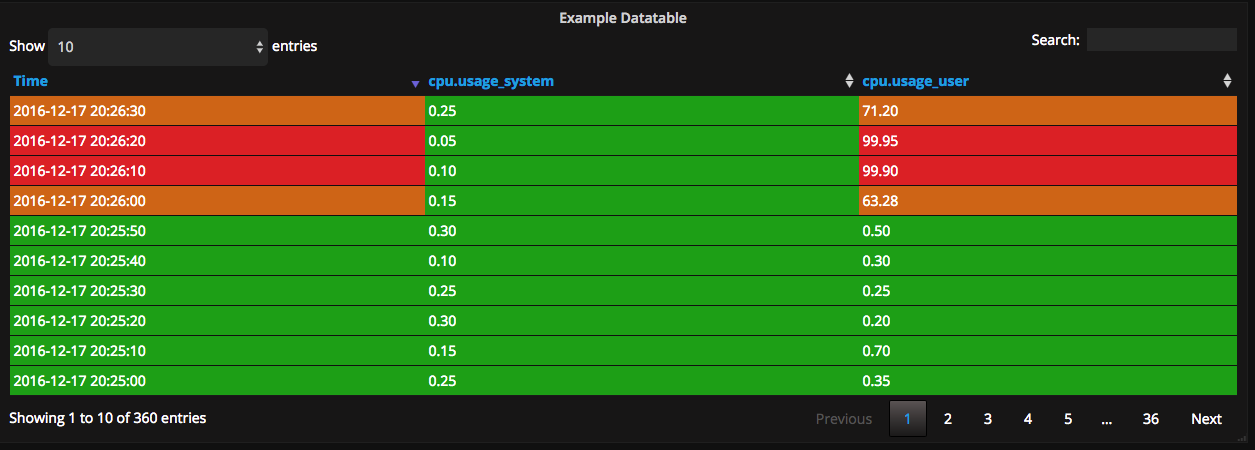
This option sets the row color to the "highest" threshold found for all cells in row.

It also sets the color for each cell according to the threshold (you can tell which columns actually exceeded the threshold).

This means - a row can have an overall color, with each cell indicating it's real threshold color.

Thresholding with RowColumn1

Thresholding with RowColumn2

RowColumn threshold coloring including row counter

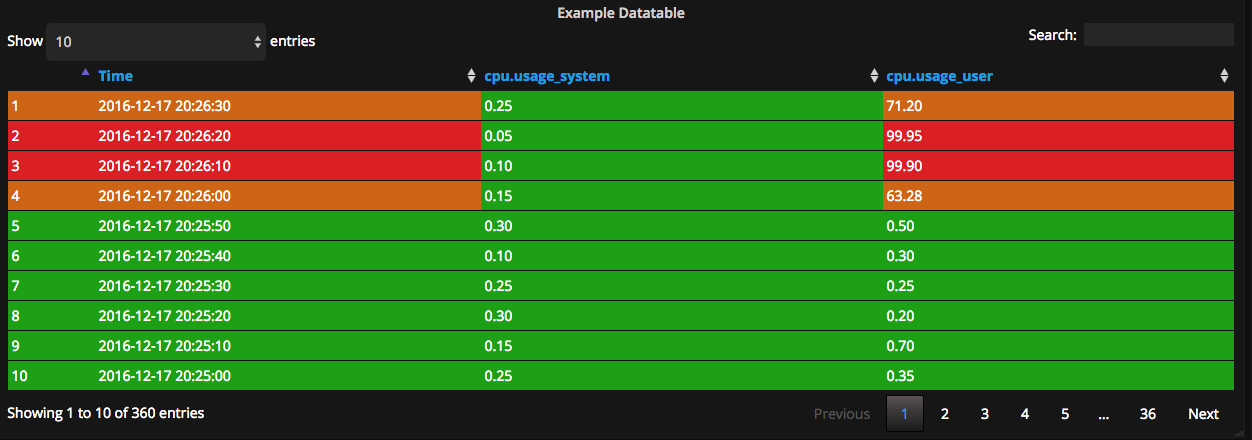
Same as above, but with row counter included

Thresholding with RowColumn including row count

Features

  • Feature parity with built-in Grafana Table Panel
  • Row coloring uses the "highest" threshold color of all columns
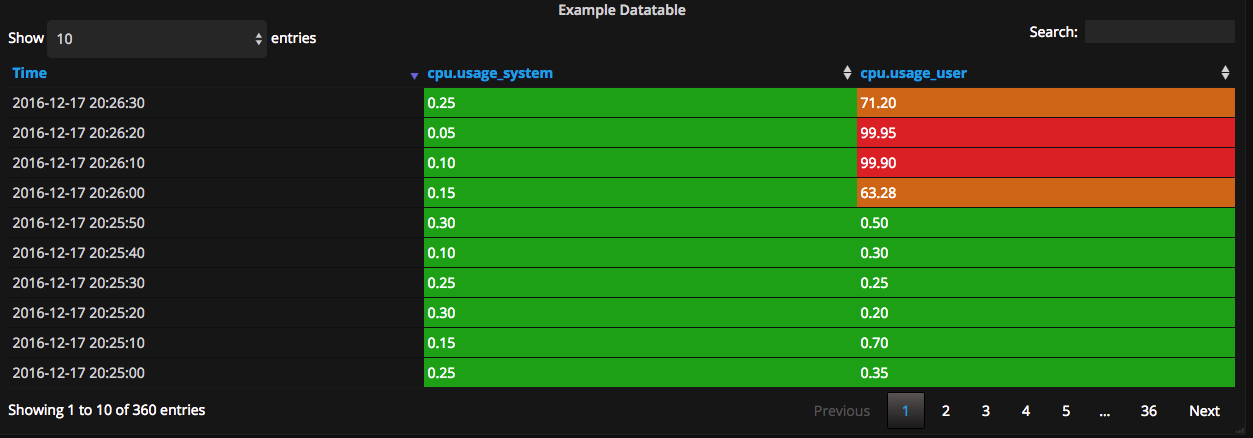
  • New "RowColumn" threshold color option: Sets color to "highest" threshold found for all cells in row. Also sets color for each cell according to the threshold. This means - a row can have an overall color, with each cell indicating it's real threshold color.
  • Set font size for rows
  • Scrolling
  • Paging
    • Preset page sizes
    • Multiple paging types
    • Dropdown for page size
  • Row Numbers reactive to filtering
  • Searchable table content (filtering), regex enabled
  • Columns names can be aliased
  • URLs inside row text can be "clicked"
  • Rows can have a click-through URL
  • Multi-Column Sorting
  • Horizontal scrolling enabled when columns are wider than panel

TODO

  • [+] Column is not working

Building

This plugin relies on Yarn, typical build sequence:

yarn install
yarn build

For development, you can run:

yarn install
yarn watch

The code will be parsed then copied into "dist" if the build passes without errors.

Docker Support

A docker-compose.yml file is include for easy development and testing, just run

docker-compose up

Then browse to (http://localhost:3000)

RPM

A spec file is included to facilitate RPM based deployments, to generate run

make rpm

External Dependencies

  • Grafana 6.x/7.x

Build Dependencies

  • yarn

Acknowledgements

This panel is based on the "Table" panel by GrafanaLabs

grafana-datatable-panel's People

Contributors

briangann avatar dependabot[bot] avatar iruizr7 avatar jacquelinegarrahan avatar jmp0x00 avatar jonstout avatar lvta0909 avatar mweber55 avatar peterhpchen avatar warezwally avatar welyss avatar

Stargazers

 avatar  avatar  avatar  avatar  avatar  avatar  avatar  avatar  avatar  avatar  avatar  avatar  avatar  avatar  avatar  avatar  avatar  avatar  avatar  avatar  avatar  avatar  avatar  avatar  avatar  avatar  avatar  avatar  avatar  avatar  avatar  avatar  avatar  avatar  avatar  avatar  avatar  avatar  avatar  avatar  avatar  avatar  avatar  avatar  avatar  avatar  avatar  avatar  avatar  avatar  avatar  avatar  avatar  avatar  avatar  avatar  avatar  avatar  avatar  avatar  avatar  avatar  avatar  avatar  avatar  avatar  avatar  avatar  avatar  avatar  avatar  avatar  avatar  avatar  avatar  avatar  avatar  avatar  avatar  avatar  avatar  avatar  avatar

Watchers

 avatar  avatar  avatar  avatar  avatar  avatar  avatar  avatar  avatar  avatar  avatar  avatar  avatar  avatar  avatar  avatar  avatar  avatar

grafana-datatable-panel's Issues

Forming a grid of single-stats

Given a metric with two dimensions, can I use this panel to show a table where columns are created from the values of one dimension, rows from the values the other, and the value of each cell is the current value (or aggregation) of the metric with that cell's coordinates?

As a real-world example, let's say I have a Prometheus data source. It provides the "up" metric, with labels "job" and "instance". I'd like to arrange the values of "up" into a grid for each job/instance combination.

Row Numbers it is not exported

Version 5.3.2 of grafana
Plugin v0.0.6

If I create a table and flag the "Dispaly Rownumbers" box, this column is not exported to csv

Draw on windows resize

Hi,
i'm using your datatable plugin on grafana.

I'm trying to use it to edit some data (i know grafana is not supposed to be used like this but i'm not the one who asked for this ).

Every time i resize my browser's windows, the datatable is being reloaded so if I have some textarea , the data will be change by the one loaded by the datatable at first call on database.

Any way to help me with those ?

Thx

Table doesnt update on changing to template variable whose query returns no result

Hi,

I'm trying to use this panel as it has a lot more features than standard table. I'm running into an issue where if a template variable is present, and its changed from its initial value to a variable which does not have any values (in specified time period), the table does not update and continues to show the old data.

Steps to reproduce:

  1. Select a template variable which will return data values in the specified time period
  2. Add a datatable panel
  3. Select Elasticsearch datasource
  4. Create query with option: "name:$Template_name", raw_document
  5. Additional options: (scrolling, search enabled)
  6. Exit from Edit screen
  7. The table should populate
  8. Select a template variable value which does not have any entries in the specified time period.
  9. The table will continue to show the old data rather than cleaning up entries.

Let me know if more information is required!

Thanks.

sanitize html is not working

Adding action buttons in datatable panel

Hi Brian,

I would like to ask how to add action buttons (view, edit, delete) for each record in datatable panel like in the image below.

if a user click View then I would like to perform a function
if a user click Edit then I would like to perform a function
if a user click Delete then I would like to perform a function

Thank you in advance Brian!

image

"Clickable" Not creating correct link

Grafana v5.0.3
Datatable Panel v0.0.6

Column Set Up:
image

Link on Hover:

image
image

Can I add data from other columns like the vanilla Grafana Table too. e.g $__cell_6?

Length Change Fail

no mater chose Length Change Enabled or not , it don't work . what's wrong

Stat summary under data table

Hi,

data table seems to be a very nice table plugin for grafana with many useful features.

I wonder if it would be possible to add a stats summary below the data table itself, maybe as a second table below.
Something like the following picture:
2018_04_19_19_31_52_grafana_

As far as i see, there is a model for the table data, is it possible to enhance the model to fullfill the above idea?

kind regards
Bernd

Column order fail

Please,

I did try use Datatable in Grafana but I found error in the order column.
I don't found as add column order registers and also doesn't work if I try use "ORDER BY data DESC" in my SQL sintax.

What I have to do?

Unable to see Show No. of Entries

Hi,

This is a great plugin, search& no. of entries in dashboard itself is a great future in this plugin even grafana table doesn't have.

I'm trying for below screenshot:
datatable-threshold-row

I obtained:
panel

How switch languages in the plugin ?

Hi,

In fact, I'm trying to put your plugin in Grafana v6, and I'm trying to find a way to switch languages.

I downloaded the French.json file available here: https://datatables.net/plug-ins/i18n/French

And I'm trying to find out how to use it for the Grafana plugin. I think that might be helpful for some of us trying to do the same.

Thank you for your reply.

Number style rule make date time format error

Because the earlier column style rule would be overridden by the latter rule, the time(the number of milliseconds) data get the number rule in default option below:

styles: [
{
type: 'date',
pattern: 'Time',
dateFormat: 'YYYY-MM-DD HH:mm:ss',
},
{
unit: 'short',
type: 'number',
decimals: 2,
colors: ['rgba(245, 54, 54, 0.9)', 'rgba(237, 129, 40, 0.89)', 'rgba(50, 172, 45, 0.97)'],
colorMode: null,
pattern: '/.*/',
thresholds: [],
},
],

This makes date convert error.

You can revert two rule to resolve this problem.

[Feature request] Add the ability to use a cell's content to generate its hyperlink.

It's currently possible to use $__cell in the url input box as a way to use a cell's content to generate its hyperlink. In some cases however, it may be desirable to use only a portion of the content. It may also be desirable to use separate portions of the cell's content in separate portions of the url.

I propose adding a Parameterization input which takes a regular expression which will be used to split the cells content. After splitting we could provide variables similar to the $__cell_n variables.

Copied from: grafana/grafana#11066

If it helps, I created an implementation once before for the core table panel. It used a 'Parameterize by' input box that took a regex to split the string. Once split the $__pattern_n variables could be used in the Url input box to generate the url.

As an example, we have the target name set as a comma separated string. By breaking up the parts we're able to link each row to a separate dashboard and pre-populate the required template variables.

screen shot 2018-03-28 at 1 36 40 pm

screen shot 2018-03-28 at 1 28 29 pm

Original: grafana/grafana#11068

Time Series

Hey,

Thanks for the great work on the Datatable panel looks amazing. I am facing some issues on time series updates on the panel, it seems it does not listen to change properly. any work around ?

Colors rules messing table (Grafana v6)

Hi ,

After configuring few columns , when set the last field coloring to cell, mess all the table.
Using grafana v6 .

image

If set it to disabled or cell, then the cell background becomes OK, but the text become colored.

image

Pannel Options

Some of the DataTable options is not working
image
these options is not working if I click on them nothing happens
If not avilble then gray them out

Panel size and contents w/ scroll overflow panel view

A panel with the scroll (instead of paging) option enabled ends up overflowing the panel view.

Resizing the panel larger to show bottom bounds (to include the bottom scrollbar arrow, table, and "Showing # to # entries of # entries") is only a temporary/momentary solution. Upon refresh the content in the panel again overflows the, now larger, view.

An image showing an example of the problem:

  • Left: after resizing and saving the dashboard with the new panel size.
  • Right: after refeshing the page.

size-scrollbar-bug

How to deal with this problem ,the tool will be stucked when the data exceeds 10000?

Dear developers:
I was used this plugin to show table data ,it is so cool and beautiful.
but when I wan to show more data , issue is comming. Whole tool came so stucked, the data loading need about 7 seconds, but I should spend lots of time to wait it response. Any Button or Event need wait long time. If you have an better plan to slove this,Please touch me .
Thank you very much.

Is this project abandoned?

Not really an issue, but more of a question.

Is this project abandoned and should i move on to something else?
It's clearly not working as intended in Grafana 6 and the last commit is months ago.

[Enhancement] Increase the Width of the Search Bar

It would be nice to increase the width of the search bar to clearly see the entire search criteria. Indeed, most of time users use multiple long keywords and with the actual width it is not possible to clearly see the entire search criteria. Ideally the size of the search bar should be the same as the table.

Value Mappings - Feature Sugestion

Hello

Would bevery apreciate to have a feature to map values to names or strings like in single stat panel , i have a big panel with hundred of alerts and a dashboard with a table solve this problem .

Make a huge diference.

image

Feature like this

image

Column Customization issues

From grafana community message board:

  • Column Aliasing is not working, upon clicking Add Column Alias, there is no response
  • Column Width Hints is not working, upon clicking Add Column Width Hint, there is no response
  • Column Sorting (applied top to bottom), upon clicking Add Rule there is no response

Threshold have effect over the unit value and not the original value.

When set the Unit to duration(s) and put any threshold value , the panel check over the unit value recalculated and not over the original value.
Since this unit can show in multiple levels (seconds, minutes, hours) the threshold isn't check correctly and then do not change the colors correctly.

Using grafana 6.x .

url support

you list the following as a feature

  • Rows can have a click-through URL

But I don't see where I can configure the url

Panel does not load +2500 lines

Hi there,

I'm using this panel to list a number of hosts and it's ip_address that come from 4 different Mysql databases so I can use the Search text that comes with the pannel.
On the Metrics tab:

  • Datasource: Mixed
  • Queries are the same just pointing out to the different mysql dbs I have.

Results are showed in a table, but limited :(
image
When I have more than 8000 lines...
:(

Why is this happening?
Any help would be appreciate.
Thanks in advance,

Alba.

Sorting on TableData "number" column does alphabet sorting, not number sorting

Great DataTable panel with search function, what is ultimate feature compared to standard Grafana plugin offering. However, the sorting does not work on number columns. It seems to do alphabet sorting. The Grafana "Table" panel, sorting works.

Here is snip of JSON table data what is returned from my backend,
[{
"type": "table",
"columns": [{
"text": "ITEMID",
"type": "string"
}, {
"text": "PRODGRP2_NAME",
"type": "string"
}, {
"text": "NAME1",
"type": "string"
}, {
"text": "STOCKLOC",
"type": "string"
}, {
"text": "UNIT",
"type": "string"
}, {
"text": "QTY",
"type": "number"
}, {
"text": "LOCPRICE",
"type": "number"
}, {
"text": "TOTALVALUE",
"type": "number"
}],
"rows": [
["501816-M39-280", "Bolts", "M39x280A193-B7/2HStud bolt with two hexagonal nuts", "blah", "pcs", 165.0, 10.43, 1720.95],
....
...

root url issue

I have the following setting in my grafana.ini

root_url = %(protocol)s://%(domain)s:%(http_port)s/grafana

That means that my grafana url looks like http://myserver/grafana

Hoever when I try to use datatable-panel plugin I see the following in js console of my browser:

[Error] Failed to load resource: the server responded with a status of 404 (Not Found) (jquery.dataTables.min.css, line 0)
[Error] Failed to load resource: the server responded with a status of 404 (Not Found) (datatable-dark.css, line 0)
[Error] Potentially unhandled rejection [3] (SystemJS) Error loading CSS file.
        onerror
        Error loading http://myserver/public/plugins/briangann-datatable-panel/libs/datatables.net-dt/css/jquery.dataTables.min.css!http://myserver/grafana/public/app/core/utils/css_loader.js
        (anonymous function) (boot.4aeac494.js:5:27838)
        f (boot.4aeac494.js:5:27434)
        i (boot.4aeac494.js:5:27723)
[Error] Potentially unhandled rejection [6] (SystemJS) Error loading CSS file.
        onerror
        Error loading http://myserver/public/plugins/briangann-datatable-panel/css/datatable-dark.css!http://myserver/grafana/public/app/core/utils/css_loader.js
        (anonymous function) (boot.4aeac494.js:5:27838)
        f (boot.4aeac494.js:5:27434)
        i (boot.4aeac494.js:5:27723)
[Error] Failed to load resource: the server responded with a status of 401 (Unauthorized) (query, line 0)

Seems like Grafana Datatable Panel ignores grafana root_url setting.

Can you please help me solve this issue?

Thank you!

Regards,
Sergey

Unable to get Colors to show

I am unable to get any of the colors to show in the datatable panel

Grafana 4.3.0-pre1

successful
npm install
bower install

capture

capture

Nothing happens when I click on Alias, Width or Sort buttons

Hello,

Thanks a lot for this plugin, it is amazing.
It is maybe something you have already seen but nothing happens when I click on one of the new features. I checked the log and nothing neither.
I am using ElasticSearch or MySQL sources.

Do you know what might cause the issue ?

Thanks a lot,
Kry

Rendering the paging elements

Hi,

I have a Problem with the Plugin. If a linebreak is needed to display the data, the rendering of the paging elements fails or they are not visible. See the two screenshots.

image

image

Is there a way to fix this using the options? I'm using version 0.0.6 and Grafana version 5.2.3.

Thank you for your time !

Option for pagination + scrolling

Is there any way to enable both pagination and scroll feature? Suppose I set the number of rows to 100 on one page, but since there is no scrolling available, it's impossible to go to the bottom of the page.

this.stringToJsRegex error after latest update

Hello @briangann,

I have updated our grafana plugins last week and our datatable panel using dashboards do not work after that. We get the error below. How can we solve this issue?

TypeError: this.stringToJsRegex is not a function
at Array.t.defaultCellFormatter (http://our_server_url/public/plugins/briangann-datatable-panel/module.js:23:4377)

How to scroll the table headers with table data?

Hi Brian,

I'm new to Grafana and am trying to use the native Table as well as your Datatable Panel.
My table has many columns (wider than panel). While I can use your scrollbar to scroll data left/right, the header row does not track with the data.

How can I get the header to scroll?

Thanks!

paging enabled not work

Hi ,

I have enabled paging option but not working in grafana V5.4.3
image

I only saw scrolling mode always.
image

how can I do to solve this problem?

Thanks

PDF / EXCEL export

Version 5.3.2 of grafana
Plugin v0.0.6

I can not find the option to export to Excel / PDF
I see in the release notes that from version 0.03 it was a new feature
selezione_058

Publish plugin to Grafananet

Hi,

Do you think it's posible to publish the plugin to Grafananet ?

That way it would be easier to update it.

Thanks in advance.

Datatable Panel/CSV Extract

Version 5.x of grafana
Plugin v0.0.3

Issue:
The export csv function appears to have a bug in it.. I tried hacking up the code to no success following grafana/grafana#2401 to make it a , delimited vs a ; delimited file so that excel opens it correctly.

Sample export string

instance_id;AZ;;Launch Date;Created On;Architecture;Owner;Portfolio;UserID;VP;Type;

BTW I LOVE the custom option as this is my go to plugin for tables

show incomplete

grafana-datatable-panel search bar are still some minor problems with it.As shown in the picture, it will show incomplete when there is more content. My grafana version v5.2.1
1

Sorting

Hello!
There is an issue with sorting.
It works by digits, but no by values.

Kindly ask you to fix it in short time.
Thank you!
screenshot_20180329_175904

Recommend Projects

  • React photo React

    A declarative, efficient, and flexible JavaScript library for building user interfaces.

  • Vue.js photo Vue.js

    🖖 Vue.js is a progressive, incrementally-adoptable JavaScript framework for building UI on the web.

  • Typescript photo Typescript

    TypeScript is a superset of JavaScript that compiles to clean JavaScript output.

  • TensorFlow photo TensorFlow

    An Open Source Machine Learning Framework for Everyone

  • Django photo Django

    The Web framework for perfectionists with deadlines.

  • D3 photo D3

    Bring data to life with SVG, Canvas and HTML. 📊📈🎉

Recommend Topics

  • javascript

    JavaScript (JS) is a lightweight interpreted programming language with first-class functions.

  • web

    Some thing interesting about web. New door for the world.

  • server

    A server is a program made to process requests and deliver data to clients.

  • Machine learning

    Machine learning is a way of modeling and interpreting data that allows a piece of software to respond intelligently.

  • Game

    Some thing interesting about game, make everyone happy.

Recommend Org

  • Facebook photo Facebook

    We are working to build community through open source technology. NB: members must have two-factor auth.

  • Microsoft photo Microsoft

    Open source projects and samples from Microsoft.

  • Google photo Google

    Google ❤️ Open Source for everyone.

  • D3 photo D3

    Data-Driven Documents codes.