Code Monkey home page Code Monkey logo

maperator's Introduction

Maperator

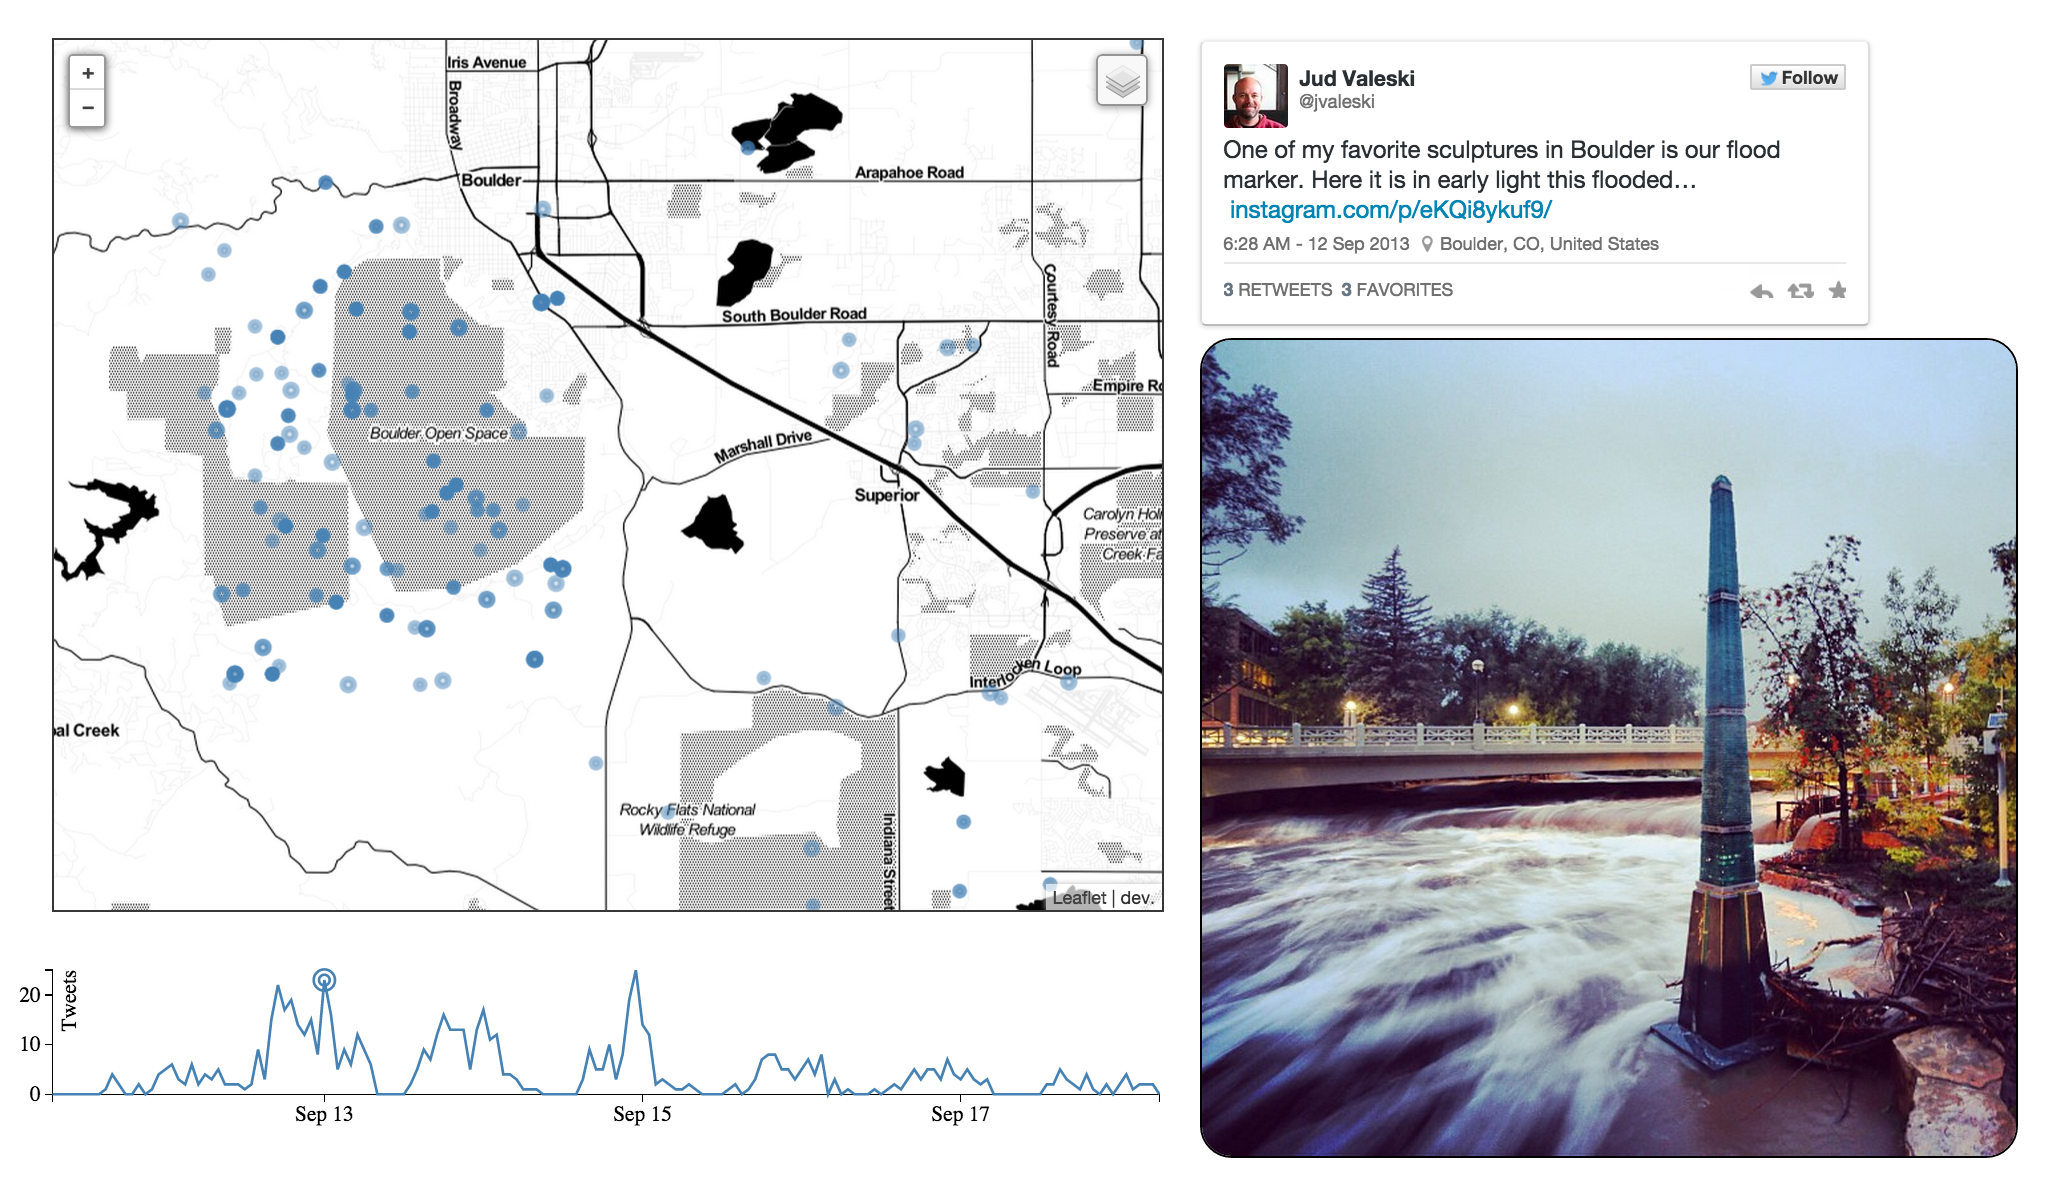
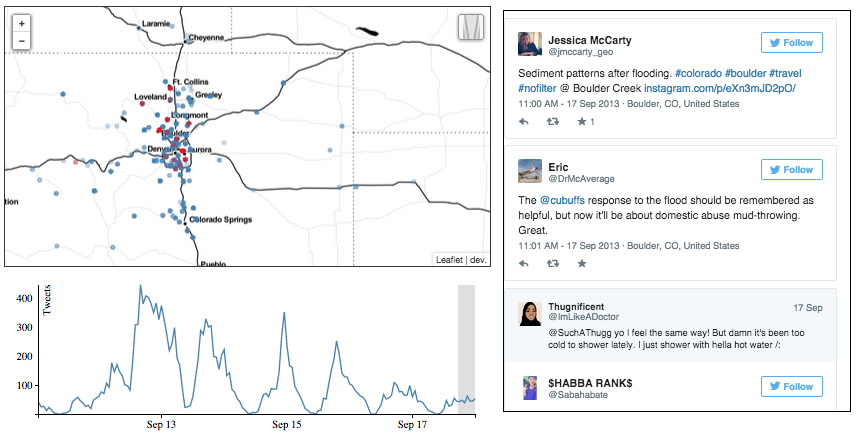
Replay twitter events to explore relevant geographic information as the conversation unfolds.

Process:

  1. Talk about the final viz, collect data, talk about the final viz, format
    data, talk about the final viz, add 3rd party data, reformat data, ...

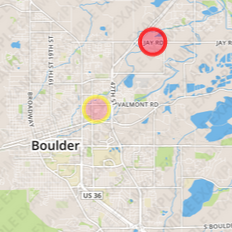
  2. Decide on inital region for map:
    West: -105.5270
    North: 40.2342
    East: -105.0233
    South: 39.9088

  3. Review resources.

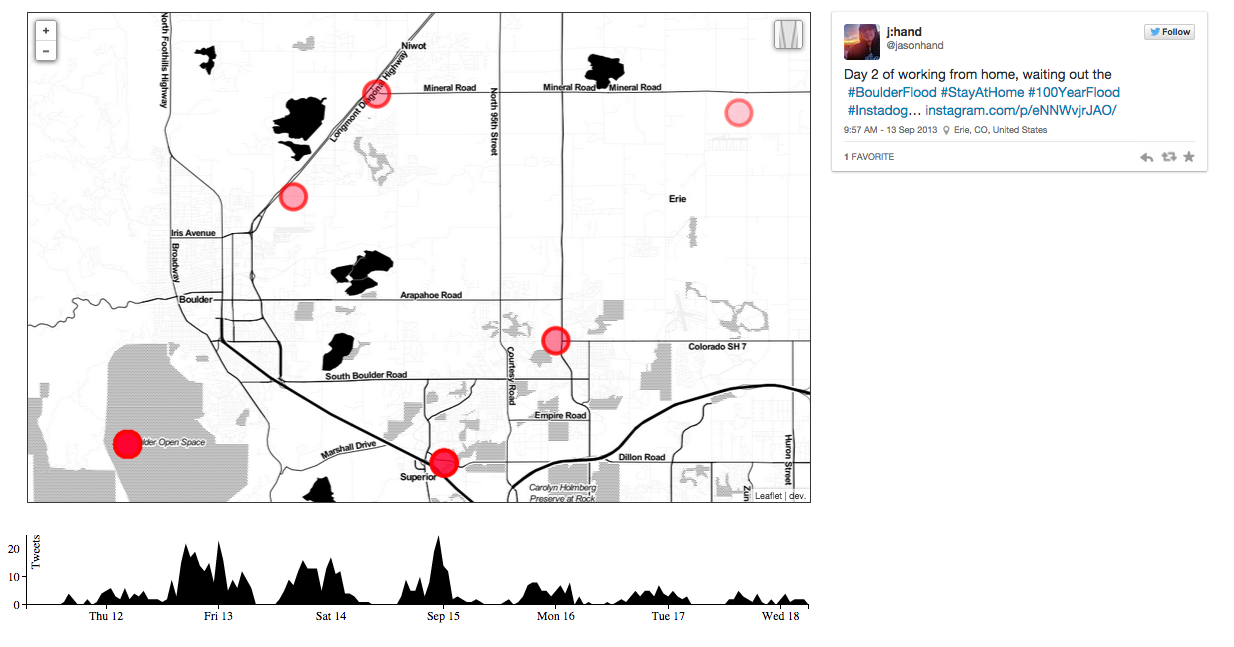
  1. Create a map and add points using the tutorial on Leaflet.js

  2. Learn how to embed tweets programatically.

  1. Build a line graph for Tweet volume.

  2. Learn jitter techniques and apply an appropriate solution.

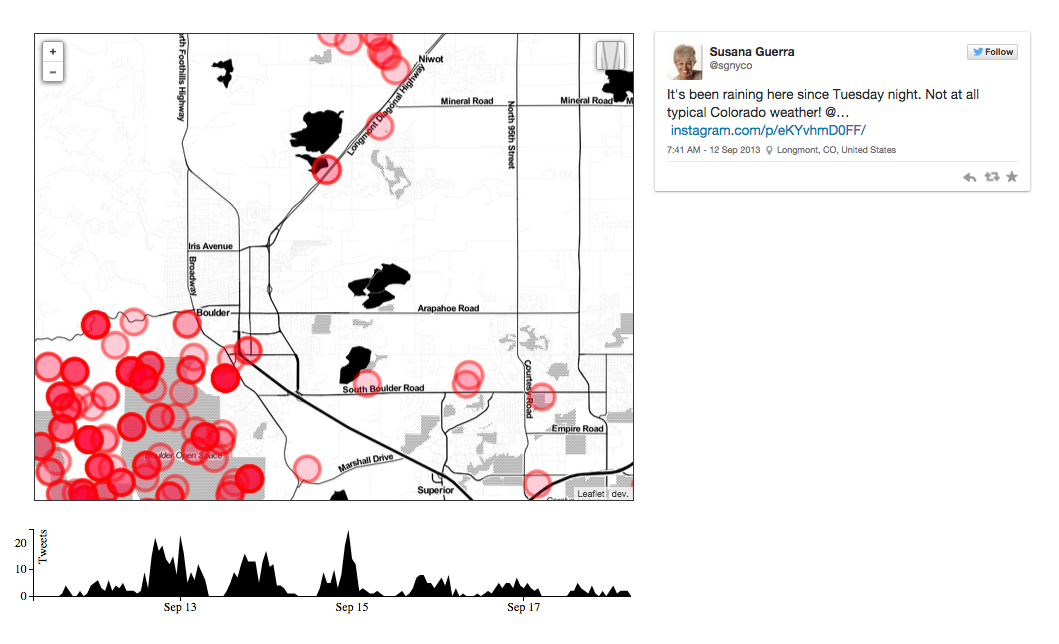
  1. Learn how to dynamically update the map based on mouse's position in the timeline.
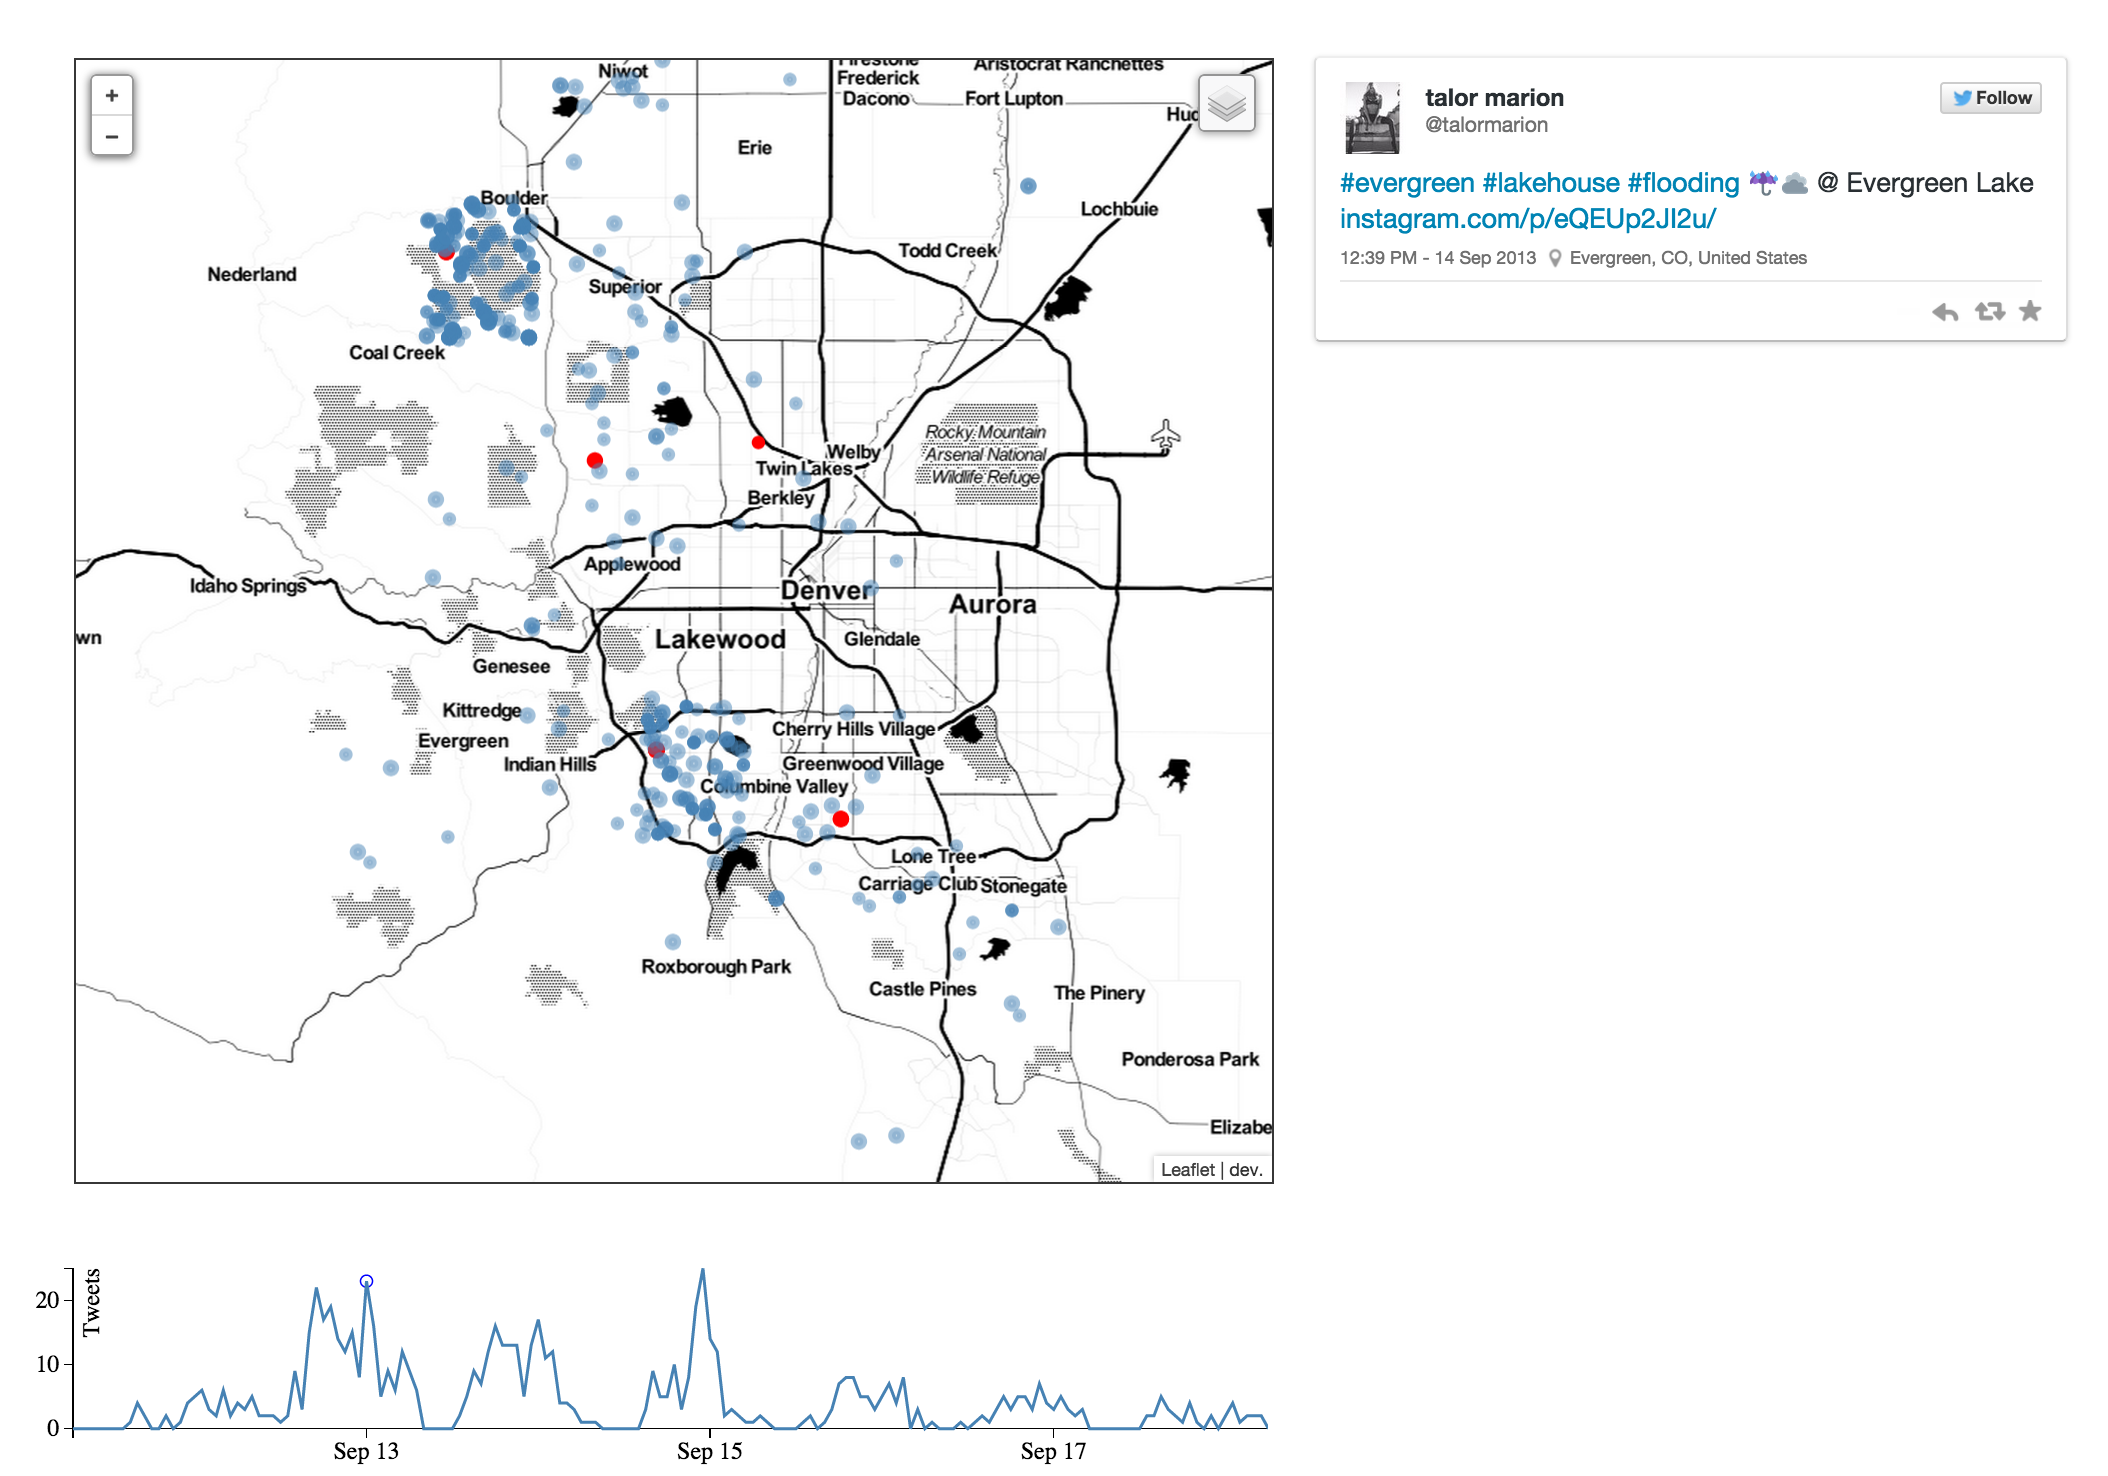
  1. Learn how to embed photos from instagram.
  1. Learn how to use a brush.
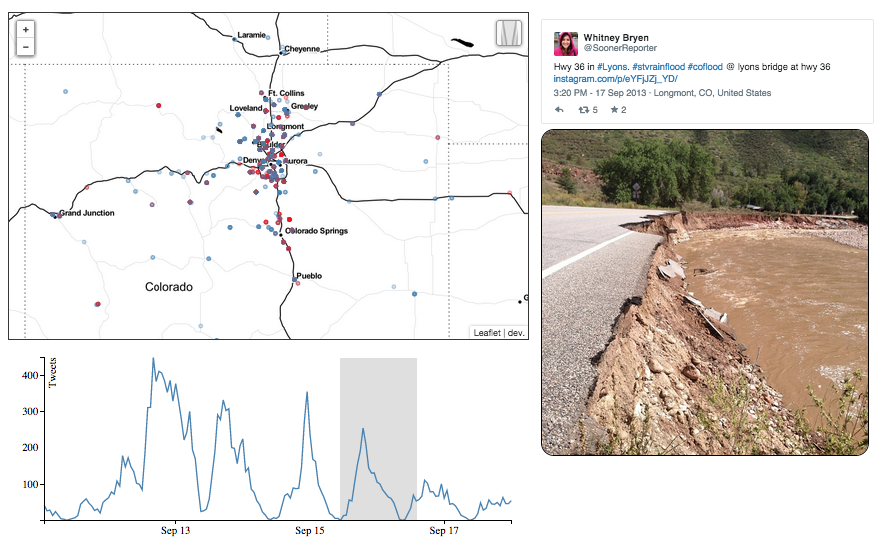
  1. Add scrolling for brush selections.
  1. Ideas for iteration:
  • New statistics field (both global and interval level).
  • Radio buttons for timeline stats.
  • Bar graph for external data by date.
  • New data format:
    • TimeStamp
      • stats (total_tweets, media_total, geo_total, optional_hashtag_count)
      • tweets_geo: (geoJson w/ properties: tweet_url, media_native, media_external, geo_type)
      • tweets_VIT: (set of tweet urls)

maperator's People

Contributors

blehman avatar jimmoffitt avatar

Stargazers

 avatar Jonathan Cipriano avatar

Watchers

 avatar

Forkers

jimmoffitt

Recommend Projects

  • React photo React

    A declarative, efficient, and flexible JavaScript library for building user interfaces.

  • Vue.js photo Vue.js

    ๐Ÿ–– Vue.js is a progressive, incrementally-adoptable JavaScript framework for building UI on the web.

  • Typescript photo Typescript

    TypeScript is a superset of JavaScript that compiles to clean JavaScript output.

  • TensorFlow photo TensorFlow

    An Open Source Machine Learning Framework for Everyone

  • Django photo Django

    The Web framework for perfectionists with deadlines.

  • D3 photo D3

    Bring data to life with SVG, Canvas and HTML. ๐Ÿ“Š๐Ÿ“ˆ๐ŸŽ‰

Recommend Topics

  • javascript

    JavaScript (JS) is a lightweight interpreted programming language with first-class functions.

  • web

    Some thing interesting about web. New door for the world.

  • server

    A server is a program made to process requests and deliver data to clients.

  • Machine learning

    Machine learning is a way of modeling and interpreting data that allows a piece of software to respond intelligently.

  • Game

    Some thing interesting about game, make everyone happy.

Recommend Org

  • Facebook photo Facebook

    We are working to build community through open source technology. NB: members must have two-factor auth.

  • Microsoft photo Microsoft

    Open source projects and samples from Microsoft.

  • Google photo Google

    Google โค๏ธ Open Source for everyone.

  • D3 photo D3

    Data-Driven Documents codes.