Code Monkey home page Code Monkey logo

django-chartjs's Introduction

Django Chartjs

Django Chartjs lets you manage charts in your Django application.

Build Status

Coverage Status on master

image

image

This is compatible with Chart.js and Highcharts JS librairies.

Using a set of predefined Class Based Views you are able to get started after writing just your SQL query.

Getting Started

Install django-chartjs:

pip install django-chartjs

Add it to your INSTALLED_APPS settings:

INSTALLED_APPS = (
    '...',
    'chartjs',
)

Using it

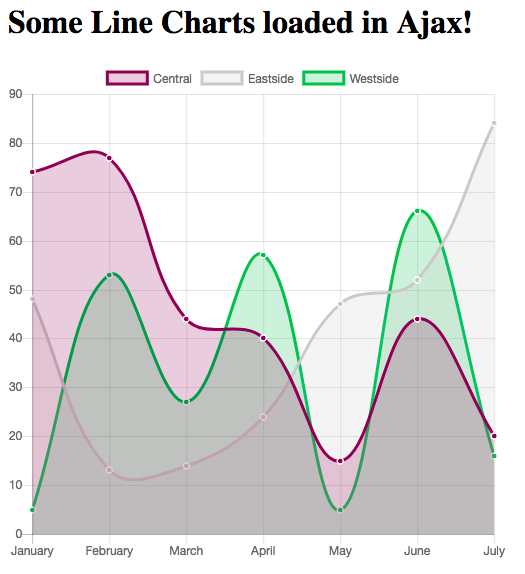
A simple Line Chart example.

1. Create the HTML file

{% load staticfiles %}
<html>
    <head>
        <title>django-chartjs line chart demo</title>
        <!--[if lte IE 8]>
            <script src="{% static 'js/excanvas.js' %}"></script>
        <![endif]-->
    </head>
    <body>
        <h1>Some Line Charts loaded in Ajax!</h1>

        <canvas id="myChart" width="500" height="400"></canvas>

        <script type="text/javascript" src="http://code.jquery.com/jquery-1.10.0.min.js"></script>
        <script type="text/javascript" src="{% static 'js/Chart.min.js' %}"></script>
        <script type="text/javascript">
            $.get('{% url "line_chart_json" %}', function(data) {
                var ctx = $("#myChart").get(0).getContext("2d");
                new Chart(ctx).Line(data);
            });
        </script>
    </body>
</html>

2. Create the view with labels and data definition

from random import randint
from django.views.generic import TemplateView
from chartjs.views.lines import BaseLineChartView


class LineChartJSONView(BaseLineChartView):
    def get_labels(self):
        """Return 7 labels."""
        return ["January", "February", "March", "April", "May", "June", "July"]

    def get_data(self):
        """Return 3 datasets to plot."""

        return [[75, 44, 92, 11, 44, 95, 35],
                [41, 92, 18, 3, 73, 87, 92],
                [87, 21, 94, 3, 90, 13, 65]]


line_chart = TemplateView.as_view(template_name='line_chart.html')
line_chart_json = LineChartJSONView.as_view()

3. Get a Chart.js Line Chart

image

It is that simple!

For other examples, don't hesitate to look at the demo project.

Also, feel free to contribute your demo!

django-chartjs's People

Contributors

benoitbryon avatar brunobord avatar johnfraney avatar natim avatar penguin359 avatar

Watchers

 avatar

Recommend Projects

  • React photo React

    A declarative, efficient, and flexible JavaScript library for building user interfaces.

  • Vue.js photo Vue.js

    🖖 Vue.js is a progressive, incrementally-adoptable JavaScript framework for building UI on the web.

  • Typescript photo Typescript

    TypeScript is a superset of JavaScript that compiles to clean JavaScript output.

  • TensorFlow photo TensorFlow

    An Open Source Machine Learning Framework for Everyone

  • Django photo Django

    The Web framework for perfectionists with deadlines.

  • D3 photo D3

    Bring data to life with SVG, Canvas and HTML. 📊📈🎉

Recommend Topics

  • javascript

    JavaScript (JS) is a lightweight interpreted programming language with first-class functions.

  • web

    Some thing interesting about web. New door for the world.

  • server

    A server is a program made to process requests and deliver data to clients.

  • Machine learning

    Machine learning is a way of modeling and interpreting data that allows a piece of software to respond intelligently.

  • Game

    Some thing interesting about game, make everyone happy.

Recommend Org

  • Facebook photo Facebook

    We are working to build community through open source technology. NB: members must have two-factor auth.

  • Microsoft photo Microsoft

    Open source projects and samples from Microsoft.

  • Google photo Google

    Google ❤️ Open Source for everyone.

  • D3 photo D3

    Data-Driven Documents codes.