Code Monkey home page Code Monkey logo

heatmap's Introduction

A Simple Tool for Ploting the Heatmap Overlay Image

HeatMap Class: 3 inputs:

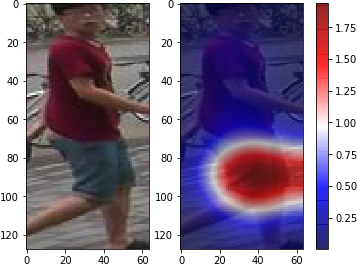
  1. image: image path (string) or image value (numpy array)
  2. heatmap: 2-D numpy value (no shape restriction)
  3. (optional) gaussian filter: mosaic smoothing (gaussian_std, default is 10. when set to 0, means no filter apply)
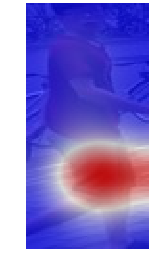
from HeatMap import HeatMap
# input a image path and a numpy array heatmap
hm = HeatMap('demo_image.jpg',heat_map)
# or input a numpy array image and heatmap
hm = HeatMap(image,heat_map,gaussian_std=0)

Method 1 plot: 6 parameters (all optional)

  1. transparency: define the transparency of heamap overlay (lower -> more transparent, default is 0.7)
  2. color_map: color map style (default is bwr)
  3. show_axis: show axis or not (boolean True/False, default is False)
  4. show_original: show original image (boolean True/False, default is False)
  5. show_colorbar: show color bar (boolean True/False, default is False)
  6. width_pad: the width padding (default is 0, set to negative value for reducing the space between figures)
#simple default plot
hm.plot()

#customised plot
hm.plot(transparency=0.6,
        color_map='seismic',
        show_axis=True,
        show_original=True,
        show_colorbar=True,
        width_pad=-10)

Method 2 save: 1 required, 8+ optional*

required

  1. filename: filename for saved figure (string)

optinal:

  1. save_path: figure saving directory (default is the current working directory)
  2. formate: figure saving fomate (jpg, jpeg, png, pdf, ps, eps and svg), default is 'png'
  3. transparency: define the transparency of heamap overlay (lower -> more transparent, default is 0.7)
  4. color_map: color map style (default is bwr)
  5. show_axis: show axis or not (boolean True/False, default is False)
  6. show_original: show original image (boolean True/False, default is False)
  7. show_colorbar: show color bar (boolean True/False, default is False)
  8. width_pad: the width padding (default is 0, set to negative value for reducing the space between figures)
  9. other parameters from pyplot.savefig can be used here
# simple save
hm.save('heatmap_result_1')
# customised save
hm.save('heatmap_result_2','png',
        transparency=0.6,
        color_map='seismic',
        show_axis=True,
        show_original=True,
        show_colorbar=True,
        width_pad=-10)

heatmap's People

Contributors

linshanify avatar

Watchers

 avatar

Recommend Projects

  • React photo React

    A declarative, efficient, and flexible JavaScript library for building user interfaces.

  • Vue.js photo Vue.js

    ๐Ÿ–– Vue.js is a progressive, incrementally-adoptable JavaScript framework for building UI on the web.

  • Typescript photo Typescript

    TypeScript is a superset of JavaScript that compiles to clean JavaScript output.

  • TensorFlow photo TensorFlow

    An Open Source Machine Learning Framework for Everyone

  • Django photo Django

    The Web framework for perfectionists with deadlines.

  • D3 photo D3

    Bring data to life with SVG, Canvas and HTML. ๐Ÿ“Š๐Ÿ“ˆ๐ŸŽ‰

Recommend Topics

  • javascript

    JavaScript (JS) is a lightweight interpreted programming language with first-class functions.

  • web

    Some thing interesting about web. New door for the world.

  • server

    A server is a program made to process requests and deliver data to clients.

  • Machine learning

    Machine learning is a way of modeling and interpreting data that allows a piece of software to respond intelligently.

  • Game

    Some thing interesting about game, make everyone happy.

Recommend Org

  • Facebook photo Facebook

    We are working to build community through open source technology. NB: members must have two-factor auth.

  • Microsoft photo Microsoft

    Open source projects and samples from Microsoft.

  • Google photo Google

    Google โค๏ธ Open Source for everyone.

  • D3 photo D3

    Data-Driven Documents codes.