![]()

birdspotter is a python package providing a toolkit to measures the social influence and botness of twitter users. It takes a twitter dump input in json or jsonl format and produces measures for:
- Social Influence: The relative amount that one user can cause another user to adopt a behaviour, such as retweeting.
- Botness: The amount that a user appears automated.
Rohit Ram, Quyu Kong, and Marian-Andrei Rizoiu. 2021. Birdspotter: A Tool for Analyzing and Labeling Twitter Users. In Proceedings of the Fourteenth ACM International Conference on Web Search and Data Mining (WSDM ’21), March 8–12, 2021, Virtual Event, Israel. ACM, New York, NY, USA, 4 pages. https://doi.org/10.1145/3437963.3441695
Rizoiu, M.A., Graham, T., Zhang, R., Zhang, Y., Ackland, R. and Xie, L. # DebateNight: The Role and Influence of Socialbots on Twitter During the 1st 2016 US Presidential Debate. In Twelfth International AAAI Conference on Web and Social Media (ICWSM'18), 2018. https://arxiv.org/abs/1802.09808
pip3 install birdspotter
To use birdspotter on your own twitter dump, replace './tweets.20150430-223406.jsonl' with the path to your twitter dump './path/to/tweet/dump.json'. In this example we use the nltk twitter-sample dataset found on kaggle. It can be downloaded here. Notably the file extension needs to be changes from .json to .jsonl.
from birdspotter import BirdSpotter
bs = BirdSpotter('./tweets.20150430-223406.jsonl')
# This may take a few minutes, go grab a coffee...
labeledUsers = bs.getLabeledUsers(out='./output.csv')
After extracting the tweets, getLabeledUsers() returns a pandas dataframe with the influence and botness labels of users and writes a csv file if a path is specified i.e. ./output.csv.
birdspotter relies on the Fasttext word embeddings wiki-news-300d-1M.vec, which will automatically be downloaded if not available in the current directory (./) or a relative data folder (./data/).
After extracting the tweets, the retweet cascades are accessible by using:
cascades = bs.getCascadesDataFrame()This dataframe includes the expected structure of the retweet cascade as given by Rizoiu et al. (2018) via the column expected_parent in this dataframe.
We can now check the users with the highest (and lowest) botness:
bs.featureDataframe[['screen_name', 'botness']].sort_values(by='botness', ascending=False)| user_id | screen_name | botness |
|---|---|---|
| 233703296 | fletchersamf | 0.909293 |
| 83661026 | Dawnhomes | 0.903377 |
| 791998387 | rnmmm_ | 0.896476 |
| 889935433 | hillsidepaul | 0.893082 |
| 389418311 | tabbycats4 | 0.884687 |
| ... | ... | ... |
| 430023390 | LooWeeeza | 0.179779 |
| 2343382280 | AntiLibDems | 0.165497 |
| 244302832 | LewMarshallsay | 0.163851 |
| 258468459 | emelyeppparker | 0.156063 |
| 246382492 | DanShatford | 0.152157 |
We visit some of these accounts to see if their botness aligns with our intuition.
On inspection, we see that Dawnhomes retweets at an exceptional rate and has a conspiratorial vibe. This seems to be automated to some extent.
rnmmm_ retweet spams a single account, suggesting it is also automated. On the otherside, DanShatford seems like a real human, who tweets occasionally and has pictures of himself and friends on his profile.
In the same way we can check the users with the highest (and lowest) influence:
bs.featureDataframe[['screen_name', 'influence']].sort_values(by='influence', ascending=False)| user_id | screen_name | influence |
|---|---|---|
| 43503 | JamesWallis | 491.000000 |
| 7076492 | Glinner | 487.562406 |
| 27110209 | GeorgetteLock | 430.000000 |
| 2384252054 | djhenshall | 274.724062 |
| 603915132 | stephcraig_ | 269.555732 |
| ... | ... | ... |
| 424432213 | ErikZoha | 1.000000 |
| 424395065 | robevansz | 1.000000 |
| 424296291 | TathamJoanne | 1.000000 |
| 423794014 | matty2992 | 1.000000 |
| 355044262 | DWTODWFA | 1.000000 |
Again, we visit this some accounts to verify our intuitions. Glinner is a blogger who writes long articles and shares these through her twitter account. It seems reasonable that she is influential. JamesWallis is a CEO, lecturer and writer so his influence score also seems to fit.
We can also see the interaction between botness and influence by plotting this:
import seaborn as sns
# We first get the influence in percentile form
bs.featureDataframe['influence percentile'] = bs.featureDataframe['influence'].rank(pct=True)

# We map the follower counts to colours
colors = sns.light_palette("#a1cfcf", input="hex", as_cmap=True)(bs.featureDataframe['followers_count'])

# We finally plot
g = sns.JointGrid(data=bs.featureDataframe, x="botness", y="influence percentile")
g = g.plot_joint(plt.scatter, color=colors, edgecolor="#a1cfcf")
g.plot_marginals(sns.distplot, kde=False, color="#c9245d")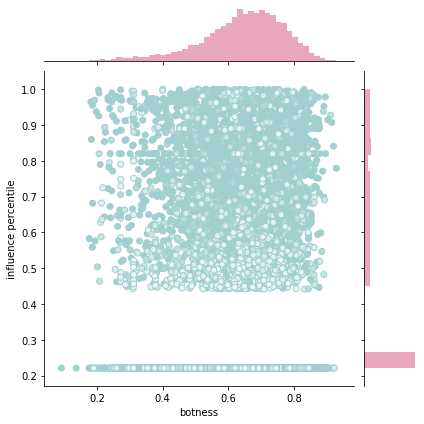
We can see from the above plot that only a fraction of the users are considered to have influence, which is consistent with how users behave on twitter, where many tweets do not garner retweets.
The marginal distribution on the top of the x-axis suggets that botness is normal, with a longer tail toward the left.
Finally, the hue of the nodes show that higher influence is correlated with higher follower counts, however there are apparent exceptions.
birdspotter provides functionality for training the botness detector with your own training data. After extracting the tweets, we run:
bs.getBotAnnotationTemplate('./annotation_file.csv')This produces a csv, with an empty column isbot to be annotated by a human, as below:
| screen_name | user_id | isbot | |
|---|---|---|---|
| 0 | 007_Rebooted | 232358211 | |
| 1 | 0151Sam64 | 351532518 | |
| 2 | 0192am | 621237594 | |
| 3 | 01EddyCordero | 324670614 | |
| 4 | 052Erik | 2807483094 | |
| ... | ... | ... | ... |
| 11719 | zoommonk | 304081311 | |
| 11720 | zosephh | 453328842 | |
| 11721 | zoumrouda | 384483993 | |
| 11722 | zwartekat | 14442577 | |
| 11723 | zygoticdeb | 21486509 |
Once annotated the botness detector can be trained with:
bs.trainClassifierModel('./annotation_file.csv')Finally, to get the new botness scores we run:
bs.getBotness()birdspotter provides functionality for defining your own word embeddings. For example:
customEmbedding # A mapping such as a dict() representing word embeddings
bs = BirdSpotter('./tweets.20150430-223406.jsonl', embeddings=customEmbedding)
Embeddings can be set through several methods, refer to setWord2VecEmbeddings.
Note the default bot training data uses the wiki-news-300d-1M.vec and as such we would need to retrain the bot detector for alternative word embeddings.
birdspotter can be accessed through the command-line to return a csv, with the recipe below:
birdspotter ./path/to/twitter/dump.json ./path/to/output/directory/
birdspotter functionality can be accessed in R via the reticulate package. reticulate still requires a python installation on your system and birdspotter to be installed. The following produces the same results as the standard usage.
install.packages("reticulate")
library(reticulate)
use_python(Sys.which("python3"))
birdspotter <- import("birdspotter")
bs <- birdspotter$BirdSpotter("./tweets.20150430-223406.jsonl")
bs$getLabeledDataFrame(out = './output.csv')The development of this package was partially supported through a UTS Data Science Institute seed grant.