TIMECOP

TIMECOP is a RESTful webservice engine that evaluates univariate and multivariate timeseries. It considerates that the time series has 3 stages: the current state of the time series as the last five points, the past state as all the previous points before the current state and the future state as the forecast of the next steps(custom number).
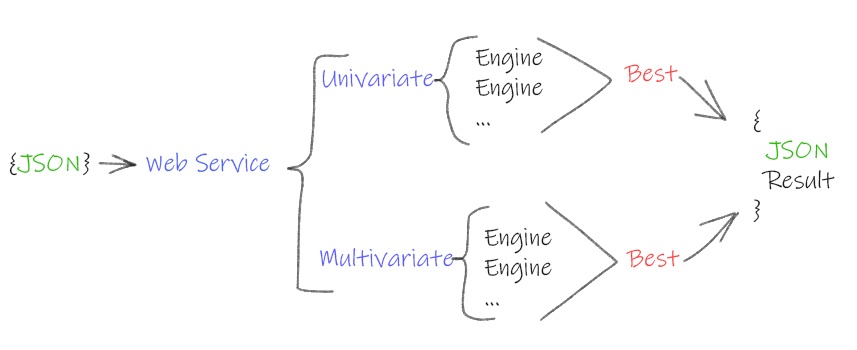
The aim of TIMECOP is to get insight on the behavior of the time series. To achieve this, the engine compares several time series forecasting algorithms and select the best one according to the MAE (mean absolute error) metric. The different algorithms that compounds the engine are: VAR, Holt-Winters, ARIMA, and Recurrent Neural Networks using LSTM cells.
In the end we will obtain:
-
The best of evaluated algos regarding the MAE metric.
-
Past anomalies. The past state points of the time series that have been considerated as anomalous.
-
Current anomalies. The engine returns a flag that tells you whether there are anomalies in the last 5 points or not and the current anomalous points if there were.
-
Future time series forecast of the next points.
Getting Started
To use TIMECOP engine you will need to send a univariate or multivariate time series data points in a json format to the webservice. The only HTTP method created is POST. The service will then return you a json with the result of the analysis. The basic process is shown in the next figure:
Main Features
- Future: Forecast n steps
- Past: Sensibility custom anomaly detection
- Now: Sensibility custom anomaly detection
Secondary Features
- Delta / Full timesteps upload
- Train / Use best known model in production envirotnment
- Python API for easy integration in notebooks / python apps
- Backend Database
Algorithms
Univariate
- Long Short Term Memory networks
- Facebook prophet
- vector autoregression
- Gluon-ts
- Holtwinters
- ARIMA
- N-beats
- Temporal Convolutional Network
- TBATS
Multivariate
- Long Short Term Memory networks
- vector autoregression
- Vector error correction model
- SArimaX
Metrics
- Mean Absolute Error
- Mean Squeared Error
- Root Mean Squeared Error
- Symmetric mean absolute percentage error
- Mean Absolute Percentage Error
Advanced features
- Trend
- ChangePoints
- Confidence interval
Installation
To use timecop the easiest way is to deploy the docker image made with the last version. The steps to use the docker images are:
Install docker
Download timecop docker image:
docker pull trakuo/timecop:devel
Execute a container with the timecop image:
docker run --name timecoprunning -p 3000:80 trakuo/timecop:devel
Open web test page to test timecop is running
http://localhost:3000/static/index.html
pip python package
A python package to invoke Timecop from any python code, using the RESTful Web Server API for you. For more information, go to the pip module
UNIVARIATE
import timecopts as tc
TS=[1,2,3,4,5,6,7,8,9,2,3,4,5,6,7,8,9,2,3,4,5,6,7,8,9,2,3,4,5,6,7,8,9,2,3,4,5,6,7,8,9,2,3,4,5,6,7,8,9,2,3,4,5,6,7,8,9,2,3,4,5,6,7,8,9,2,3,4,5,6,7,8,9,2,3,4,5,6,7,8,9]

URL = 'URL_timecop_server'
output_json = tc.timecop_univariate(URL,name='test_timeseries', TS,  train=True, restart=True)
MULTIVARIATE
import timecopts as tc
TS_main=[1,2,3,4,5,6,7,8,9,2,3,4,5,6,7,8,9,2,3,4,5,6,7,8,9,2,3,4,5,6,7,8,9,2,3,4,5,6,7,8,9,2,3,4,5,6,7,8,9,2,3,4,5,6,7,8,9,2,3,4,5,6,7,8,9,2,3,4,5,6,7,8,9,2,3,4,5,6,7,8,9]

TS_timeseries= []
temp = {}
temp['data'] = [1,2,3,4,5,6,7,8,9,2,3,4,5,6,7,8,9,2,3,4,5,6,7,8,9,2,3,4,5,6,7,8,9,2,3,4,5,6,7,8,9,2,3,4,5,6,7,8,9,2,3,4,5,6,7,8,9,2,3,4,5,6,7,8,9,2,3,4,5,6,7,8,9,2,3,4,5,6,7,8,9]
TS_timeseries.append(temp)
temp2 = {}
temp2['data'] = [1,2,3,4,5,6,7,8,9,2,3,4,5,6,7,8,9,2,3,4,5,6,7,8,9,2,3,4,5,6,7,8,9,2,3,4,5,6,7,8,9,2,3,4,5,6,7,8,9,2,3,4,5,6,7,8,9,2,3,4,5,6,7,8,9,2,3,4,5,6,7,8,9,2,3,4,5,6,7,8,9]
TS_timeseries.append(temp2)

URL = 'URL_timecop_server'
output_json = tc.timecop_multivariate(URL,name='test_timeseries', TS_main,TS_timeseries,  train=True, restart=True)
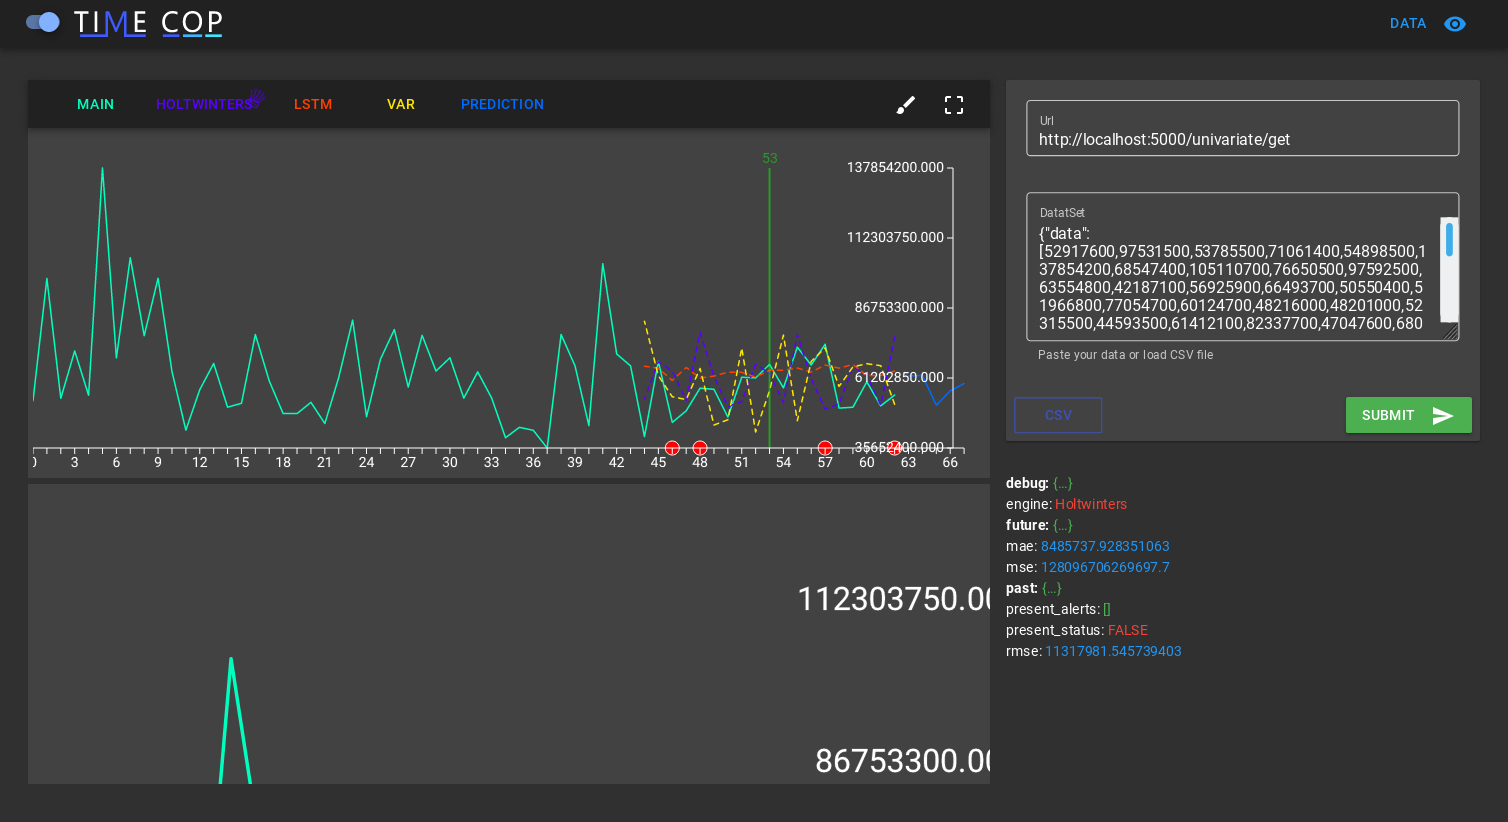
Web test page
to use timecop there is another option, a web page that you can use locally and test timecop from CSV files before integrating it into any application
INVOKE
The way to invoke the webservice is to POST the data points in a json format providing the webservice URL.
In the case of univariate time series we will need to send a json with a key value pair in the following format:
Key name: "data".
Values of data: array representing the time series points.
Key name: "name".
Values of data: String with the name of the time series.
Key name: "train".
Values of data: Boolean. If True, timecop will find the best algo for this timeseries. If False, will use the last best model for this timeseries.
Key name: "desv_metric".
Values of data: Numeric. To detect anomalies, is the multiplier to MAE. Bigger less alerts.
Key name: "restart".
Values of data: Boolean. If True, delete all historical timeseries data. Only using the sending data.
In the case of multivariate time series we want to analyze and predict one time series with respect to the rest of time series. For example if we have 3 time series, we will need to specify the time series that we want to predict whit respect to the 2 others. The json has to meet the following format:
Key name: "timeseries".
Values of data: several key value pairs representing the time series that will help us to predict the target time series:
         Key name: "data".
         Values of data: array representing the time series points.
         ....

Key name: "main".
Values of data: array representing the target time series points that we want to analyze and predict.
Key name: "name".
Values of data: String with the name of the time series.
Key name: "train".
Values of data: Boolean. If True, timecop will find the best algo for this timeseries. If False, will use the last best model for this timeseries.
Here it is shown two examples invoking the webservice with a univariate time series and a multivariate one:
UNIVARIATE
curl -i -H "Content-Type: application/json" -X POST -d '
    {
        "data":[ 22125, 25817, 28779, 20960, 22254, 27392, 29945,16933, 17892,20533, 23569, 22417, 22084, 26580, 27454, 24081, 23451, 28991, 31386, 16896, 20045, 23471, 21747, 25621, 23859, 25500, 30998, 24475, 23145, 29701, 34365, 17556, 22077, 5702,22214,26886, 23191, 27831, 35406, 23195, 25110, 30009, 36242, 18450, 21845, 26488, 22394, 28057, 25451, 24872, 33424, 24052, 28449, 33533, 37351, 19969, 21701, 26249, 24493, 24603,26485, 30723, 34569, 26689, 26157, 32064, 38870, 21337, 19419, 23166, 28286, 24570, 24001, 33151, 24878, 26804, 28967, 33311, 40226, 20504, 23060, 23562, 27562, 23940, 24584,34303, 25517, 23494, 29095, 32903, 34379, 16991, 21109, 23740, 25552, 21752, 20294, 29009, 25500, 24166, 26960, 31222, 38641, 14672, 17543, 25453, 32683, 22449, 22316]

     }

' http://127.0.0.1:5000/univariate
MULTIVARIATE
curl -i -H "Content-Type: application/json" -X POST -d '
    {
        "timeseries":[
            {
                "data": [0.9500000476837158, 1.0, 1.0, 0.06666667014360428, 0.42222222685813904, 0.0833333358168602, 0.09444444626569748, 0.23333333432674408, 0.0833333358168602, 0.9833333492279053, 0.04444444552063942, 1.0, 1.0, 1.0, 1.0, 1.0, 1.0, 1.0, 1.0, 1.0, 1.0, 1.0, 1.0, 1.0, 0.08888889104127884, 1.0, 0.9277778267860413, 0.5166666507720947, 0.9666666984558105, 0.6666666865348816, 0.3333333432674408, 0.9055556058883667, 0.8277778029441833, 0.5777778029441833, 1.0, 1.0, 0.08888889104127884, 1.0, 1.0, 1.0, 1.0, 1.0, 1.0, 1.0, 1.0, 1.0, 1.0, 1.0, 0.05000000074505806, 0.5166666507720947, 1.0, 0.03888889029622078, 0.03888889029622078, 0.4166666865348816, 0.03888889029622078, 0.03888889029622078, 0.06666667014360428, 0.5777778029441833, 0.3055555522441864, 1.0] },
             {
                "data": [0.5, 1.0, 1.0, 0.5, 0.5, 0.5, 0.5, 0.5, 0.5, 0.5, 0.5, 1.0, 1.0, 1.0, 1.0, 1.0, 1.0, 1.0, 1.0, 1.0, 1.0, 1.0, 1.0, 1.0, 0.5, 1.0, 0.5, 0.5, 0.375, 0.5, 0.5, 0.5, 0.5, 0.5, 1.0, 1.0, 0.5, 1.0, 1.0, 1.0, 1.0, 1.0, 1.0, 1.0, 1.0, 1.0, 1.0, 1.0, 0.5, 0.5, 1.0, 0.5, 0.5, 0.5, 0.5, 0.5, 0.5, 0.5, 0.5, 1.0]
             }],

        "main": [0.8571429252624512, 1.0, 1.0, 0.5714285969734192, 0.1428571492433548, 0.1428571492433548, 0.1428571492433548, 0.1428571492433548, 0.1428571492433548, 0.4285714626312256, 0.5714285969734192, 1.0, 1.0, 1.0, 1.0, 1.0, 1.0, 1.0, 1.0, 1.0, 1.0, 1.0, 1.0, 1.0, 0.8571429252624512, 1.0, 0.0, 0.1428571492433548, 0.2857142984867096, 0.1428571492433548, 0.1428571492433548, 0.1428571492433548, 0.1428571492433548, 0.1428571492433548, 1.0, 1.0, 0.8571429252624512, 1.0, 1.0, 1.0, 1.0, 1.0, 1.0, 1.0, 1.0, 1.0, 1.0, 1.0, 0.8571429252624512, 0.4285714626312256, 1.0, 0.0, 0.0, 0.1428571492433548, 0.0, 0.0, 0.0, 0.1428571492433548, 0.1428571492433548, 1.0]

   }
' http://127.0.0.1:5000/multivariate
RESPONSE
The response of the webservice will provide the info of the behaviour of the time series in a json format as explained previously.
An example response will be:
{
    "engine": "Holtwinters",

    "future": {
                  "126": 15136.0, "127": 16733.0, "128": 20016.0, "129": 17708.0, "130": 18019.0, "131": 19227.0, "132": 22893.0, "133":          23739.0, "134": 21133.0, "135": 22591.0 },

    "mae": 5994.289473684211,

    "mse": 50689736.39473684,

    "rmse": 7119.672492097992,

    "past": [ {
                  "anomaly_score": 0.0,
                  "expected value": 20016.0,
                  "mae": 5994.289473684211,
                  "mse": 50689736.39473684,
                  "real_value": 33151.0,
                  "rmse": 7119.672492097992,
                  "step": 90.0 },
               {
                  "anomaly_score": 1.0,
                  "expected value": 23739.0,
                  "mae": 5994.289473684211,
                  "mse": 50689736.39473684,
                  "real_value": 40226.0,
                  "rmse": 7119.672492097992,
                  "step": 95.0 },
               {
                  "anomaly_score": 0.3460620525059665,
                  "expected value": 20008.0,
                  "mae": 5994.289473684211,
                  "mse": 50689736.39473684,
                  "real_value": 34303.0,
                  "rmse": 7119.672492097992, "step": 102.0
               } ],

     "present_alerts": [],

     "present_status": "FALSE"
}
Python API Getting Started with the python API
A python package to invoke Timecop from any python code, using the RESTful Web Server API for you. For more information, go to the pip module
UNIVARIATE
import timecopts as tc
TS=[1,2,3,4,5,6,7,8,9,2,3,4,5,6,7,8,9,2,3,4,5,6,7,8,9,2,3,4,5,6,7,8,9,2,3,4,5,6,7,8,9,2,3,4,5,6,7,8,9,2,3,4,5,6,7,8,9,2,3,4,5,6,7,8,9,2,3,4,5,6,7,8,9,2,3,4,5,6,7,8,9]

URL = 'URL_timecop_server'
output_json = tc.timecop_univariate(URL,name='test_timeseries', TS,  train=True, restart=True)
MULTIVARIATE
import timecopts as tc
TS_main=[1,2,3,4,5,6,7,8,9,2,3,4,5,6,7,8,9,2,3,4,5,6,7,8,9,2,3,4,5,6,7,8,9,2,3,4,5,6,7,8,9,2,3,4,5,6,7,8,9,2,3,4,5,6,7,8,9,2,3,4,5,6,7,8,9,2,3,4,5,6,7,8,9,2,3,4,5,6,7,8,9]

TS_timeseries= []
temp = {}
temp['data'] = [1,2,3,4,5,6,7,8,9,2,3,4,5,6,7,8,9,2,3,4,5,6,7,8,9,2,3,4,5,6,7,8,9,2,3,4,5,6,7,8,9,2,3,4,5,6,7,8,9,2,3,4,5,6,7,8,9,2,3,4,5,6,7,8,9,2,3,4,5,6,7,8,9,2,3,4,5,6,7,8,9]
TS_timeseries.append(temp)
temp2 = {}
temp2['data'] = [1,2,3,4,5,6,7,8,9,2,3,4,5,6,7,8,9,2,3,4,5,6,7,8,9,2,3,4,5,6,7,8,9,2,3,4,5,6,7,8,9,2,3,4,5,6,7,8,9,2,3,4,5,6,7,8,9,2,3,4,5,6,7,8,9,2,3,4,5,6,7,8,9,2,3,4,5,6,7,8,9]
TS_timeseries.append(temp2)

URL = 'URL_timecop_server'
output_json = tc.timecop_multivariate(URL,name='test_timeseries', TS_main,TS_timeseries,  train=True, restart=True)
Response explained
Here it is explained each element of the response:
WINNER ENGINE : The best engine regarding the MSE metric
"engine": "Holtwinters",
FORECAST : The forecast of the time series next 5 points
"future": {
"126": 15136.0, "127": 16733.0, "128": 20016.0, "129": 17708.0, "130": 18019.0, "131": 19227.0, "132": 22893.0, "133": 23739.0, "134": 21133.0, "135": 22591.0 },
METRICS : Basic metrics of the winner engine
"mae": 5994.289473684211, "mse": 50689736.39473684, "rmse": 7119.672492097992,
ANOMALIES IN THE PAST : Previous anomalies and its metrics
"past": [ { "anomaly_score": 0.0, "expected value": 20016.0, "mae": 5994.289473684211, "mse": 50689736.39473684, "real_value": 33151.0, "rmse": 7119.672492097992, "step": 90.0 }, { "anomaly_score": 1.0, "expected value": 23739.0, "mae": 5994.289473684211, "mse": 50689736.39473684, "real_value": 40226.0, "rmse": 7119.672492097992, "step": 95.0 }, { "anomaly_score": 0.3460620525059665, "expected value": 20008.0, "mae": 5994.289473684211, "mse": 50689736.39473684, "real_value": 34303.0, "rmse": 7119.672492097992, "step": 102.0 } ],
PRESENT STATUS : Currently alert points and alert flag
"present_alerts": [], "present_status": "FALSE" }