The GnuplotCSharp project makes it easy to use gnuplot in C# applications by adding a single file (GnuPlot.cs) to your existing Visual Studio project. Gnuplot has a richly documented set of commands, and this project brings these advanced graphing capabilities into the C# / Visual Studio programming environment.
Note: gnuplot executable must be available on the system, or can be included in your project.
Many popular scientific publications with graphs use gnuplot. It is extremely well documented and handles 2D, 3D (surface and pointcloud), heatmap, png, jpg, and much more using simple math syntax as well as simple text-based data. And it supports many output formats, as well interactive zooming/rotating.
It only takes about 10 lines of code to wire up C# to send commands to gnuplot. But as soon as you try to send arrays of data, overlay multiple graphs, and generally work with gnuplot from C#, you'll immediately see that you have to add all kinds of utility functions to not clutter up your code.
Gnuplot.C# provides a nice set of functions to make it easy to use all the power of gnuplot to visualize your data in C#. Check out the examples of how easy it is to visualize functions and data.
Just put gnuplot.cs in your project, change the first line from C:\gnuplot\bin to the location of gnuplot.exe on your system.
If you haven't installed gnuplot on your system, download it at http://sourceforge.net/projects/gnuplot/files/ or http://www.gnuplot.info
In 2012, I completed the excellent Machine Learning course by Andrew Ng (Coursera). We used Octave/Matlab, and Octave uses gnuplot for its graphs. I wanted to recreate all the class projects in C# for practice. Microsoft has a cloud numerics library, so C# is a good choice for machine learning if you want to for example, train your machine learning algorithm on a large dataset and scale across many computers in the Azure cloud.
I believe this project will be helpful to anyone who wants to visualize data/functions in C#, so I have released it here.
To see various demos in action, download the files, open the solution (Visual Studio) and run Demo.cs (make sure you've installed gnuplot first)
If you are not familiar with gnuplot, I recommend you visit www.gnuplot.info and see all the demos there. Then come back for how to do it all in C#.
Plot a function
GnuPlot.Plot("sin(x) + 2");
Plot a function with custom color and line width (see gnuplot documentation)
GnuPlot.Plot("sin(x) + 2", "lc rgb 'magenta' lw 5");
Plot an array of y values
double[] Y = new double[] { -4, 6.5, -2, 3, -8, -5, 11, 4, -5, 10 };
GnuPlot.Plot(Y);
Plot an array of x and y values (notice the x values vs previous graph)
double[] X = new double[] { -10, -8.5, -2, 1, 6, 9, 10, 14, 15, 19 };
double[] Y = new double[] { -4, 6.5, -2, 3, -8, -5, 11, 4, -5, 10 };
GnuPlot.Plot(X, Y);
Overlay multiple graphs (HoldOn causes future plots to be overlayed. HoldOff make future plots replace previous.
GnuPlot.HoldOn();
GnuPlot.Plot("cos(x) + x");
GnuPlot.Plot("cos(2*x)", "with points pt 3");
plot a 3D function
GnuPlot.SPlot("1 / (.05*x*x + .05*y*y + 1)");
Set the number of lines with isosamples to control "detail" (see gnuplot documentation)
GnuPlot.Set("isosamples 30");
GnuPlot.SPlot("1 / (.05*x*x + .05*y*y + 1)");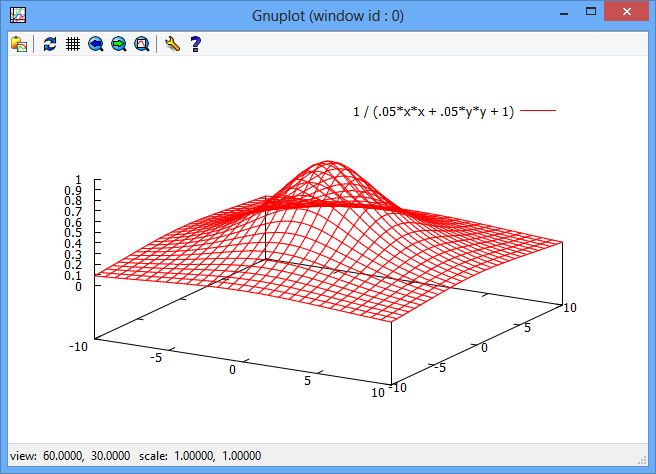
Hide back faces with hidden3d to make it "solid" (see gnuplot documentation)
GnuPlot.Set("isosamples 30", "hidden3d");
GnuPlot.SPlot("1 / (.05*x*x + .05*y*y + 1)");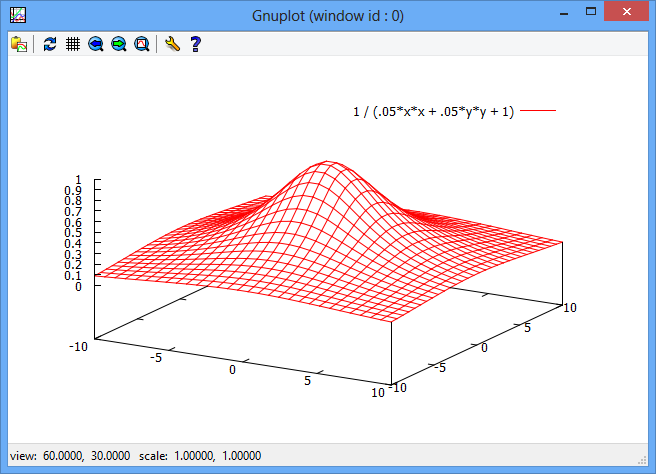
plot a file with 3D data data.txt (this can be in any format accepted by gnuplot. Here it's x,y,z points for two separate polygons)
-1 -1 -1
-1 1 -1
-.1 .1 1
-.1 -.1 1
-1 -1 -1


.1 .1 1
.1 -.1 1
1 -1 -1
1 1 -1
.1 .1 1
to plot the above file
splot ("data.txt");
plot an array of z values (specify y size to break the array into a square grid)
double[] Z = new double[] { -4, -2.5, 1, 3,    -3, -2, 3, 4,    -1, 2, 6, 8 };
GnuPlot.Set("pm3d"); //color planes by z value
GnuPlot.SPlot(4, Z); //split the 12 z values into rows of 4 points
plot a grid of z values and use some styling (see gnuplot docs for style commands)
double[,] Z = new double[,] { {-4,-2.5,1,3},  {-3,-2,3,4},   {-1,2,6,8 } };
GnuPlot.Set("pm3d","palette gray");      //we'll make monochrome color based on height of the plane
GnuPlot.SPlot(Z,"with points pointtype 6"); //we'll try with points at vertexes instead of lines
plot a point cloud of x, y, and z values
        //make some random data points
        double[] X = new double[100];
        double[] Y = new double[100];
        double[] Z = new double[100];
        Random r=new Random();
        for (int i = 0; i < 100; i++)
        {
            X[i] = r.Next(30) - 15;
            Y[i] = r.Next(50) - 25;
            Z[i] = r.Next(20) - 10;
        }

        //set the range for the x,y,z axis and plot (using pointtype triangle and color blue)
        GnuPlot.Set("xrange[-30:30]", "yrange[-30:30]", "zrange[-30:30]");
        GnuPlot.SPlot(X, Y, Z, "with points pointtype 8 lc rgb 'blue'");
plot a surface based on random unordered x, y, and z values
        //make 20 random data points
        double[] X = new double[20];
        double[] Y = new double[20];
        double[] Z = new double[20];
        Random r=new Random();
        for (int i = 0; i < 20; i++)
        {
            X[i] = r.Next(30) - 15;
            Y[i] = r.Next(50) - 25;
            Z[i] = r.Next(20) - 10;
        }

        //fit the points to a surface grid of 40x40 with smoothing level 2
        GnuPlot.Set("dgrid3d 40,40,2");

        //set the range for the x,y,z axis and plot (using pm3d to map height to color)
        GnuPlot.Set("xrange[-30:30]", "yrange[-30:30]", "zrange[-30:30]");
        GnuPlot.SPlot(X, Y, Z,"with pm3d");
Contour maps are very useful to make it easier to see the peaks and valleys, and see what areas have the same range of values. Gnuplot lets you show contour maps, but you can't draw 2d points and lines on them. The Contour methods generate a 2D contour map, allowing you to plot further data points on it.
GnuPlot.Unset("key");                                                      //hide the key or legend
GnuPlot.Set("cntrparam levels 20","isosamples 50", "xr[-5:5]","yr[-6:6]"); //notice cntrparam levels (# height levels)
GnuPlot.Contour("sin(x) * cos(y)+x","lc rgb 'blue'");                      //plot a 3d function (or data)
double[,] Z = new double[,]{{0,0,0,1,2,2,1,0,0,0},
                            {0,0,2,3,3,3,3,2,0,0},
                            {0,2,3,4,4,4,4,3,2,0},
                            {2,3,4,5,5,5,5,4,3,2},
                            {3,4,5,6,7,7,6,5,4,3},
                            {3,4,5,6,7,7,6,5,4,3},
                            {2,3,4,5,5,5,5,4,3,2},
                            {0,2,3,4,4,4,4,3,2,0},
                            {0,0,2,3,3,3,3,2,0,0},
                            {0,0,0,1,2,2,1,0,0,0}};
GnuPlot.HeatMap(Z); 
GnuPlot.HoldOn();
GnuPlot.Set("title 'Phase-Locked Signals'");
GnuPlot.Set("samples 2000");
GnuPlot.Unset("key");
GnuPlot.Plot("sin(x)");
GnuPlot.Plot("cos(x)");
Plot
Splot
Contour
Heatmap
Set
Unset
HoldOn
HoldOff
SaveData
WriteLine
Write
Replot
Use this code at your own risk. The author cannot guarantee that it is free of defects or that it will work as you expect. It's less than 1000 lines of code, so just look at it, and decide if it works for you.
Happy coding!!


