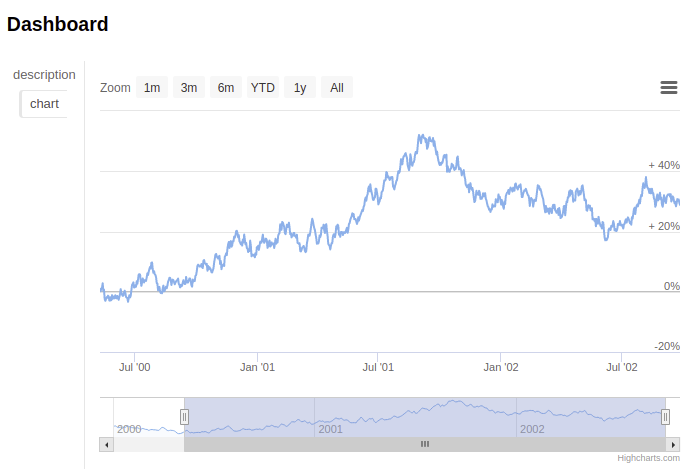
Working in JupyterLab, it appears that a second data series cannot be added to an existing chart.
import panel_highcharts as ph

configuration = {
 'title': {'text': 'Stock Chart: UPST'},
 'rangeSelector': {'selected': 1},
 'xAxis': {'type': 'datetime'},
 'series': [{'id': 'pricehistory',
   'name': 'UPST Price History',
   'data': [[1608076800000.0, 29.47],
    [1608163200000.0, 35.77],
    [1608249600000.0, 44.09],
    [1608508800000.0, 41.1],
    [1608595200000.0, 47.84],
    [1608681600000.0, 46.32],
    [1608768000000.0, 43.96],
    [1609113600000.0, 42.63],
    [1609200000000.0, 40.75],
    [1609286400000.0, 38.87],
    [1609372800000.0, 40.75],
    [1609718400000.0, 43.99],
    [1609804800000.0, 48.37],
    [1609891200000.0, 52.14],
    [1609977600000.0, 55.39],
    [1610064000000.0, 52.73],
    [1610323200000.0, 54.71],
    [1610409600000.0, 62.48],
    [1610496000000.0, 57.88],
    [1610582400000.0, 60.64],
    [1610668800000.0, 56.0],
    [1611014400000.0, 54.28],
    [1611100800000.0, 55.22],
    [1611187200000.0, 63.77],
    [1611273600000.0, 64.47],
    [1611532800000.0, 67.36],
    [1611619200000.0, 64.45],
    [1611705600000.0, 64.7],
    [1611792000000.0, 65.15],
    [1611878400000.0, 62.19],
    [1612137600000.0, 70.25],
    [1612224000000.0, 75.47],
    [1612310400000.0, 79.75],
    [1612396800000.0, 75.75],
    [1612483200000.0, 75.24],
    [1612742400000.0, 76.0],
    [1612828800000.0, 80.25],
    [1612915200000.0, 91.04],
    [1613001600000.0, 95.13],
    [1613088000000.0, 102.18],
    [1613433600000.0, 92.28],
    [1613520000000.0, 87.24],
    [1613606400000.0, 82.32],
    [1613692800000.0, 89.73],
    [1613952000000.0, 77.01],
    [1614038400000.0, 73.06],
    [1614124800000.0, 74.51],
    [1614211200000.0, 68.52],
    [1614297600000.0, 65.64],
    [1614556800000.0, 66.65],
    [1614643200000.0, 60.36],
    [1614729600000.0, 57.58],
    [1614816000000.0, 54.92],
    [1614902400000.0, 51.16],
    [1615161600000.0, 46.87],
    [1615248000000.0, 53.24],
    [1615334400000.0, 52.99],
    [1615420800000.0, 59.24],
    [1615507200000.0, 58.0],
    [1615766400000.0, 62.93],
    [1615852800000.0, 60.05],
    [1615939200000.0, 60.79],
    [1616025600000.0, 115.09],
    [1616112000000.0, 125.28],
    [1616371200000.0, 164.87],
    [1616457600000.0, 118.48],
    [1616544000000.0, 112.28],
    [1616630400000.0, 123.73],
    [1616716800000.0, 142.95],
    [1616976000000.0, 134.49],
    [1617062400000.0, 129.28],
    [1617148800000.0, 128.86],
    [1617235200000.0, 144.28],
    [1617580800000.0, 140.52],
    [1617667200000.0, 144.3],
    [1617753600000.0, 126.07],
    [1617840000000.0, 123.33],
    [1617926400000.0, 127.29],
    [1618185600000.0, 112.46],
    [1618272000000.0, 110.46],
    [1618358400000.0, 104.51],
    [1618444800000.0, 110.4],
    [1618531200000.0, 104.65],
    [1618790400000.0, 97.55],
    [1618876800000.0, 91.79],
    [1618963200000.0, 100.61],
    [1619049600000.0, 101.44],
    [1619136000000.0, 107.38],
    [1619395200000.0, 111.24],
    [1619481600000.0, 116.33],
    [1619568000000.0, 113.75],
    [1619654400000.0, 108.56],
    [1619740800000.0, 109.02],
    [1620000000000.0, 114.2],
    [1620086400000.0, 107.36],
    [1620172800000.0, 98.19],
    [1620259200000.0, 92.04],
    [1620345600000.0, 95.97],
    [1620604800000.0, 88.21],
    [1620691200000.0, 89.44],
    [1620777600000.0, 91.82],
    [1620864000000.0, 84.05],
    [1620950400000.0, 103.36],
    [1621209600000.0, 115.0],
    [1621296000000.0, 119.49],
    [1621382400000.0, 132.91],
    [1621468800000.0, 139.08],
    [1621555200000.0, 153.85],
    [1621814400000.0, 139.77],
    [1621900800000.0, 133.7],
    [1621987200000.0, 146.58],
    [1622073600000.0, 166.83],
    [1622160000000.0, 148.22],
    [1622505600000.0, 144.49],
    [1622592000000.0, 157.14],
    [1622678400000.0, 164.83],
    [1622764800000.0, 164.04],
    [1623024000000.0, 170.0],
    [1623110400000.0, 162.01],
    [1623196800000.0, 152.43],
    [1623283200000.0, 146.42],
    [1623369600000.0, 125.505],
    [1623628800000.0, 124.69],
    [1623715200000.0, 123.03]],
   'tooltip': {'valueDecimals': 2}}]
}
chart = ph.HighStock(object=configuration, sizing_mode="stretch_width", height=400)
As far as I can determine, there is no other mechanism to dynamically add a data series.