Code Monkey home page Code Monkey logo

angular-gauge's Introduction

angular-gauge

npm version Build Status peerDependencies Status devDependencies Status contributions welcome

A reusable gauge directive for Angular 1.x apps and dashboards. It provides many configurationable options to customize according to your needs. Checkout the live demo here.

If you are looking for Gauge Component for Angular 4 and beyond, checkout ngx-gauge.

alt text

NOTE: In angular-gauge 2.x, some breaking changes have been introduced. If you are upgrading from v1.x.x version to v2.x.x then checkout the Upgrade Guide first.

Usage

Install using npm

npm install angularjs-gauge

Install using Bower

bower install angularjs-gauge

Install manually

git clone https://github.com/ashish-chopra/angular-gauge.git

Copy the files from dist/ manually into your project folder.Then, add the script to your code (after adding the dependency of Angular 1.5) and resolving the paths as given below:

<head>
  ...
<head>
<body>
  ...
</body>
  <script src="vendor/angular/angular.min.js"></script>
  <script src="vendor/angularjs-gauge/dist/angularjs-gauge.min.js"></script>

Add as dependency in your module

angular.module('yourApp', ['angularjs-gauge']);

Use it in your HTML markup like this

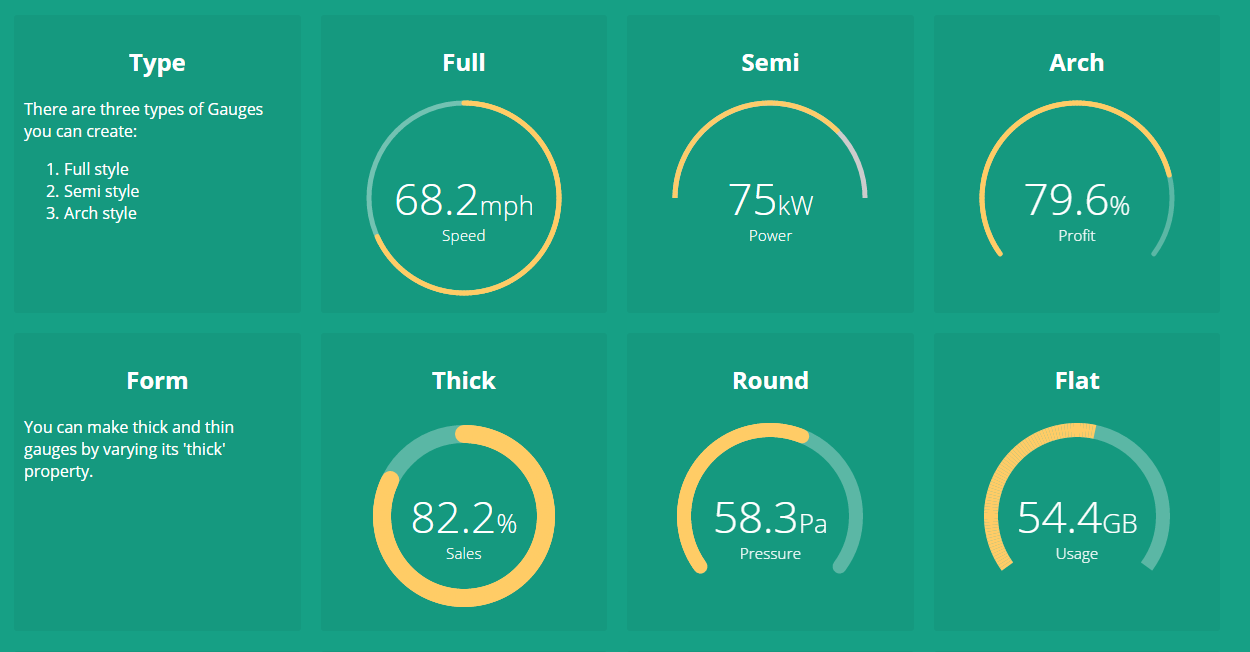
<ng-gauge size="200" type="full" thick="5" min="0" max="120" value="68.2" cap="round" label="Speed"  foreground-color="#ffcc66" background-color="rgba(255,255,255, 0.4)" append="mph"></ng-gauge>

If you face any problem, then raise an issue here.

Config Options

There are plenty of configurable options available to tune the Gauge as per your needs.

Name Description Required Default value Possible values
size Specifies the size of the canvas in which Gauge will be drawn. It is used as width and height both. No 200 Positive Integer
type Specifies the gauge's type. No "full" "full", "semi", "arch"
min Specifies the minimum numeric value for gauge's scale. No 0 Any numeric value
max Specified the maximum numeric value for gauge's scale. No 100 Any numeric value
value Specifies the current value of the Gauge in the range specified by min and max. It is a required attribute. Yes undefined Any numeric value
cap The style of line ending at the gauge's end. No "butt" "round", "butt"
thick Specified the thickness of the gauge's bar. No 6 Any Positive Integer
label Specifies the text to display below the Gauge's reading. No undefined Any String
foreground-color Specifies the foreground color of the Gauge's scale. No rgba(0, 150, 136, 1) Any color value string
background-color Specifies the background color of the Gauge's scale. No rgba(0, 0, 0, 0.1) Any color value string
append Specifies a string appended to the Gauge's reading. For example "%" most commonly used. No undefined Any string
prepend Specifies a string prepended to the Gauge's reading. For example "$" in case of financial data displayed in Gauge. No undefined Any String
duration Specifies the duration (in milliseconds) of the Gauge's animation No 1500 Positive Integer
thresholds Specifies an object of threshold values at which the gauge's color changes. Checkout an example here. No none {}
label-only Only label specified by label attribute is shown, when set to true. No false true, false
fraction-size Number of decimal places to round the number to. If this is not provided then the fraction size is computed from the current locale's number formatting pattern. No none Positive Integer

Global Defaults

angular-gauge ships with a provider to globally set config options for all gauge instances used in the application during angular config phase. You can specify ngGaugeProvider dependency during config phase. It supports a single API to set config options:

ngGaugeProvider.setOptions(customOptions);

Here, customOptions is an object {} where keys are the configOptions name (in camelCase notation), mentioned in above section. For example, let see how to set size, cap, thick, foreground-color and background-color options globally using provider as shown below:

angular
  .module('myApp', ['angularjs-gauge'])
  .config(configApp);

  configApp.$inject = ['ngGaugeProvider'];
  function configApp(ngGaugeProvider) {

    // setting the default parameters for
    // gauge instances globally.
    ngGaugeProvider.setOptions({
        size: 250,
        cap: 'round',
        thick: 15,
        foregroundColor: "#ff8645",   // note the camelCase notation for parameter name
        backgroundColor: "#e4e4e4"
    });

  }

Configure Threshold Color Ranges

You can customize the colors of the gauge based on the current value being shown. This feature is introduced in v2.1.0. Make sure to update your local copy before using this feature.

In order to show different colors when gauge crosses certain value, use property thresholds. It takes an object with the threshold value as key and an object with color property as value. For example:

....

var threshold = {
  '0': {color: 'green'},
  '40': {color: 'orange'},
  '75.5': {color: 'red'}
};

....
<ng-gauge ...  thresholds="threshold"></ng-gauge>

The keys in the threshold object signifies the minimum value at which the color will be applied. For instance, if the gauge's current value is 53.2, then orange color will be applied because after point 40 every value will be displayed as orange, until next threshold is encountered. In this example 75.5 is the next threshold.

Playground

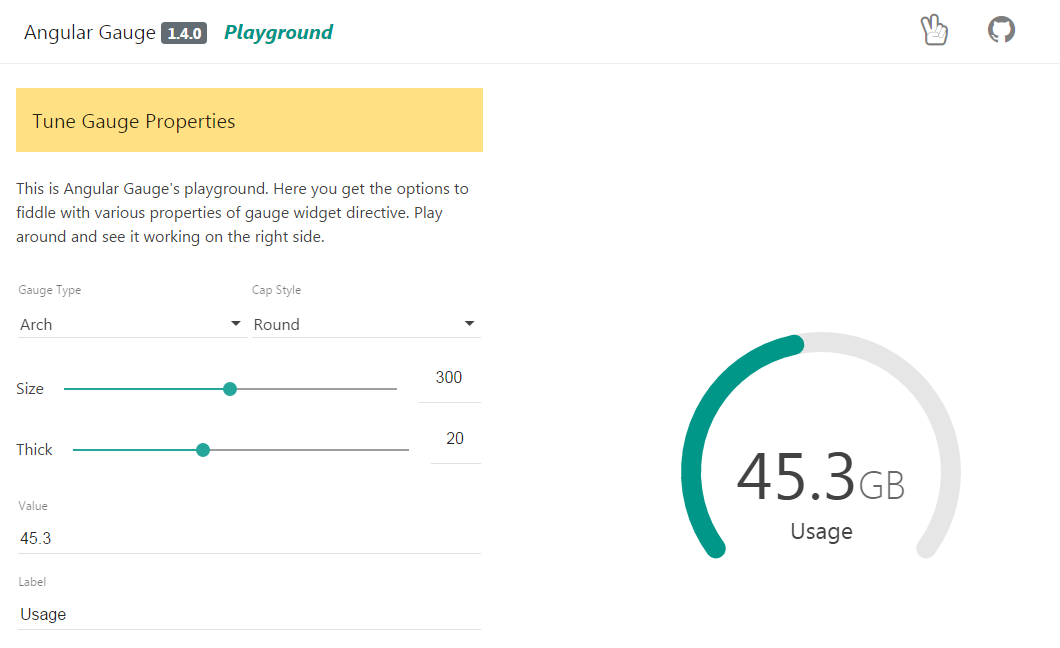
The examples section is redesigned as a playground where you can play with Gauge by tuning its different parameters. And, you can see the result live on-screen. It is good start to get familiar with Gauge.

alt text

Upgrade Guide

If you are upgrading from angular-gauge 1.x version to any version in 2.x family, then make sure to read the release notes of the chosen version on the Releases section.

Following are the breaking changes introduced in 2.x.x onwards:

  1. used and total attributes are removed.
  2. min and max attributes are introduced which works with value attribute. Checkout config options to know more about their usage.

Contribute

The project is continously evolving with every new release. Give it a star, if you like it. For contribution, setup the development environment as follows:

  1. clone and setup the project dependencies
$> git clone https://github.com/ashish-chopra/angular-gauge.git
$> npm install
  1. Use following commands based on what you'd like to do:
$> npm start             # starts the server at port 3000 and hosts the `/examples` directory.
$> npm test              # runs test suite once and exit.
$> npm run test:watch    # starts the test framework and watch for changes in code.
$> npm run build         # triggers a manual build for library, outputs at `/dist` directory.
  1. To add a new feature or fix a bug, make sure to create a new branch from master.

First thing first, explore the issue tracker to find something to contribute. There are tons of other project setup related issues and activities in which you can help. Your feedback could also be a great contribution.

If you face any problem, then raise an issue here.

License

MIT License

angular-gauge's People

Contributors

ashish-chopra avatar bennettatoms avatar camiteca avatar donghopark avatar joaquinjsb avatar rohan-buechner avatar

Stargazers

 avatar  avatar  avatar  avatar  avatar  avatar  avatar  avatar  avatar  avatar  avatar  avatar  avatar  avatar  avatar  avatar  avatar  avatar  avatar  avatar  avatar  avatar  avatar  avatar  avatar  avatar  avatar  avatar  avatar  avatar  avatar  avatar  avatar  avatar  avatar  avatar  avatar  avatar  avatar  avatar  avatar  avatar  avatar  avatar  avatar  avatar  avatar  avatar  avatar  avatar  avatar  avatar  avatar  avatar  avatar  avatar  avatar  avatar  avatar  avatar  avatar  avatar  avatar  avatar  avatar  avatar  avatar  avatar  avatar  avatar  avatar  avatar  avatar  avatar  avatar  avatar  avatar  avatar  avatar  avatar  avatar  avatar  avatar  avatar  avatar  avatar  avatar  avatar  avatar  avatar  avatar  avatar  avatar  avatar  avatar

Watchers

 avatar  avatar  avatar  avatar  avatar  avatar  avatar  avatar  avatar  avatar  avatar

angular-gauge's Issues

Github Page

Hi @ashish-chopra, it would be very helpful if you can add a GitHub page to showcase the demo of this directive. This will serve a quick comparison between other dashboard directives as well.

Add global config options for gauge

I think it is needed to set few config options at global level, which is applicable for every gauge instance in the application. Because providing every attribute on every other instance is cumbersome for client.

Solution: Need to use providers to set options during config time of angular app.

Improve README

The content mentioned in README has not been to what has been thought of. There is no code block around statements. And proof reading is needed.

Whitespace between number and text

As usually, percentatge symbol ("%") appears (and have to be) next to the number. However, for the measurement units (like "mph", "kW", "Pa", "GB"...), it is necessary a separation before these. Starting a whitespace at the append option does not work.

Animating Threshold colors required

Gauge does not support themes of colors and animation of colors from one to another based on the changing value of the gauge while animation.

Dynamically change gauge thresholds

Hi, this gauge is really useful, thanks!
I am trying to dynamically change the gauge thresholds so I can move a slider and it will set the gauge object property keys to the value of the slider, I think I have successfully updated that object but the gauge doesn't update when the thresholds updates.
Is there any function that refreshes the gauge when the thresholds update?
Thanks again
Al

Can't be use with angular-i18n

When I try to use the angular-gauge directive

<ng-gauge size="150" type="arch" thick="10" value="(60 | number:2)" cap="round" foreground-color="#e85656" background-color="#f5f5f5" append="%"></ng-gauge>

If I add angular-i18n in my index.html :

<!-- I18N -->
<script src="vendor/angular-i18n/angular-locale_fr.js"></script>

The gauge is empty. It renders everything but the foreground color.

How can I use angular-gauge directive inside another directive?

Hi, @ashish-chopra .

How can I use the <ng-gauge> inside another directive?
Our application uses widgets to create a page. Each widget is a directive, for instance:

<html>
  <body>
      <directive-one></directive-one>
      <directive-two></directive-two>
  </body>
</html>

I want to use the <ng-gauge> inside the <directive-two>, but it is not working.
the ng-gauge component does not get the correct options configuration and end up failing to render.
Maybe I miss a configuration.

Can ng-gauge be used inside another directive?
Can you help me please?

Thanks a lot.

Making the example html a bit more responsive

Using the window resize event , the graphs can be updated.

Changes to be done

  1. Setters for the width and height
  2. An event listener
window.addEventListener('resize', function() {
  this.context.canvas.width = window.height - someBorderOffset; //someBorderOffset - for the browser's border width.
  this.context.canvas.width = window.width - someBorderOffset; 
  gauge.update();
});

Changing value by touch / drag

Hi!

Is it possible to change tha value by touching it, for example to be able to use it for temperature control?

Thanks!

Redrawing issue if value change to zero

The second if statement prevent redraw if the new value (nv param) is zero.

function watchData(nv, ov) {
                    if (!gauge) return;
                    if (!nv  || angular.equals(nv, ov)) return;
                    gauge.update();
                }

This could fix it

function watchData(nv, ov) {
                    if (!gauge) return;
                     if ((!nv && nv != 0) || angular.equals(nv, ov)) return;
                    gauge.update();
                }

Infinite Digest Loop on the example web page and official webpage of angular-gauge

angular.js:13550 Error: [$rootScope:infdig] http://errors.angularjs.org/1.5.5/$rootScope/infdig?p0=10&p1=%5B%5B%7B%22msg%22%3A%22fn%3A%20function%20(c%2Ce%2Cf%2Cg)%7Bf%3Dd%26%26g%3Fg%5B0%5D%3Aa(c%2Ce%2Cf%2Cg)%3Breturn%20b(f%2Cc%2Ce)%7D%22%2C%22newVal%22%3A%7B%7D%2C%22oldVal%22%3A%7B%7D%7D%2C%7B%22msg%22%3A%22thresholds%22%2C%22newVal%22%3A%7B%7D%2C%22oldVal%22%3A%7B%7D%7D%5D%2C%5B%7B%22msg%22%3A%22fn%3A%20function%20(c%2Ce%2Cf%2Cg)%7Bf%3Dd%26%26g%3Fg%5B0%5D%3Aa(c%2Ce%2Cf%2Cg)%3Breturn%20b(f%2Cc%2Ce)%7D%22%2C%22newVal%22%3A%7B%7D%2C%22oldVal%22%3A%7B%7D%7D%2C%7B%22msg%22%3A%22thresholds%22%2C%22newVal%22%3A%7B%7D%2C%22oldVal%22%3A%7B%7D%7D%5D%2C%5B%7B%22msg%22%3A%22fn%3A%20function%20(c%2Ce%2Cf%2Cg)%7Bf%3Dd%26%26g%3Fg%5B0%5D%3Aa(c%2Ce%2Cf%2Cg)%3Breturn%20b(f%2Cc%2Ce)%7D%22%2C%22newVal%22%3A%7B%7D%2C%22oldVal%22%3A%7B%7D%7D%2C%7B%22msg%22%3A%22thresholds%22%2C%22newVal%22%3A%7B%7D%2C%22oldVal%22%3A%7B%7D%7D%5D%2C%5B%7B%22msg%22%3A%22fn%3A%20function%20(c%2Ce%2Cf%2Cg)%7Bf%3Dd%26%26g%3Fg%5B0%5D%3Aa(c%2Ce%2Cf%2Cg)%3Breturn%20b(f%2Cc%2Ce)%7D%22%2C%22newVal%22%3A%7B%7D%2C%22oldVal%22%3A%7B%7D%7D%2C%7B%22msg%22%3A%22thresholds%22%2C%22newVal%22%3A%7B%7D%2C%22oldVal%22%3A%7B%7D%7D%5D%2C%5B%7B%22msg%22%3A%22fn%3A%20function%20(c%2Ce%2Cf%2Cg)%7Bf%3Dd%26%26g%3Fg%5B0%5D%3Aa(c%2Ce%2Cf%2Cg)%3Breturn%20b(f%2Cc%2Ce)%7D%22%2C%22newVal%22%3A%7B%7D%2C%22oldVal%22%3A%7B%7D%7D%2C%7B%22msg%22%3A%22thresholds%22%2C%22newVal%22%3A%7B%7D%2C%22oldVal%22%3A%7B%7D%7D%5D%5D
at angular.js:38
at n.$digest (angular.js:17111)
at o (angular-material.min.js:7)
at angular.js:19157
at e (angular.js:5869)
at angular.js:6145

Thresholds value is treated as string produces wrong color values

The threshold value used a key is used a string in the algorithm to compare with each other, therefore always wrong color get selected due to string comparison, not number comparison.
For example if this is the case:

$scope.gaugeThreshold = {
'0': {color: '#228B22'},
'8': {color: "#AABC22"},
'21': {color: '#FFF54C'},
'31': {color: '#DF9111'},
'41': {color: '#FF0000'}
};

The color related to 8 is always shown for anything >= 8.

Problems with Ionic 1

I'm trying to use this with Ionic 1 but It doesn't show it when i put this lines into my HTML files
, I don't know what the problem is?

If value is zero then background circle doesn't show up

Hi,

I am using following code to show guage:

Majority of times the value "perc" is 0 in my case, so nothing shows up on the UI. I want to show the background circle (#ccc0bc) to show up without any filling with foreground color for value 0. Is this possible?

Please help.

Update "label" attribute to "legend"

In the new release, label attribute must be replaced with legend. As legend seems appropriate word for the same. the value label is already referred to as label in code. Update README and write appropriate tests for it too.

handle 'mouseover' event in gauges

I'm using the gauge inside a div and when I select the div to handle js hover event, the event isnot fired, my HTML code:

<div id="selected_gauge_id">
	<div>
    	<button type="button" class="some_class_here" ng-click="doStuff()"></button>
	</div>
	<ng-gauge size="70" type="full" thick="2" value="data_here" cap="round" label="label_here"  foreground-color="#0095c8" background-color="#c8c7cc" duration="1000" append="%"></ng-gauge>
</div>

my angularjs code:

$scope .doStuff = function() {
   angular.element('#selected_gauge_id')
         .hover(function() {
             console.log('In');
         }, function() {
             console.log('Out');
         });
};

any ideas?

Code refactoring required

It has been a sloppy code. A major refactoring is needed. Introduce the use of services, factory, providers etc to refactor it into the right constituents.

Multiple Gauges properties override each other

When we add multiple gauge components on a page and each one is assigned some properties then the properties of the last gauge overrides the properties of the other ones. It seems to be an issue either with scope of angular or contextRendering2D of Canvas.

"label" should accept controller's variables

Hi,

I'm facing a specific use-case:
I am using a time which i want to display in minutes, but in order to keep the animation smooth I need to use the time as seconds (e.g: with max=1m i'd like to display 60 ticks).
In order to do this I've set label-only=true and i am updating the label with something like this:

minutes = Math.ceil(seconds / 60);
label = '${minutes} m';

Currently the way to make this work is to:

  • give the gauge an id
  • let gauge = document.getElementById(id);
  • get child <b> from gauge
  • change <b>'s innerhtml

Negative ranges are broken

I recently found that using negative value for min and positive value for max, then gauge does not render at correct position for the current value. Fix needed.

Scaleable Divisor.

Im not a java programmer but i did take a crack at trying to get this to work ...

this guage in its current configuration is really only good for values 0 to 100 however it could be made much more useful for values over 100 if there was a settable property called a "divisor" basically it would take this line of code:

tail = head + (distance * value) / 100;

and replace it with this:

tail = head + (distance * value) / divisor;

i have tried to do this but i have no idea how to pass a variable from the browser to the java script, i have however been able to reverse engineer this to some extent to be updated via php. yay me...

i have attached the modified file, maybe it did it right maybe i did it wrong (more than likely) either way i cant get it to work .
angularjs-gauge1.zip

obviously this would be good if you have any value over 100, for example and in my case in the arduino community we oftern measure tempuratures or rpms that are far higher than 100, and in that case we could map it to a value of percentage but then we wouldnt be able to see the actual value in the center of the gauge. with a divisor we would be able to scale the results, as long as the starting point is 0 the divisor would be the maximum value.

i have done this manually in the code and it didnt effect the functionality it actually does it quite well however i cant figure out how to use different instances of the script either or i would have just hardcoded 4 different versions of the script.

then again this feature could be the feature that sets yours apart from the rest. i was drawn to this because of the simplicity and with a simple command i could make it work with php.

example:

<?php echo "<ng-gauge type=\"{{'arch'}}\" divisor=\"100\" size=\"{{'150'}}\" thick=\"{{'3'}}\" label=\"{{'Alt. 1'}}\" append=\"{{''}}\" prepend=\"{{''}}\" cap=\"{{'round'}}\" foreground-color=\"{{'rgba(147, 0, 14, 1)'}}\" background-color=\"{{'rgba(89, 89, 89, 1)'}}\" value=\"".$row['ATach1']."\"></ng-gauge>"; ?>

Update function does not work as it should

Clicking the update button on the gh-pages branch (calls the update function of the gauge) does not really clears the previously drawn arc if you press it frequently and results into an inconsistent gauge.

Have a look at the following picture.
image

Max Min Values

Hey,
can i set range of values?
for example: 1-5 instead of 0-100

Making the gauge responsive

Hi,

This gauge is awesome! I am using this with Bootstrap, and wanted some tips on how I could make it responsive. For example, if placed in a div with class "col-xs-12 col-md-6" it should adjust as the div class changes based on the window size.

Thanks!

Zero value is not handled

When the gauge's current value becomes zero, i can still see a single blob of colored bar showing up.

Deployment : Code deployment fails

Steps to reproduce

  1. Clone the repo
  2. Install node.js
  3. Run npm install
    Nothing happens after that (few dependencies are downloaded though )

Note : It is showing no errors on the console.

Dev Environment

node - 4.6.0
npm - 2.15.9
cmd - MINGW32

inserting json fetched values to value attribute

how to insert values that are fetched from json to value attribute of ng-guage.

for example:

{{item.l1.open}}

	<div flex layout="row" layout-sm="column" layout-xs="column" layout-md="row">
		<div flex layout="column">
			<div flex class="overdue1">Overdue</div>
			<div flex class="guage1" layout-align="center"><ng-gauge size="100" type="full" thick="8" value="(item.l1.open)" cap="round"  foreground-color="black" background-color="rgba(0,0,0, 0.4)" append="Tickets"></div>
		</div>

Text display inside gauge with firefox

I'm using ng-gauge on firefox (v53.0 (32 bits) Win7), the text inside the gauge is displayed correctly on chrome but with firefox the text is displayed outside the gauge.
my HTML code is:
<ng-gauge size="150" type="full" thick="5" value="some_data" cap="round" label="text here" foreground-color="#0095c8" background-color="#c8c7cc" duration="1000" append="%"></ng-gauge>
the displayed gauge here:
ddd

Minor Doc Bug

Incorrect NPM module path mentioned on the homepage:

<script src="node_modules/angular-gauge/dist/angularjs-gauge.min.js"></script>

It should be:

<script src="node_modules/angularjs-gauge/dist/angularjs-gauge.min.js"></script>

Overflowing content

The HTML tag that displays the text of label option (represented by <b>) overflows from its main container. It is because of inline CSS styles: an excessive line height mainwhile an absolute position.

Recommend Projects

  • React photo React

    A declarative, efficient, and flexible JavaScript library for building user interfaces.

  • Vue.js photo Vue.js

    ๐Ÿ–– Vue.js is a progressive, incrementally-adoptable JavaScript framework for building UI on the web.

  • Typescript photo Typescript

    TypeScript is a superset of JavaScript that compiles to clean JavaScript output.

  • TensorFlow photo TensorFlow

    An Open Source Machine Learning Framework for Everyone

  • Django photo Django

    The Web framework for perfectionists with deadlines.

  • D3 photo D3

    Bring data to life with SVG, Canvas and HTML. ๐Ÿ“Š๐Ÿ“ˆ๐ŸŽ‰

Recommend Topics

  • javascript

    JavaScript (JS) is a lightweight interpreted programming language with first-class functions.

  • web

    Some thing interesting about web. New door for the world.

  • server

    A server is a program made to process requests and deliver data to clients.

  • Machine learning

    Machine learning is a way of modeling and interpreting data that allows a piece of software to respond intelligently.

  • Game

    Some thing interesting about game, make everyone happy.

Recommend Org

  • Facebook photo Facebook

    We are working to build community through open source technology. NB: members must have two-factor auth.

  • Microsoft photo Microsoft

    Open source projects and samples from Microsoft.

  • Google photo Google

    Google โค๏ธ Open Source for everyone.

  • D3 photo D3

    Data-Driven Documents codes.