Code Monkey home page Code Monkey logo

livewire-charts's Introduction

GitHub release

Livewire Charts

Preview

preview preview

Demo

https://github.com/asantibanez/livewire-charts-demo

Installation

You can install the package via composer:

composer require asantibanez/livewire-charts

Next, you must export the package public scripts. To do this run

php artisan livewire-charts:install

This command will export a vendor/livewire-charts folder under the public directory of your app which is used by the @livewireChartsScripts directive. More on this topic later.

Requirements

This package requires the following packages/libraries to work:

Please follow each package/library instructions on how to set them properly in your project.

Note: At the moment, Apex Charts is only supported for drawing charts.

Usage

Livewire Charts supports out of the box the following types of charts

  • Line/Multi Line Chart (LivewireLineChart component)
  • Pie Chart (LivewirePieChart component)
  • Column/Multi Line Chart (LivewireColumnChart component)
  • Area Chart (LivewireAreaChart component)
  • Radar Chart (LivewireRadarChart component)
  • Tree Map Chart (LivewireTreeMapChart component)
  • Radial Chart (LivewireRadialChart component)

Each one comes with its own "model" class that allows you to define the chart's data and render behavior.

  • LivewireLineChart uses LineChartModel to set up data points, markers, events and other ui customizations.
  • LivewirePieChart uses PieChartModel to set up data slices, events and other ui customizations.
  • LivewireColumnChart uses ColumnChartModel to set up data columns, events and other ui customizations.
  • LivewireAreaChart uses AreaChartModel to set up data points, events and other ui customizations.
  • LivewireRadarChart uses RadarChartModel to set up data points, events and other ui customizations.
  • LivewireTreeMapChart uses TreeMapChartModel to set up data blocks, events and other ui customizations.
  • LivewireRadialChart uses RadialChartModel to set up data bars, events and other ui customizations.

For example, to render a column chart, we can create an instance of ColumnChartModel and add some data to it

$columnChartModel = 
    (new ColumnChartModel())
        ->setTitle('Expenses by Type')
        ->addColumn('Food', 100, '#f6ad55')
        ->addColumn('Shopping', 200, '#fc8181')
        ->addColumn('Travel', 300, '#90cdf4')
    ;

Note: Chart model methods are chainable 💪

With $columnChartModel at hand, we pass it to our LivewireColumnChart component in our Blade template.

<livewire:livewire-column-chart
    {{-- key="{{ $columnChartModel->reactiveKey() }}" --}}
    :column-chart-model="$columnChartModel"
/>

Note: Optionally add "key" to enable props reactivity if needed 💪

Next, include the @livewireChartsScripts directive next to your other app scripts

@livewireScripts
@livewireChartsScripts

And that's it! You have a beautiful rendered chart in seconds. 👌

column chart example

Note: You can use these charts inside other Livewire components too. Just render them in your Blade template and you are good to go. 👍

LivewireCharts facade

Chart models can also be created using the LivewireCharts facade.

LivewireCharts::lineChartModel();
LivewireCharts::multiLineChartModel();
LivewireCharts::columnChartModel();
LivewireCharts::multiColumnChartModel();
LivewireCharts::pieChartModel();
LivewireCharts::areaChartModel();
LivewireCharts::radarChartModel();
LivewireCharts::treeMapChartModel();
LivewireCharts::radialChartModel();

Enabling Interactions

To enable click events, you must use the with[XXX]ClickEvent($eventName) method present in every model class and define a custom $eventName that will be fired with the corresponding data when a column/marker/slice is clicked.

$columnChartModel = 
    (new ColumnChartModel())
        ->setTitle('Expenses by Type')
        ->withOnColumnClickEventName('onColumnClick')
    ;

Here we define an onColumnClick event that will be fired when a column is clicked in our chart.

We can listen to the onClickEvent registering a listener in any other Livewire component.

#[On('onColumnClick')]
public function handleOnColumnClick($event)
{
   // Handle event
} 

"Reactive" Charts

You can use livewire-charts components as nested components in you Livewire components. Once rendered, charts will not automatically react to changes in the $model passed in. This is just how Livewire works.

However, to enable "reactivity" when data passed in changes, you can define a special $key to your components so they are fully re-rendered each time the chart data changes.

Each model class comes with a reactiveKey() method that returns a string based on its data. If any of the properties are changed, this key will update accordingly and re-render the chart again.

In the following example, a parent component houses both column chart and pie chart and defines a $model for each one. The parent component renders the charts as follows

<livewire:livewire-column-chart
    key="{{ $columnChartModel->reactiveKey() }}"
    :column-chart-model="$columnChartModel"
/>

<livewire:livewire-pie-chart
    key="{{ $pieChartModel->reactiveKey() }}"
    :pie-chart-model="$pieChartModel"
/>

When the parent component changes their respective models, charts will automatically re-render itself.

reactive charts example

Charts API

For each chart, a specific model class needs to be used. Here, it is detailed the api available for each type of chart.

All

Method Description
setTitle(string $title) Sets chart title
setAnimated(boolean $animated) Enables/disables animation
setDataLabelsEnabled(boolean $enabled) Enables/disables data labels
withDataLabels() Enables data labels
withoutDataLabels() Disables data labels
withLegend() Shows legends
withoutLegend() Hides legends
setColors(array $colors) Set colors for chart
addColors(string $color) Append $color to $colors set
setXAxisCategories(array $categories) Enables custom categories for chart X Axis
sparklined() Enables Apex Charts sparkline feature
setSparklineEnabled(boolean $isEnabled) Enables/Disables Apex Charts sparkline feature
setJsonConfig(array $config) Adds extra customization to charts by passing Apex charts properties keys and values. Nested keys must be added using dot (.) notation

LivewireLineChart

Method Description
multiLine() Adds multiline support for line chart
singleLine() Adds single support for line chart
addPoint(string $title, double $value, array $extras = []) Adds a point to a single line chart. $extras is forwarded on click event
addSeriesPoint(string $seriesName, string $title, double $value, array $extras = []) Adds a point to series to a multi line chart. $extras is forwarded on click event
addMarker(string $title, double $value) Adds a marker point to the line chart. Markers are used to emphasize particular points in the chart (singleLine only)
withOnPointClickEvent(string $eventName) Event Name that will be fired when a point/marker of the chart is clicked

LivewireColumnChart

Method Description
setOpacity(int $opacity) Sets columns' opacity
setColumnWidth(int $columnWidth) Sets columns' width
setHorizontal() Displays columns horizontally
setVertical() Displays columns vertically
multiColumn() Sets chart to display multiple column series
singleColumn() Sets chart to display a single column series
stacked() Sets chart to display column series stacked
addColumn(string $title, double $value, string $color, array $extras = []) Adds a column to the chart with the specified color. $extras is forwarded on click event
addSeriesColumn(string $seriesName, string $title, double $value, array $extras = []) Adds a column to a multicolumn chart. $extras is forwarded on click event
withOnColumnClickEventName(string $eventName) Event Name that will be fired when a column of the chart is clicked

LivewirePieChart

Method Description
setOpacity(int $opacity) Sets slices' opacity
asPie() Displays chart as pie
asDonut() Displays chart as donut
addSlice(string $title, double $value, string $color, array $extras = []) Adds a slice to the chart with the specified color. $extras is forwarded on click event
withOnSliceClickEvent(string $eventName) Event Name that will be fired when a column of the chart is clicked

LivewireAreaChart

Method Description
addPoint(string $title, double $value, array $extras = []) Adds a point to the area chart. $extras is forwarded on click event
withOnPointClickEvent(string $eventName) Event Name that will be fired when a point of the chart is clicked
setXAxisVisible(boolean $visible) Shows/hides xAxis labels
setYAxisVisible(boolean $visible) Shows/hides yAxis labels

LivewireRadarChart

Method Description
addSeries(string $seriesName, string $title, double $value, array $extras = [])
withOnPointClickEvent(string $eventName) Event Name that will be fired when a point of the chart is clicked

LivewireTreeMapChart

Method Description
addBlock(string $title, double $value, array $extras = []) Adds a block to the default series
addSeriesBlock(string $seriesName, string $title, double $value, array $extras = []) Adds a block to the specified series
withOnBlockClickEvent(string $eventName) Event Name that will be fired when a block of the chart is clicked
setDistributed(bool $distributed) Set whether the chart uses distribution or not

LivewireRadialChart

Method Description
addBar(string $title, double $value, string $color = null, array $extras = []) Adds a bar to the default series
withOnBarClickEvent(string $eventName) Event Name that will be fired when a bar of the chart is clicked
showTotal() Show the total percetage to the graph
hideTotal() Hides the total percetage to the graph

Advanced Usage - Integrating Scripts

The directive @livewireChartsScripts adds a script tag that includes public/vendor/livewire-charts/app.js. If you want to include this script in your build system, you can export the package scripts with php artisan vendor:publish and selecting livewire-charts:scripts. This will export js/vendor/livewire-charts inside your resources folder. You can then adjust imports as you see fit in your project.

Note: You must remove @livewireChartsScripts directive so it doesn't clash with the scripts in your build system.

Advanced Usage - Custom Json Configs

The setJsonConfig() method on every chart allows adding custom Apex properties not provided first hand by the package. This means that any chart property supported by Apex chart can be passed down using this method.

$chart->setJsonConfig([
    'plotOptions.pie.startAngle' => -90,
    'plotOptions.pie.endAngle' => 90,
    'plotOptions.pie.offsetY' => 10,
    'grid.padding.bottom' => -180,
]);

Note: If you want to add nested properties, you can use dot (.) notation for this matter.

You can even pass down simple JS functions. For example, for formatting you can pass down your own closure

$chart->setJsonConfig([
    'tooltip.y.formatter' => '(val) => `$${val} million dollars baby!`'
])

Troubleshooting

Chart components must be placed inside a container with fixed height. This is because the chart will use all the given vertical space. A fixed height is needed to render properly.

<div style="height: 32rem;">
   <livewire:livewire-column-chart .../>
</div>

Note: if a fixed height is not given, the chart will grow vertically infinitely. That's not what we want, right?

Testing

composer test

Changelog

Please see CHANGELOG for more information what has changed recently.

Contributing

Please see CONTRIBUTING for details.

Security

If you discover any security related issues, please email [email protected] instead of using the issue tracker.

Credits

License

The MIT License (MIT). Please see License File for more information.

livewire-charts's People

Contributors

alexhupe avatar asantibanez avatar laravel-shift avatar mokhosh avatar nicko170 avatar redsquirrelstudio avatar stijnvanouplines avatar syntaxlexx avatar

Stargazers

 avatar  avatar  avatar  avatar  avatar  avatar  avatar  avatar  avatar  avatar  avatar  avatar  avatar  avatar  avatar  avatar  avatar  avatar  avatar  avatar  avatar  avatar  avatar  avatar  avatar  avatar  avatar  avatar  avatar  avatar  avatar  avatar  avatar  avatar  avatar  avatar  avatar  avatar  avatar  avatar  avatar  avatar  avatar  avatar  avatar  avatar  avatar  avatar  avatar  avatar  avatar  avatar  avatar  avatar  avatar  avatar  avatar  avatar  avatar  avatar  avatar  avatar  avatar  avatar  avatar  avatar  avatar  avatar  avatar  avatar  avatar  avatar  avatar  avatar  avatar  avatar  avatar  avatar  avatar  avatar  avatar  avatar  avatar  avatar  avatar  avatar  avatar  avatar  avatar  avatar  avatar  avatar  avatar  avatar  avatar  avatar  avatar  avatar  avatar  avatar

Watchers

 avatar  avatar  avatar  avatar  avatar  avatar  avatar  avatar  avatar  avatar  avatar  avatar  avatar  avatar  avatar

livewire-charts's Issues

init is not defined

Describe the bug
After the latest update to v2.3.0 I am now just getting a lot of init is not defined errors in my console. This was working fine on 2.2.0.

image

The code itself that I am using has not changed its just the version, am i supposed to do anything different here.

image

Issue on rendering charts with float values

Dear,

I use this php array of values:
"2021-04-01" => 0
"2021-04-02" => 12.62
"2021-04-03" => 12.39
"2021-04-04" => 12.36
"2021-04-05" => 6.24
"2021-04-06" => 12.43
"2021-04-07" => 12.37
"2021-04-08" => 12.6
"2021-04-09" => 0
"2021-04-10" => 12.54
"2021-04-11" => 649.84
"2021-04-12" => 0
"2021-04-14" => 31.44
"2021-04-15" => 0
"2021-04-16" => 6.25
"2021-04-13" => 0
"2021-04-17" => 0
"2021-04-18" => 12.27
"2021-04-19" => 0
"2021-04-20" => 12.32
"2021-04-21" => 12.33
"2021-04-22" => 12.52
"2021-04-23" => 12.48
"2021-04-24" => 12.58
"2021-04-25" => 25.2
"2021-04-26" => 24.77
"2021-04-27" => 18.52
"2021-04-28" => 6.25
"2021-04-29" => 24.79
"2021-04-30" => 25.22
"2021-05-01" => 24.85

And the graph result looks like this:
it's a multi-line graph and I use addSeriesPoint function to add points.

image

Do you have any ideas why the values are shown like this ?

Many thanks in advance for your help and feedback.

->setHorizontal(true); doesn't seem to change charts

Describe the bug
I have implemented a chart using $myChart = (new ColumnChartModel());

The chart works fine and all data displays correctly. I would like to implement the chart horizontally, however, setting $myChart->setHorizontal(true); doesn;t seem to change the output. I've looked through the code, and I can see the package is capturing the true that I am setting but it doesn't look like its reaching the chart.

Is this something I am doing, or the chart implmentation?

Define colors for multiLine LineChart

Is it possible to define the colors of the lines in a multi line chart? If so, how do you do it?
I tried to change the color of a graph by adding , ['color' => '#aa0000'] to every data of one series, sadly doesn't work.
I have piechart next to this chart and would like to use the same colors for consistency. (See the images for visualization)
image
image

The code of these graphs is this:

//PieChart
$accountSplitChart = (new PieChartModel())
            ->setTitle(_i('User by Type'))
            ->setOpacity(1)
            ->addSlice(_i('Employees and admins'), count(User::whereUserType(0)->get()), '#944ebd')
            ->addSlice(_i('Trainees'), count(User::whereUserType(1)->get()), '#76bd4e')
            ->addSlice(_i('Farmer'), count(User::whereUserType(2)->get()), '#bd714e');
//MultiLineChart
$traineesAndFarmerByDay = (new LineChartModel())
            ->setTitle('Trainees and Farmer in the last 7 days')
            ->multiLine()
            ->setSmoothCurve()
            ->addSeriesPoint('Trainees', Carbon::now()->subDays(7)->format('d.m.Y'), count(Trainee::whereDate('created_at', Carbon::now()->subDays(7)->format('Y-m-d'))->get()))
            ->addSeriesPoint('Trainees', Carbon::now()->subDays(6)->format('d.m.Y'), count(Trainee::whereDate('created_at', Carbon::now()->subDays(6)->format('Y-m-d'))->get()))
            ->addSeriesPoint('Trainees', Carbon::now()->subDays(5)->format('d.m.Y'), count(Trainee::whereDate('created_at', Carbon::now()->subDays(5)->format('Y-m-d'))->get()))
            ->addSeriesPoint('Trainees', Carbon::now()->subDays(4)->format('d.m.Y'), count(Trainee::whereDate('created_at', Carbon::now()->subDays(4)->format('Y-m-d'))->get()))
            ->addSeriesPoint('Trainees', Carbon::now()->subDays(3)->format('d.m.Y'), count(Trainee::whereDate('created_at', Carbon::now()->subDays(3)->format('Y-m-d'))->get()))
            ->addSeriesPoint('Trainees', Carbon::now()->subDays(2)->format('d.m.Y'), count(Trainee::whereDate('created_at', Carbon::now()->subDays(2)->format('Y-m-d'))->get()))
            ->addSeriesPoint('Trainees', Carbon::now()->subDays(1)->format('d.m.Y'), count(Trainee::whereDate('created_at', Carbon::now()->subDays(1)->format('Y-m-d'))->get()))
            ->addSeriesPoint('Trainees', Carbon::now()->format('d.m.Y'), count(Trainee::whereDate('created_at', Carbon::now()->format('Y-m-d'))->get()))
            ->addSeriesPoint('Farmer', Carbon::now()->subDays(7)->format('d.m.Y'), count(Farm::whereDate('created_at', Carbon::now()->subDays(7)->format('Y-m-d'))->get()))
            ->addSeriesPoint('Farmer', Carbon::now()->subDays(6)->format('d.m.Y'), count(Farm::whereDate('created_at', Carbon::now()->subDays(6)->format('Y-m-d'))->get()))
            ->addSeriesPoint('Farmer', Carbon::now()->subDays(5)->format('d.m.Y'), count(Farm::whereDate('created_at', Carbon::now()->subDays(5)->format('Y-m-d'))->get()))
            ->addSeriesPoint('Farmer', Carbon::now()->subDays(4)->format('d.m.Y'), count(Farm::whereDate('created_at', Carbon::now()->subDays(4)->format('Y-m-d'))->get()))
            ->addSeriesPoint('Farmer', Carbon::now()->subDays(3)->format('d.m.Y'), count(Farm::whereDate('created_at', Carbon::now()->subDays(3)->format('Y-m-d'))->get()))
            ->addSeriesPoint('Farmer', Carbon::now()->subDays(2)->format('d.m.Y'), count(Farm::whereDate('created_at', Carbon::now()->subDays(2)->format('Y-m-d'))->get()))
            ->addSeriesPoint('Farmer', Carbon::now()->subDays(1)->format('d.m.Y'), count(Farm::whereDate('created_at', Carbon::now()->subDays(1)->format('Y-m-d'))->get()))
            ->addSeriesPoint('Farmer', Carbon::now()->format('d.m.Y'), count(Farm::whereDate('created_at', Carbon::now()->format('Y-m-d'))->get()));

I want to change the turquoise line to the brown shade to the pie chart, same for the other one, where it's blue to green.
Would be helpful for anyone who doesn't want to stick with the default color.

Echarts

Proposal

Do you have a workaround for an Echarts solution?

Without Legend

"withoutLegends()" in your readme, should be "withoutLegend()"

Support For PHP8

I am using PHP 8 and composer 2.0.2. I can't install your package. I have to add --ignore-platform-reqs

Area chart is cut on left side

Describe the bug
When using an area chart with the settings listed below, the left side is cut out of the view and the first x-axis label is not readable. Andy idea how to manage a padding or something?

To Reproduce
Steps to reproduce the behavior:

LivewireCharts::areaChartModel()
                    ->setColor('#00de7f')
                    ->setAnimated(false)
                    ->withOnPointClickEvent('onPointClick')
                    ->setSmoothCurve()
                    ->setDataLabelsEnabled(true)
                    ->setStrokeWidth(6)
                    ->setYAxisVisible(false)
                    ->setXAxisVisible(true)

Expected behavior
Left side spacing

Screenshots
screen-x-axis

Random colors

If there are more columns it would a headache to define all column colors instead it would be better to have an option as auto or random color for columns.

livewireChartsColumnChart is not defined

Getting the error: livewireChartsColumnChart is not defined even after putting in @livewireChartsScript in the scripts section of the layout. The culprit is that composer installs the package into /vendor/asantibanez/livewire-scripts while @livewireChartsScripts points it to /livewire-scripts.

<div>
   <livewire:livewire-column-chart :column-chart-model="$chart" />
   ...
   @push('scripts')
           <script src="//cdnjs.cloudflare.com/ajax/libs/apexcharts/3.22.2/apexcharts.min.js" integrity="sha512-MaTc94UwSWnpm+S76wtgEHwUsQa3P8ed8iqgCmVHJMxfrDdF0/+2Ji/T7wAE4UZqIEapiG+g9kPaKZ6bMJtuPg==" crossorigin="anonymous"></script>
           <link rel="stylesheet" href="//cdnjs.cloudflare.com/ajax/libs/apexcharts/3.22.2/apexcharts.min.css" integrity="sha512-H6KANMpZQKsK9c09UqdcQv02JTiZ/hMVwxkcbDLrp125CR884wwEdnWDm+Yuo6tihuC/cizLYWAjMZi0xAfGig==" crossorigin="anonymous" />
           @livewireChartsScripts
   @endpush
</div>

Resulting HTML codes show livewire-charts js file is indeed appended to the codes:
image

Mixed Charts

Summary

A Mixed Chart is a visualization that allows the combination of two or more distinct graphs.
The features of each chart are retained on the mixed chart plot.

Proposal

I'm not sure if it's possible to include this in the current API.

perhaps the idea for a new API could be like this:

$mixedChartModel = 
    (new mixedChartModel())
        ->setTitle('Cash Flow')
        ->addColumn($seriesName, $value, $type, $extra);
$mixedChartModel = 
    (new mixedChartModel())
        ->setTitle('Cash Flow')
        ->addColumn('Income', 100, 'line', [])
        ->addColumn('Expense', 10, 'column', []);

Additional Notes

https://apexcharts.com/javascript-chart-demos/mixed-charts/line-column/

thanks for this package though, very helpful!

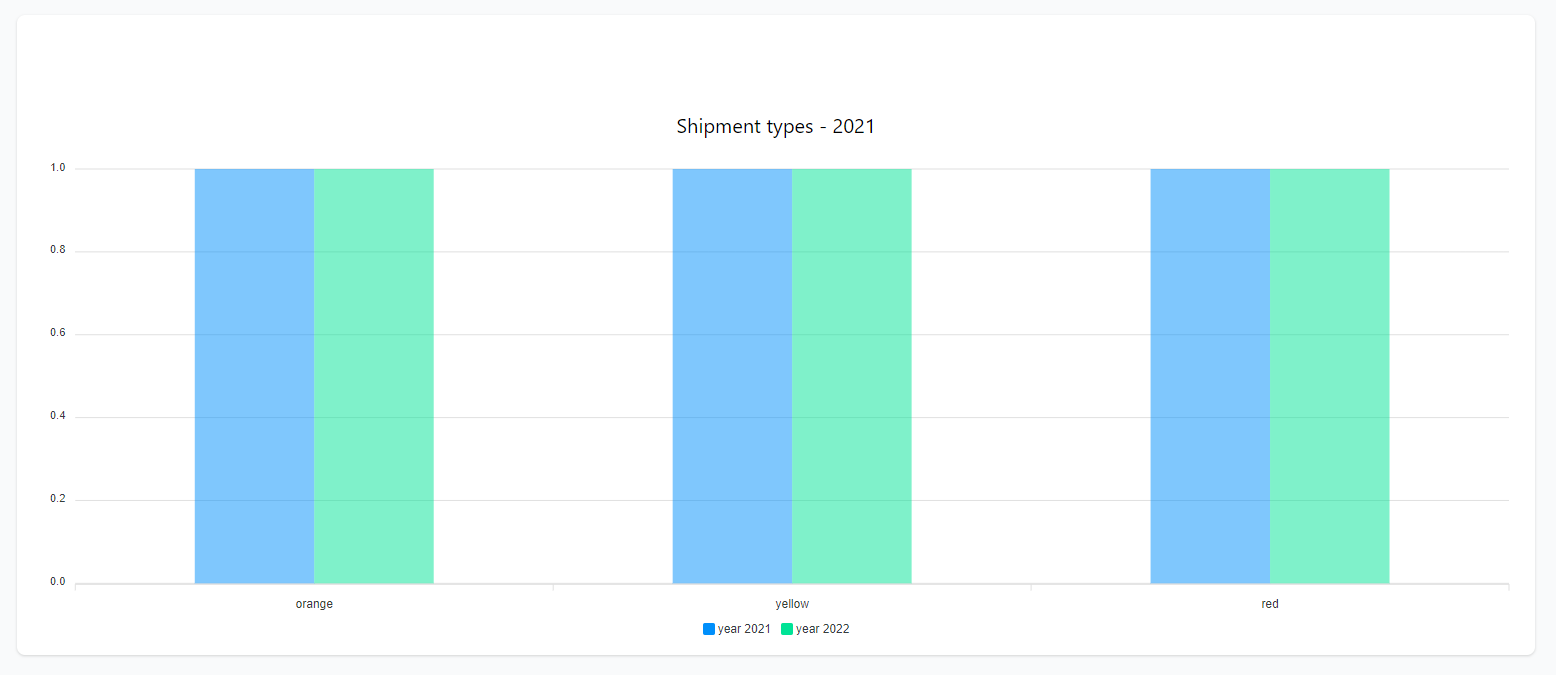
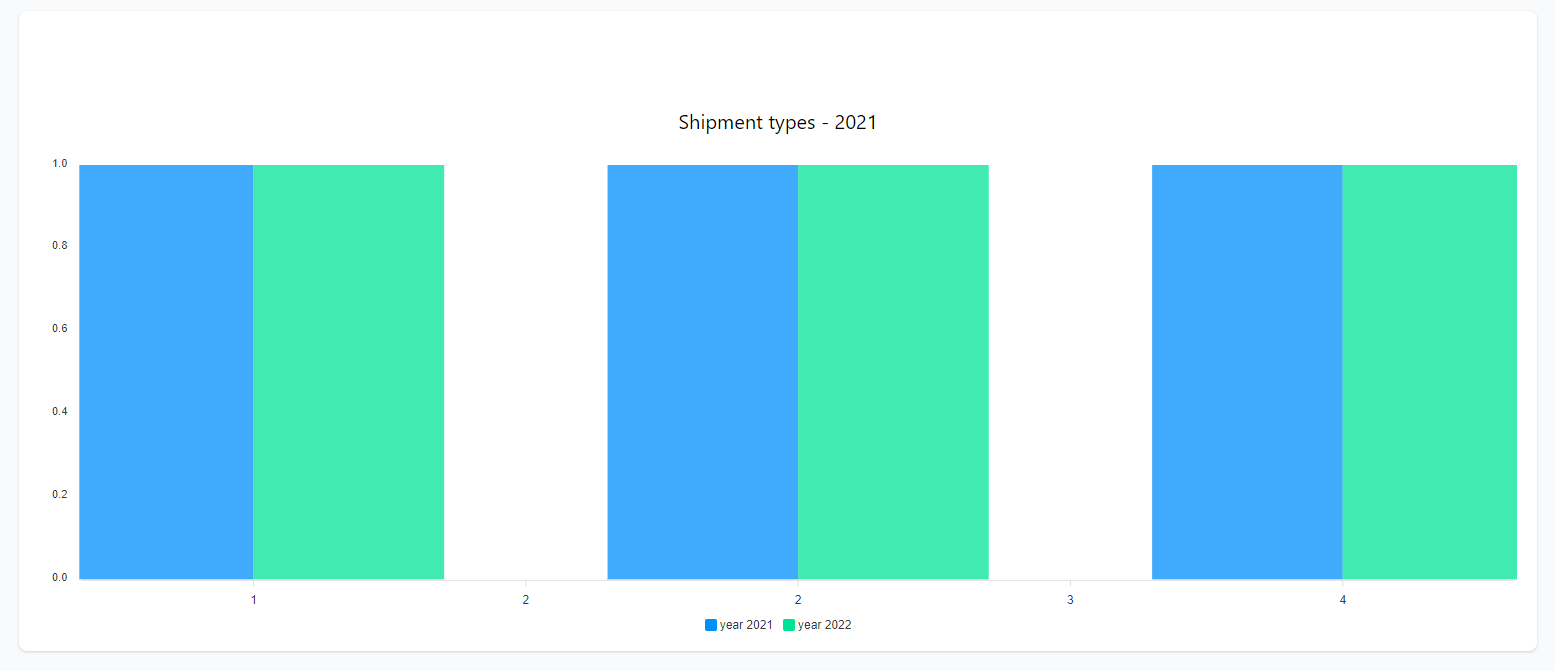
Naming multicolumn not working

Naming the multicolumn isn't working since version 2.3, on 2.2 its working fine.

For example this code shows the color names fine in version 2.2 but in version 2.3 it shows the index, so 1,2,3

        $chart =  (new ColumnChartModel())->multiColumn();

        $chart->addSeriesColumn("year 2021", "orange", 1);
        $chart->addSeriesColumn("year 2021", "yellow", 1);
        $chart->addSeriesColumn("year 2021", "red", 1);

        $chart->addSeriesColumn("year 2022", "orange", 1);
        $chart->addSeriesColumn("year 2022", "yellow", 1);
        $chart->addSeriesColumn("year 2022", "red", 1);

Version 2.2:

Version 2.3:

How can i group the dates?

Describe the bug
A clear and concise description of what the bug is.

To Reproduce
Steps to reproduce the behavior:

  1. '...'
  2. '...'
  3. '...'

Expected behavior
A clear and concise description of what you expected to happen.

Screenshots
If applicable, add screenshots to help explain your problem.

Additional context
Add any other context about the problem here.

Solution Ideas
Initial thoughts or details about how this could be fixed

Argument 1 passed to Asantibanez\LivewireCharts\Charts\LivewireColumnChart::mount() must be an instance of Asantibanez\LivewireCharts\Models\ColumnChartModel, null given,

`$expenses = Admin::whereIn('team_id', ['5','6'])->get();

    $columnChartModel = $expenses->groupBy('team_id')
    ->reduce(function ($columnChartModel, $data) {
        $type = $data->first()->team_id;
        $value = $data->sum('id');
       
        return $columnChartModel->addColumn($type, $value, $this->colors[$type]);
    },LivewireCharts::columnChartModel()
        ->setTitle('Expenses by Typssse')
        ->setAnimated($this->firstRun)
        ->withOnColumnClickEventName('onColumnClick')
        ->setLegendVisibility(false)
        ->setDataLabelsEnabled($this->showDataLabels)
        ->setOpacity(0.25)
        ->setColors(['#b01a1b', '#d41b2c'])
        ->setColumnWidth(90)
        
    );

`
image

been trying to integrate charts in my project and used the sample but i keep gettin gthis error I check the value of columnChartModel and it has value

Annotation on Apexcharts

hello there,

sorry, is there any example to add annotations to multi line charts with this package?

thanks.

Multi Column Charts

Hey,

Great package.
Have you thought about adding support for multi-column column charts ? (Too many columns!)

https://apexcharts.com/javascript-chart-demos/column-charts/basic/

I did look at the source but couldn't think of a way to do this without a massive breaking change or creating a new chart type.

Didn't want to spend time on this and submit a PR if it isn't something you would like to support going forward.

Show Value Without Hover

The charts we use are on TVs mounted on the wall so the hover feature is not very helpful to us.

Is there a way to display the value on a column chart?
Like this: https://share.getcloudapp.com/p9urPEmK

In the Charts API section of the Readme, in the all section, I see withDataLabels() | Enables data labels so I tried that in the demo app like this:

$columnChartModel = $expenses->groupBy('type')
            ->reduce(function (ColumnChartModel $columnChartModel, $data) {
                $type = $data->first()->type;
                $value = $data->sum('amount');

                return $columnChartModel->addColumn($type, $value, $this->colors[$type]);
            }, (new ColumnChartModel())
                ->setTitle('Expenses by Type')
                ->withDataLabels()
                ->setAnimated($this->firstRun)
                ->withOnColumnClickEventName('onColumnClick')
            );

but I get

Call to undefined method Asantibanez\LivewireCharts\Models\ColumnChartModel::withDataLabels()

I think I am very close ... just need a little push

onColumnClick error

Describe the bug
->withOnColumnClickEventName() isn't passing through the SecureHydrationWithChecksum of livewire.

To Reproduce
Steps to reproduce the behavior:

  1. Create a chart with ->withOnColumnClickEventName()
  2. Click on a column

Expected behavior
Emit an event for Livewire Components

Screenshots
CleanShot 2021-07-16 at 12 00 41@2x

Additional context
Add any other context about the problem here.

Solution Ideas
No, I tried different things of how to fix this. Adding wire:key :key or key to the component. I checked the fingerprint that is being passed back to the server but for some reason Livewire thinks that the data is different.

[Q] How to customise colours?

Hi @asantibanez,

Traditionally with APEXCharts we are able to pass it a JSON config with all the options, looking at what you've provided so far it doesn't seem like we are able to do that.

Could you provide some documentation on how to do this with your laravel library please?

Thanks.

Multiple lines on a LineChartModel?

Hi there, this is a very interesting and exciting project however I don't see a way to add multiple lines to a LineChartModel. Is that possible?

Is there a way to refresh the chart when user change settings

Is there a way to refresh chart after user change a value?

In this case i have three buttons that set different format for created_at field.
I tried different solutions, but it doesn't seem to refresh the chart view.

Any tip? Please.

<?php

namespace App\Http\Livewire\Dashboard\Statistics\Charts\Pie;

use App\Models\LandingPageStatistics\VisitorsStatistic;
use Asantibanez\LivewireCharts\Facades\LivewireCharts;
use Asantibanez\LivewireCharts\Models\ColumnChartModel;
use Carbon\Carbon;
use Livewire\Component;

class VisitorsStatisticsPieCharts extends Component
{
    public $page;
    public $showDataLabels = true;
    public $firstRun = true;
    public $grouped ='d/m';
    public $colors = [
    ];

    public $newGroupBy;

    protected $listeners = [
        'refreshChart' => 'render',
    ];

    public function setGroupBy($value){

        $this->newGroupBy = $value;

        dd($this->newGroupBy); // Here I see Input has submitted
        

        $this->emit('refreshChart');

    }


    public function render()
    {


        $visits = VisitorsStatistic::where('page_id', $this->page->id)->orderBy('created_at')->get();
        

        $columnChartModel =  $visits->groupBy(function($date){

        // NEED SOMTHING THAT SET NEW FORMAT
        // if(isset($this->newGroupBy)){
        //     $this->grouped = $this->newGroupBy;
        // }else{
        //     $this->grouped;
        // }
       

            return Carbon::parse($date->created_at)->format($this->grouped);

        })->reduce(
            function($columnChartModel, $data){
                $visit = Carbon::parse($data->first()->created_at)->format('D d/m/y');
                $value = $data->count();

                return $columnChartModel->addColumn($visit, $value, $this->colors);
            }, LivewireCharts::columnChartModel()
            ->setTitle(__('contents.visitors_statistics'))
            ->setAnimated($this->firstRun)
            ->setLegendVisibility(false)
            ->setDataLabelsEnabled($this->showDataLabels)
            ->setColors(['#0984e3'])
            ->setColumnWidth(20)
        );

        return view('livewire.dashboard.statistics.charts.pie.visitors-statistics-pie-charts',[
            'columnChartModel' => $columnChartModel,
        ]);
    }
}
}

Is there a way to change the hover title?

Hello,

Right now on hover, the title says series-1 for a ColumnChartModel.

$usersChart = $users->reduce(function (ColumnChartModel $usersChart, $data) use ( $dashboard ) {
    $month = $data->first()->created_at->format('n');
    $value = $data->count();
    return $usersChart->addColumn($dashboard->months[$month], $value, $dashboard->colors[$month] );
}, (new ColumnChartModel())
    ->setTitle('Users Created')
    ->setAnimated($this->firstRun)
    ->withoutLegend()
);

I was wondering how to change that title?

Thanks.

Charts seem to disappear

Hi there,
I have been enjoying using livewire-charts with no problems for a few months but recently, I think after a composer update it seems that chart data loads and then disappears before the chart us rendered. An error is thrown (possibly after after alpine loads): Alpine Error: "ReferenceError: init is not defined". I have tried rolling back to v 2.2.0 and I have tried re-publishing the assets as well as re-ordering the scripts. I'm probably doing something wrong but any suggestions would be gratefully received. I'm using Laravel 7, livewire 2.4, alpine 2.8.1 and apex-charts 3.25.0.

Thanks in advance.

Right To Left text

chartsLivewire
Hi
Is there a solution to the broken letter problem in right to left languages
Or can I hide the writing on the columns ... A picture is attached for clarification
Thank

Chart components cannot be used inside and @if in Laravel blade template

Hola Andrés,

Felicidades, maravilloso paquete. Estoy utilitzando en un proyecto actualmente. Gracias por tu tiempo!

I cannot use you livewire-components inside and if:

@if($show)
<livewire:livewire-column-chart
                key="{{ $columnChartModel->reactiveKey() }}"
                :column-chart-model="$columnChartModel"
            />
@endif

Error:

Uncaught ReferenceError: columnChart is not defined


As said in alpinejs docs:

https://github.com/alpinejs/alpine#x-data

Using '''window.''' in line:

https://github.com/asantibanez/livewire-charts/blob/master/resources/views/livewire-column-chart.blade.php#L9

solves the problem.

I will make a PR soon.

Greetings,

Sergi Tur

Annotations

Is there any possibility to configure annotations ?

Many thanks in advance.

line chart is not working

I am using this chart column chart is working but the line chart is not working
here is my code

$this->lineChartModel = (new LineChartModel())->setTitle('quotations each day')
        ->addPoint('18-10-2020', 200)->addPoint('19-10-2020', 100)->addPoint('20-10-2020', 300)
        ->addPoint('21-10-2020', 200)->addPoint('22-10-2020', 230) ->addPoint('23-10-2020', 280) 
        ->addPoint('24-10-2020', 210);
      return [
        'lineChartModel' => $this->lineChartModel
      ];

the line chart display but it is not showing the data it shows the default x and y-axis without value.

Undefined variable: columnChartModel

Hey. I am trying to create a chart by the example and running into the following issue. Undefined variable: columnChartModel . How is the variable $columnChartModel passed into the view? I dont get it? Its not defined? Shouldn't there be a variable definde like
public $columnChartModel ?
I had an old livewire component which I want to extend with a chart.
I am extending my Component RegisteredUseres 's render function by $columnChartModel

 public function render()
    {
        $columnChartModel =
            (new ColumnChartModel())
                ->setTitle('Expenses by Type')
                ->addColumn('Food', 100, '#f6ad55')
                ->addColumn('Shopping', 200, '#fc8181')
                ->addColumn('Travel', 300, '#90cdf4')
        ;

        return view('livewire.registered-users');
    }

Then I am trying to call it inside my livewire view registered-users with the following

        <livewire:livewire-column-chart
            :column-chart-model="$columnChartModel"
        />

The livewireChartsScripts are successfully loaded into the page and I am using following dependencies

        "php": "^7.3",
        "asantibanez/livewire-charts": "^2.3",
        "doctrine/dbal": "^2.12",
        "fideloper/proxy": "^4.2",
        "fruitcake/laravel-cors": "^2.0",
        "guzzlehttp/guzzle": "^7.0.1",
        "laravel/framework": "^8.0",
        "laravel/jetstream": "^1.5",
        "laravel/sanctum": "^2.6",
        "laravel/tinker": "^2.0",
        "livewire/livewire": "^2.0"

Any idea what I am doing wrong here?
Thanks

change fontFamily.

I want to be able to change the fontFamily in config. I will be easier to use

I gat this error, and don't how this is happening Uncaught ReferenceError: init is not defined, after worked fine

Hello there, im having this issue with the js apparently , few weeks ago my projects runnings well until ive noticed my chart dashboard won't start as a usual , ive displaying chart total users by month , nothing complex , and from yesterday i found this error on the js console , and i removed all my custom js even the css and. js framework foundation

My laravel version is 8 and livewire version is 2.4.2
Screen Shot 2021-04-09 at 7 01 34 PM

Console Error:
Uncaught ReferenceError: init is not defined
at eval (eval at saferEval (app.js:209), :3:36)
at saferEval (app.js:209)
at Component.evaluateReturnExpression (app.js:1788)
at new Component (app.js:1548)
at Object.initializeComponent (app.js:1946)
at app.js:1889
at app.js:1905
at NodeList.forEach ()
at Object.discoverComponents (app.js:1904)
at Object.start (app.js:1888)
eval @ VM2058:3
saferEval @ app.js:209
evaluateReturnExpression @ app.js:1788
Component @ app.js:1548
initializeComponent @ app.js:1946
(anonymous) @ app.js:1889
(anonymous) @ app.js:1905
discoverComponents @ app.js:1904
start @ app.js:1888
setTimeout (async)
initializeComponent @ app.js:1948
(anonymous) @ app.js:1889
(anonymous) @ app.js:1905
discoverComponents @ app.js:1904
start @ app.js:1888
async function (async)
start @ app.js:1885
(anonymous) @ app.js:1975
(anonymous) @ dashboard:251
dispatch @ dispatch.js:6
value @ index.js:87
(anonymous) @ dashboard:256
app.js:1949 Uncaught ReferenceError: init is not defined
at eval (eval at saferEval (app.js:209), :3:36)
at saferEval (app.js:209)
at Component.evaluateReturnExpression (app.js:1788)
at new Component (app.js:1548)
at Object.initializeComponent (app.js:1946)
at app.js:1933
at app.js:1911
at Array.forEach ()
at Object.discoverUninitializedComponents (app.js:1910)
at app.js:1932
eval @ VM2060:3
saferEval @ app.js:209
evaluateReturnExpression @ app.js:1788
Component @ app.js:1548
initializeComponent @ app.js:1946
(anonymous) @ app.js:1933
(anonymous) @ app.js:1911
discoverUninitializedComponents @ app.js:1910
(anonymous) @ app.js:1932
(anonymous) @ app.js:1926
setTimeout (async)
initializeComponent @ app.js:1948
(anonymous) @ app.js:1933
(anonymous) @ app.js:1911
discoverUninitializedComponents @ app.js:1910
(anonymous) @ app.js:1932
(anonymous) @ app.js:1926
childList (async)
create @ apexcharts:6
a.prepare @ apexcharts:6
(anonymous) @ apexcharts:6
app.js:1949 Uncaught ReferenceError: init is not defined
at eval (eval at saferEval (app.js:209), :3:36)
at saferEval (app.js:209)
at Component.evaluateReturnExpression (app.js:1788)
at new Component (app.js:1548)
at Object.initializeComponent (app.js:1946)
at app.js:1933
at app.js:1911
at Array.forEach ()
at Object.discoverUninitializedComponents (app.js:1910)
at app.js:1932

Recommend Projects

  • React photo React

    A declarative, efficient, and flexible JavaScript library for building user interfaces.

  • Vue.js photo Vue.js

    🖖 Vue.js is a progressive, incrementally-adoptable JavaScript framework for building UI on the web.

  • Typescript photo Typescript

    TypeScript is a superset of JavaScript that compiles to clean JavaScript output.

  • TensorFlow photo TensorFlow

    An Open Source Machine Learning Framework for Everyone

  • Django photo Django

    The Web framework for perfectionists with deadlines.

  • D3 photo D3

    Bring data to life with SVG, Canvas and HTML. 📊📈🎉

Recommend Topics

  • javascript

    JavaScript (JS) is a lightweight interpreted programming language with first-class functions.

  • web

    Some thing interesting about web. New door for the world.

  • server

    A server is a program made to process requests and deliver data to clients.

  • Machine learning

    Machine learning is a way of modeling and interpreting data that allows a piece of software to respond intelligently.

  • Game

    Some thing interesting about game, make everyone happy.

Recommend Org

  • Facebook photo Facebook

    We are working to build community through open source technology. NB: members must have two-factor auth.

  • Microsoft photo Microsoft

    Open source projects and samples from Microsoft.

  • Google photo Google

    Google ❤️ Open Source for everyone.

  • D3 photo D3

    Data-Driven Documents codes.