Code Monkey home page Code Monkey logo

django-nvd3's Introduction

Django Wrapper for NVD3 - It's time for beautiful charts

Description:Django-nvd3 is a wrapper for NVD3 graph library
nvd3:NVD3 http://nvd3.org/
d3:Data-Driven Documents http://d3js.org/

NVD3 is an attempt to build re-usable charts and chart components for d3.js without taking away the power that d3.js gives you.

Installation

Install, upgrade and uninstall django-nvd3 with these commands:

$ pip install django-nvd3
$ pip install --upgrade django-nvd3
$ pip uninstall django-nvd3

Then edit settings.py from your django project and add 'django_nvd3' in your 'INSTALLED_APPS' setting.

Dependencies

Django-nvd3 have one major dependencie:

Bower will be used to install D3 and NvD3, see bower website for futher info : http://bower.io/

Bower depends on Node and npm. It's installed globally using npm:

npm install -g bower

To easy the integration with Django we will advice you to use django-bower.

For instance to run our demo project, you will install the dependencies from requirements.txt and then install django-bower. Django-bower is not a mandatory dependencies as the user should be free to install JS files using different method.

To install django-bower:

$ pip install django-bower

Read the documentation about Django-bower to find out how to configure it properly for your project: https://github.com/nvbn/django-bower

Then in the demo project directory just type the following:

$ python manage.py bower_install
$ python manage.py collectstatic

This will create a directory "components" where d3 & nvd3 will be installed.

You can see example settings file in demoproject.

Example how to create a pieChart

Let’s say we have a simple view in which we want to display the amount of calories per fruit.

So to achieve this, we will edit our view.py, we will prepare the data that will be displayed:

xdata = ["Apple", "Apricot", "Avocado", "Banana", "Boysenberries", "Blueberries", "Dates", "Grapefruit", "Kiwi", "Lemon"]
ydata = [52, 48, 160, 94, 75, 71, 490, 82, 46, 17]
chartdata = {'x': xdata, 'y': ydata}
charttype = "pieChart"
chartcontainer = 'piechart_container'
data = {
    'charttype': charttype,
    'chartdata': chartdata,
    'chartcontainer': chartcontainer,
    'extra': {
        'x_is_date': False,
        'x_axis_format': '',
        'tag_script_js': True,
        'jquery_on_ready': False,
    }
}
return render_to_response('piechart.html', data)

We will render the template 'piechart.html' with a dictionary 'data' which contains 'charttype' and 'chartdata'. 'extra' will contains a list of additional settings:

* ``x_is_date`` - if enabled the x-axis will be display as date format
* ``x_axis_format`` - set the x-axis date format, ie. "%d %b %Y"
* ``tag_script_js`` - if enabled it will add the javascript tag '<script>'
* ``jquery_on_ready`` - if enabled it will load the javascript only when page is loaded
    this will use jquery library, so make sure to add jquery to the template.
* ``color_category`` - Define color category (eg. category10, category20, category20c)

Our template piechart.html could look like this:

{% load nvd3_tags %}
<head>
    {% include_chart_jscss %}
    {% load_chart charttype chartdata chartcontainer extra %}
</head>
<body>
    <h1>Fruits vs Calories</h1>
    {% include_container chartcontainer 400 600 %}
</body>

We use include the Javascript and CSS code for D3/NVD3. We start preparing and display the javascript code needed to render our pieChart:

{% load_chart charttype chartdata "piechart_container" extra %}

Finally we create a div container which will be used to display the chart.

The result will be a beautiful and interactive chart:

https://raw.github.com/areski/django-nvd3/master/docs/source/_static/screenshot/piechart_fruits_vs_calories.png

For more examples, please look at the demoproject directory in our repository, it shows an simple example for all the supported charts by django-nvd3.

Live demo of NVD3

See a live demo on jsfiddle : http://jsfiddle.net/areski/z4zuH/246/

Supported nvd3 charts

Charts list:

https://raw.github.com/areski/django-nvd3/master/docs/source/_static/screenshot/lineWithFocusChart.png

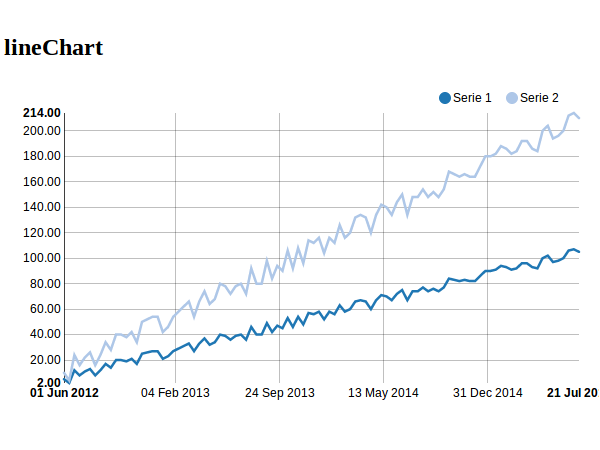
https://raw.github.com/areski/django-nvd3/master/docs/source/_static/screenshot/lineChart.png

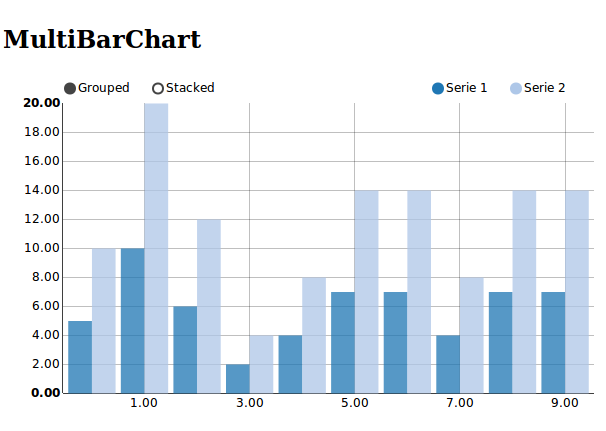
https://raw.github.com/areski/django-nvd3/master/docs/source/_static/screenshot/multiBarChart.png

https://raw.github.com/areski/django-nvd3/master/docs/source/_static/screenshot/pieChart.png

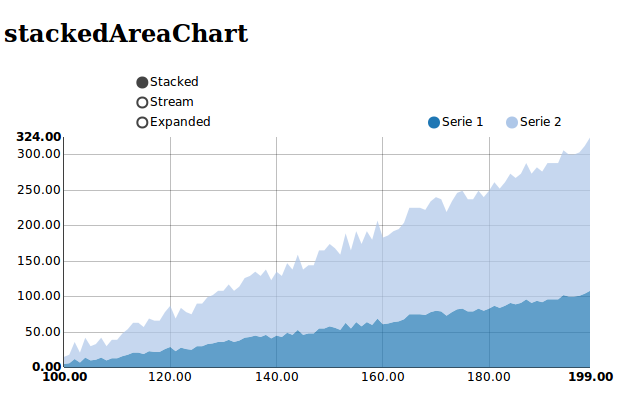
https://raw.github.com/areski/django-nvd3/master/docs/source/_static/screenshot/stackedAreaChart.png

https://raw.github.com/areski/django-nvd3/master/docs/source/_static/screenshot/multiBarHorizontalChart.png

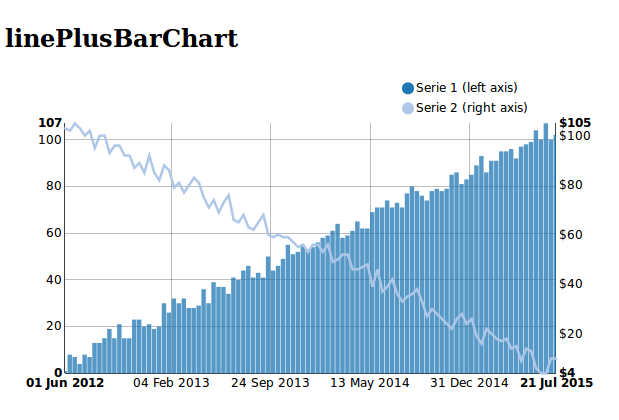
https://raw.github.com/areski/django-nvd3/master/docs/source/_static/screenshot/linePlusBarChart.png

https://raw.github.com/areski/django-nvd3/master/docs/source/_static/screenshot/cumulativeLineChart.png

https://raw.github.com/areski/django-nvd3/master/docs/source/_static/screenshot/discreteBarChart.png

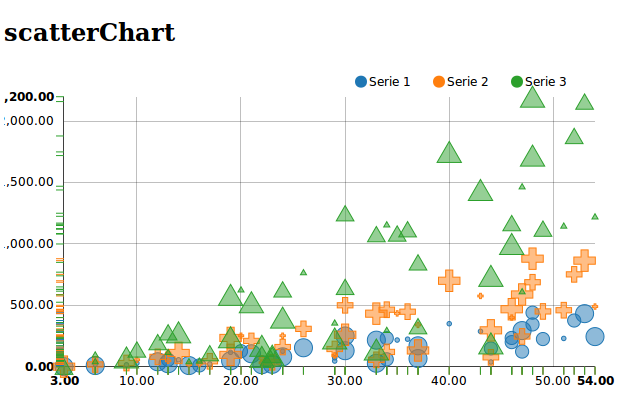
https://raw.github.com/areski/django-nvd3/master/docs/source/_static/screenshot/scatterChart.png

Projects using Django-nvd3

Documentation

Documentation is available on 'Read the Docs': http://django-nvd3.readthedocs.org

Changelog

Changelog summary : https://github.com/areski/django-nvd3/blob/master/CHANGELOG.rst

License

Django-nvd3 is licensed under MIT, see MIT-LICENSE.txt.

django-nvd3's People

Contributors

andremiras avatar areski avatar bertouttier avatar danmeakin avatar jayme-github avatar krishangupta avatar lgp171188 avatar marcogiusti avatar marcuspen avatar maxtortime avatar petrdlouhy avatar petrkudy avatar pkimber avatar shrenik avatar timb07 avatar zebulon2 avatar

Stargazers

 avatar  avatar  avatar  avatar  avatar  avatar  avatar  avatar  avatar  avatar  avatar  avatar  avatar  avatar  avatar  avatar  avatar  avatar  avatar  avatar  avatar  avatar  avatar  avatar  avatar  avatar  avatar  avatar  avatar  avatar  avatar  avatar  avatar  avatar  avatar  avatar  avatar  avatar  avatar  avatar  avatar  avatar  avatar  avatar  avatar  avatar  avatar  avatar  avatar  avatar  avatar  avatar  avatar  avatar  avatar  avatar  avatar  avatar  avatar  avatar  avatar  avatar  avatar  avatar  avatar  avatar  avatar  avatar  avatar  avatar  avatar  avatar  avatar  avatar  avatar  avatar  avatar  avatar  avatar  avatar  avatar  avatar  avatar  avatar  avatar  avatar  avatar  avatar  avatar  avatar  avatar  avatar  avatar  avatar  avatar  avatar  avatar  avatar  avatar  avatar

Watchers

 avatar  avatar  avatar  avatar  avatar  avatar  avatar  avatar  avatar  avatar  avatar  avatar  avatar  avatar  avatar  avatar  avatar  avatar  avatar  avatar  avatar  avatar  avatar  avatar  avatar  avatar

django-nvd3's Issues

Plans to move to NVD3 1.0.0b?

NVD3 major development branch, including usage of the new D3.V3, has been recently merged in master with a beta status.

Any plan to move to the new version? I'm not yet sure myself what are the compatibilities issues, but before making a fork and trying out I wanted to know if you are already working on it (this is a shared issue with python-nvd3 I guess)

Datetime handling

The current way of handling date axises is very convoluted and requires a lot of boilerplate code, e.g.

start_time = int(time.mktime(datetime.datetime(2012, 6, 1).timetuple()) * 1000)
nb_element = 100
xdata = range(nb_element)
xdata = map(lambda x: start_time + x * 1000000000, xdata)

This makes it very easy to make mistakes and is very cumbersome to the user. Django itself is using datetime.datetime which allows much nicer handling of this kind of data.

I thing django-nvd3 should allow the use of proper datetime data instead of asking the user to fiddle with epoch milliseconds...

Use data from list of model objects

I have a model Iris with data about flowers (commonly used in R). I'm trying to get the xdata attribute and the ydata attribute for pieChart but it keeps failing. My code looks like the following:
The model

class Iris(models.Model):
   species = models.CharField(max_length=100)
   sepal_length = models.DecimalField(max_digits=10,decimal_places=2,null=True,blank=True)
   sepal_width = models.DecimalField(max_digits=10,decimal_places=2,null=True,blank=True)
   petal_length = models.DecimalField(max_digits=10,decimal_places=2,null=True,blank=True)
   petal_width = models.DecimalField(max_digits=10,decimal_places=2,null=True,blank=True)

      def as_json(self):
       return dict(
                species = self.species,
                sepal_width =self.sepal_width,
                sepal_length= self.sepal_length,
                petal_width=self.petal_width,
                petal_length=self.petal_length) 

The view

  def index(request):
      irisData = [iris.as_json() for iris in Iris.objects.all()]
      irisJson = simplejson.dumps(irisData)

My problem is that, every time I try to initialize the pieChart xdata attribute, I get the error:

     Django Version:    1.6.5
     Exception Type:    TypeError
     Exception Value:   string indices must be integers, not str

The troublesome line is

         xdata=irisJson['species']

How exactly should I supply the xdata values from Iris json array using attribute name?

The irisJson json data looks like this:

[{"sepal_width": 3.50, "petal_width": 0.20, "species": "setosa", "sepal_length": 5.10, "petal_length": 1.40}, {"sepal_width": 3.00, "petal_width": 0.20, "species": "setosa", "sepal_length": 4.90, "petal_length": 1.40}, {"sepal_width": 3.20, "petal_width": 0.20, "species": "setosa", "sepal_length": 4.70, "petal_length": 1.30}, {"sepal_width": 3.10, "petal_width": 0.20, "species": "setosa", "sepal_length": 4.60, "petal_length": 1.50}, {"sepal_width": 3.60, "petal_width": 0.20, "species": "setosa", "sepal_length": 5.00, "petal_length": 1.40}, {"sepal_width": 3.90, "petal_width": 0.40, "species": "setosa", "sepal_length": 5.40, "petal_length": 1.70}]

django-nvd3 pieChart layout breaks with values below zero

I tried the django-nvd3 pieChart example and the chart layout seems to break when mixing values above and below zero.

The following code is generated:

$(function(){nv.addGraph(function() {
    var chart = nv.models.pieChart();
    chart.x(function(d) { return d.label })
        .y(function(d) { return d.value });
    chart.height(450);

    chart.showLegend(true);
    chart.showLabels(true);
    d3.select('#piechart_container svg')
        .datum(data_piechart_container[0].values)
        .transition().duration(500)
        .attr('height', 450)
        .call(chart);

    return chart;
    });
});
data_piechart_container=[{"values": [{"value": "26.03558213", "label": "some"}, {"value": "0.01824000", "label": "dummy"}, {"value": "0.00000322", "label": "values"}, {"value": "1234.43777452", "label": "here"}], "key": "Serie 1"}];

Leading to a chart looking like this:
chart

When increasing all values above 0 (or decrease below 0) the layout seems correct. It's clear to me that those small values would not really be visible in the first place but deselecting the big ones would bring them up.

Is there a way to get around this or am I doing something wrong here?

Ability to specify alternate paths to .js and .css files of nvd3

Currently it defaults to STATIC_URLnvd3/src/nv.d3.css, STATIC_URLd3/d3.min.js, STATIC_URLnvd3/nv.d3.min.js. I have downloaded the .js and .css files manually without using something like bower. I would like to have my CSS files in STATIC_URLcss/ and JS files in STATIC_URLjs/. So it would be great to provide choices for the path to look for these files.

not all the x axis labels gets displayed

Hi,
in multibarchart, I'm being puzzled since a while about not all the x axis labels contained in the "data_discretebarchart_container" js script variable being displayed.

only by excessively enlarging the graph window in the html file I get all the labels to be shown, otherwise only every other column's label is displayed (please see attachment).
I've googled a lot about 'd3' and 'nvd3' without overcoming the issue: is there any suggestion you can provide?
thanks a lot
Salvatore

sshotxaxis

log scale

Hi, is there an already put-in-place way to switch to log scale on the axes?
if not, do you have any particular suggestion to give for implementing it?
thanks a lot

StackedAreaPercentageChart filtering

Is there a way to put Check Boxes for filtering on the front end, or back to the DB to recalculate a total percentage; based on subclass(es) additional fields? This snapshot shows a Stacked Area Percentage Chart (in Tableau) which calculates percent of total for each Series, but recalculates when any of the 2 subclass attributes are unchecked?

capture

scatterChart shape

I tried setting the shapes as in your example:

kwargs1 = {'shape': 'circle', 'size': 1}
kwargs2 = {'shape': 'cross', 'size': 2}
kwargs3 = {'shape': 'triangle-up', 'size': 3}

extra_serie1 = {"tooltip": {"y_start": "", "y_end": " asdf"}}

chartdata = {
    'x': xdata,
    'name1': 'Frequency', 'y1': ydata1, 'kwargs1': kwargs1, 'extra1': extra_serie1,
    'name2': 'Importance', 'y2': ydata2, 'kwargs2': kwargs2, 'extra2': extra_serie1,
}

I really tried to get the shapes working in the scatterChart but I have no more idea. I always get the 'circle'. I used the exact versions of nvd3 and d3 as you stated in your bower configuration.

Even your unmodified demoproject does not yield the desired result as shown in the images of the ready.

Do you have an idea on that?

Future of django-nvd3

Any declarations?
Original nvd3 was abandoned.
One from community member working on fork here:
https://github.com/liquidpele/nvd3

Your project is a great but few bugs still exist, probably in nvd3 himself, but for now django-nvd3 is unusable for serious work becouse of few minor bug (like wrong displayed labels)

How to set text labels in multibarhorizontalchart

If i set 'x': xdata, where xdata is list of strings it throws an error "list index out of range"
chartdata = {
'x': xdata,
'name1': 'series 1', 'y1': ydata1, 'extra1': extra_serie,
'name2': 'series 2', 'y2': ydata2, 'extra2': extra_serie,
}

But if i set 'x': xdata to range(50) chart works, but instead text labels it shows numbers.
So how to set text labels in multibarhorizontalchart ?

How to Use X-Axis Dates

I am attempting to use django-nvd3 to create a simple line chart with dates on the X axis and integers on the Y axis. At first I was using actual datetime objects for the X axis data, but that resulted in "not JSON serializable" errors, so now I'm using string representations of dates. The chart code in my view looks liket this:

    xdata = ['2015-01-01',
             '2015-02-01',
             '2015-03-01',
             ]
    ydata = [10, 20, 40]
    ydata2 = [8, 4, 14]

    chartdata = {
            'x': xdata,
            'name1': 'series 1', 'y1': ydata,
            'name2': 'series 2', 'y2': ydata2,
            }

    context['chart'] = {
        'type': "lineChart",
        'container': 'chart_container',
        'data': chartdata,
        'extra': {
            'x_is_date': True,
            'tag_script_js': True,
            'jquery_on_ready': False,
        }
    }

This results in a chart with the proper Y axis. However, I see no lines and the X axis is labelled "31 Dec 1969, 31 Dec 1969, 31 Dec 1969".

How am I supposed to specify that the contents of xdata are string representations of dates?

data_piechart_container is empty on upgrading to 0.7.6 from 0.7.4

I am using django-nvd3 in my Django application (https://github.com/lgp171188/xpens). I had not pinned down the version of django-nvd3 and hence the django-nvd3 package got updated to 0.7.6 and the charts that were previously working with 0.7.4 were no longer working.

I checked the JavaScript console for error messages and I found that data_piechart_container array in the JavaScript code was empty and hence the code which tried to access data_piechart_container[0] was causing an error and the chart didn't load. Pinning the version of django-nvd3 to 0.7.4 and reinstalling django-nvd3 and the corresponding dependency version of python-nvd3 fixed the problem. Not sure if it is in python-nvd3 or django-nvd3. So I am reporting this issue as a regression.

In case you want to see the usage of django-nvd3 in my project and check if it is okay, I can help with that. If there is something that has changed between 0.7.4 and 0.7.6 that I have missed doing while using django-nvd3, please let me know so that I can test and find out if that works for me.

data container and performance

Hi, I am testing lineChart and was wondering how to pass a lot of data time courses without impairing too much the performance. I have seen that the data is passed as a list in the header of the rendered HTML page. I would like to have a dozen xy curves displayed, and this leads to some strain on the client side. Any advice on compressing/increasing performance (except reducing the resolution)? Thanks in advance.

slugify can't decode django.utils.safestring.SafeText

areski/python-nvd3@dd7077d adds a slugify call around the container name. From django (1.7), this value is provided as django.utils.safestring.SafeText instance which is not detected as unicode by slugify causing the following traceback:

  File "django-nvd3/django_nvd3/templatetags/nvd3_tags.py", line 48, in load_chart
    chart = eval(chart_type)(**kw_extra)
  File python-nvd3/nvd3/pieChart.py", line 79, in __init__
    NVD3Chart.__init__(self, **kwargs)
  File "python-nvd3/nvd3/NVD3Chart.py", line 136, in __init__
    self.name = slugify(kwargs.get('name', self.model))
  File "local/lib/python2.7/site-packages/slugify/__init__.py", line 60, in slugify
    text = unicode(text, 'utf-8', 'ignore')
TypeError: decoding Unicode is not supported

Don't know if this is okay for python3:

diff --git a/django_nvd3/templatetags/nvd3_tags.py b/django_nvd3/templatetags/nvd3_tags.py
index e76af39..cd096ca 100644
--- a/django_nvd3/templatetags/nvd3_tags.py
+++ b/django_nvd3/templatetags/nvd3_tags.py
@@ -42,7 +42,7 @@ def load_chart(chart_type, series, container, kw_extra, *args, **kwargs):
     if not 'tag_script_js' in kw_extra:
         kw_extra['tag_script_js'] = True
     # set the container name
-    kw_extra['name'] = container
+    kw_extra['name'] = unicode(container)

     # Build chart
     chart = eval(chart_type)(**kw_extra)
@@ -97,7 +97,7 @@ def include_container(include_container, height=400, width=600):
         * ``width`` - Chart width
     """
     chart = NVD3Chart()
-    chart.name = include_container
+    chart.name = unicode(include_container)
     chart.set_graph_height(height)
     chart.set_graph_width(width)
     chart.buildcontainer()

Issues with lineChart

Hi,

I am trying to create a lineChart. When I execute my view function I get something like this:
{'charttype': 'lineChart', 'charttdata': {'name1': 'Fabian', 'y1': [0, 0, 0, 0, 0, 0, 0, 0, 0, 0, 0, 0], 'x': ['Jan', 'Feb', 'Mär', 'Apr', 'Mai', 'Jun', 'Jul', 'Aug', 'Sep', 'Okt', 'Nov', 'Dez']}}
Is there something wrong with it? Because everytime I try to render it I get this weird error: http://dpaste.com/hold/1276225/
Also your demo for linechart doesn't work because it has got an index out of range.
I'm also not quite sure what's up with these extra series. Maybe drop a sentence or two in your documentation?

I know this is a lot of problems for one issue, but I wasn't comfortable making seperate ones since this could be a really dumb mistake on my side.

Responsive design

Hi, the wraper have a problem with responsive design, nvd3 work fine apparently...

Ability to omit width and height

I think that it should be possible to omit at least width from the template tag, without it defaulting to a value. As far as I know, if height and width are set on the svg element, the nv resize utility function doesn't do anything.

How do I set Y axis min & max

This is not so much an issue but a question - hopefully I can mark it as such.

Is there mailing list associated with this project?

I want to set fixed min & max value for Y axis ( say 0 to 100) right now value for this is based on "ydata". Is there an obvious way to do this?

(Sorry this is duplicate of issue #27 )
-Subodh

'map' object is not subscriptable

Please - help to understand :

Request Method: GET
Request URL: http://189.189.2.499:8080/ITN/chart_test1/
Django Version: 1.5.1
Exception Type: TypeError
Exception Value:

'map' object is not subscriptable

Exception Location: C:\Python33\lib\site-packages\nvd3\NVD3Chart.py in , line 189
Python Executable: C:\Program Files (x86)\Apache Software Foundation\Apache2.2\bin\httpd.exe
Python Version: 3.3.2

def demo_linechart(request):
"""
lineChart page
"""
start_time = int(time.mktime(datetime.datetime(2012, 6, 1).timetuple()) * 1000)
nb_element = 150
xdata = range(nb_element)
xdata = map(lambda x: start_time + x * 1000000000, xdata)
ydata = [i + random.randint(1, 10) for i in range(nb_element)]
ydata2 = map(lambda x: x * 2, ydata)

tooltip_date = "%d %b %Y %H:%M:%S %p"
extra_serie1 = {
    "tooltip": {"y_start": "", "y_end": " cal"},
    "date_format": tooltip_date,
    'color': '#a4c639'
}
extra_serie2 = {
    "tooltip": {"y_start": "", "y_end": " cal"},
    "date_format": tooltip_date,
    'color': '#FF8aF8'
}
chartdata = {'x': xdata,
             'name1': 'series 1', 'y1': ydata, 'extra1': extra_serie1,
             'name2': 'series 2', 'y2': ydata2, 'extra2': extra_serie2}

charttype = "lineChart"
chartcontainer = 'linechart_container'  # container name
data = {
    'charttype': charttype,
    'chartdata': chartdata,
    'chartcontainer': chartcontainer,
    'extra': {
        'x_is_date': True,
        'x_axis_format': '%d %b %Y %H',
        'tag_script_js': True,
        'jquery_on_ready': False,
    }
}
return render_to_response('linechart.html', data)

{% load nvd3_tags %}

{# Jquery CDN : Needed when using jquery_on_ready=True #} <script src="http://code.jquery.com/jquery-1.10.1.min.js"></script> {% include_chart_jscss %} {% load_chart charttype chartdata chartcontainer extra %} {% include_container chartcontainer %}

https://github.com/areski/django-nvd3/tree/master/demoproject/demoproject

I made everything - as is specified in the demontsratsionny project, but I receive the following error:

'map' object is not subscriptable

in what there can be a reason?

'nvd3_tags' is not a valid tag library

The lib show me this:

'nvd3_tags' is not a valid tag library: Template library nvd3_tags not found, tried django.templatetags.nvd3_tags,django.contrib.staticfiles.templatetags.nvd3_tags,django.contrib.admin.templatetags.nvd3_tags

Pie height error

Hi, the example pie render this for me:

< svg style="width:600px;height:400px;" height="450" >

Tooltips do not work

I am trying to define the tooltips for a chart like this:

    ...
    extra = {"tooltip": {"y_start": "foo", "y_end": "bar"}}
    chartdata = {
            'x': xdata,
            'name': 'series 1', 'y': ydata, 'extra': extra,
            }
    context['chart'] = {
        'type': "lineChart",
        'container': 'chart_container',
        'data': chartdata,
        'extra': {
            'x_is_date': True,
            'x_axis_format': "%Y-%m-%d",
            'tag_script_js': True,
            'jquery_on_ready': False,
        }
    }

Based on the documentation, I expect the above to result in a tooltip like "foo $y-value bar" (ie, if the y-value was 10, "foo 10 bar"). This does not work. Instead the tooltip stays at the default value of "$y-value at $x-value".

How can I define a format for the tooltip?

LineChart area

Dear all,

Thank you first for this repository ! I am struggling to plot multiple line chart filled. It would be like stackedareachart but without summing y values. I want a chart to overlap another.

Thank you in advance !

'str' object does not support item assignment

Hi there,
I'm trying to use this example http://django-nvd3.readthedocs.org/en/latest/classes-doc/discrete-bar-chart.html and it's raising the TypeError mentioned above. The line triggering the exception in the template is this :
{% load_chart charttype chartdata chartcontainer extra %}
Which maps to this code:
kw_extra['x_is_date'] = False

Logging kw_extra to a file reveals that it's a space and a new line.

Here's the relevant view code, it's very similar to your example referenced above:

  def get_context_data(self, **kwargs):
    context = super(ResultsView, self).get_context_data(**kwargs)
    # obtain the voting statistics for each answer
    question_id = self.kwargs.get("pk")
    page_question = Question.objects.get(pk=question_id)
    choices = page_question.choice_set.all()
    x_data = [choice.choice_text for choice in choices]
    y_data = [choice.votes for choice in choices]
    extra_serie1 = {"tooltip": {"y_start": "", "y_end": " cal"}}
    chartdata = {
        'x': x_data, 'name1': '', 'y1': y_data, 'extra1': extra_serie1,
    }
    charttype = "discreteBarChart"
    data = {
        'charttype': charttype,
        'chartdata': chartdata,
    }
    context.update(data)
    return context```

Supporting latest nvd3 and d3 versions

Hi,
I see some issues with the tooltip of a linewithfocuscharts charts that are generated when I use several parameters on the y-axis.

Maybe these are automatically solved when you support latest version of nvd3 and d3 ?

Is there a plan to migrate to those ?

Templates randomly fails

Hello!

I'm having some troubles using django-nvd3. Most of the time it works perfect as expected, but sometimes the "load_container" isn't being recognized as a valid tag and I get a TemplaeSyntaxError, sadly I haven't been able yet to reproduce the exact conditions :(

I've a main template in which I included a header.html which has the {% load nvd3_tags %} and {% load_chart ....%} call, and after that in another template I've the {% include_container ...%} call, and this last call is what isn't being recognized. If I just refresh the page it renders perfectly.

This is my environment (I just updated your library):
Django==1.4.8
django-nvd3==0.3.1
python-nvd3==0.9.0

And I've problems in booth mi development environment (macosx with python 2.6) and in my production system (freebsd with python 2.7).

The only thing that I've noticed is that sometimes getting and processing the data from the database needs a few seconds, but I do that before calling render() in my view... :/

I'm going to try to put some debug in your module but I wonder if you have seen this behaviour before.

Thanks in advance!

y-series not sorted alphabetically

Hi areski. Great work!
There is an small issue that can be solved with a line of code: The y series, named y1, y2, y3, ... are located in a dictionary and when data is read sometimes it is not sorted alphabetically.

I suggest to add a sorting after the reading of the y series:

After line 36:
y_axis_list = [d for d in series.keys() if 'y' in d]

Add
y_axis_list.sort()

Strings in xAxis

How can I display strings in xAxis instead of floats?

Needed to use the type of graph as multiBarChart, for example.

Unable to pip install django-nvd3

Came across this today, seemed to be working fine last week...

(tempe2e432)Marcuss-MacBook-Pro:~ marcus$ pip install django-nvd3
Collecting django-nvd3
  Using cached django-nvd3-0.9.0.tar.gz
    Complete output from command python setup.py egg_info:
    Traceback (most recent call last):
      File "<string>", line 20, in <module>
      File "/private/var/folders/p4/t2_x7m896jg8w5x0lvy30nvh0000gn/T/pip-build-Bbunc2/django-nvd3/setup.py", line 10, in <module>
        with open('CHANGELOG.rst') as history_file:
    IOError: [Errno 2] No such file or directory: 'CHANGELOG.rst'

    ----------------------------------------
Command "python setup.py egg_info" failed with error code 1 in /private/var/folders/p4/t2_x7m896jg8w5x0lvy30nvh0000gn/T/pip-build-Bbunc2/django-nvd3

Seems like the CHANGELOG.rst is missing from the pypi tar.

line chart: explicility specify color

Hi. Great work on creating this project. I was able to quickly get all my graphs generate. However I am not able to determine two things

  1. How can I explicitly colors for different lines in a line chart.
  2. Is there support for multichart. I want to draw three line on a same graph. But one of the line has a very different scale as compared to the other two and therefore I want to draw two y-axis and force this line to be on secondary y-axis. This is something possible using multiChart. But I wasn't able to find an example of that.

Thanks. Looking forward for a solution.
Ritesh

Is Django v 1.3.x supported?

Hello,

I'm having troubles to using django-nvd3.
During tests an exception is raised:

Exception Value: simple_tag() got an unexpected keyword argument 'name'

I suspect that the problem is that django 1.3.x is not supported. I was looking for that information on documentation but I didn't find useful info.

This is my environment:
Django==1.3.7
django-nvd3==0.5.0
python-nvd3==0.11.0

Thank you in advance.

Problem with multiBarChart using date format

I have a problem with multiBarChart.
It does not display correctly with the date format.
However changing the type of chart is displayed correctly.

{% load_chart charttype chartdata "logentry__chart_container" x_is_date="True" %}
{% include_container "chart_container" 400 900 %}

The output: http://jsfiddle.net/DgFKu/4/

You have no idea what can be?

User login status can not persist

Dear,
As the issue title says, when a user is logged in a system, when the user goes to a page which using "django-nvd3" to create a chart(line chart for example) , user log out automatically and those authenticated all lost. didn't know i am the only one who came across this problem, hope anyone can give a solution. thx:)
sorry, if i have not expressed the situation clearly.

Best Regards.

python manage.py bower_install

I am trying to run this command in my project but it is not running i am running it on windows
can anybody tell me whole step to be done

Is multi chart supported

Hi,
I'm trying to build a chart with stacked bar and multiple lines, saw something similar in nvd3 model lib, but still seems no stack bar plus line in multichart model, just wonder if this can be done in django-nvd3?
Do I need to write my own html template and chart code to support this?
Sorry this might be very simple question, I'm very new to nvd3 and js, pls help

Line Chart tool tip not working in case of intersection two series

Hi,

I am using Django 1.5.4, python 2.7 and django-nvd3 0.6.0, to show statistics for users.

Here is example of data I am passing to chart:

data = {
'charttype': 'lineChart',
'chartdata': {
'x':[1388514600000L, 1388601000000L, 1388687400000L, 1388773800000L],
'y1':[0,0,0,4],
'y2':[1,3,2,4],
},
'chartcontainer': 'chartcontainer',
'extra': {
'x_is_date': True,
'x_axis_format': '%d %b %Y %H',
'tag_script_js': False,
'jquery_on_ready': False,
}
}

Since y1 series and y2 series intersects at 4, it raises error Type Error: e is undefined.
It is rendering the chart as required but it is not showing tool tip at all.

But if you change the value of y2 to [1,3,2,5], it will work as required.

Any pointer or suggestion would be great.

Thanks,
Pradnya

Log scale and adding extra settings

Hi, I would like to be able to graph my X axis with a log scale on a lineChart. nvd3 offers this feature, using: chart.xScale(d3.scale.log());
Is it possble to add this to django-nvd3?

In a more general way, is there a way to pass supplementary settings so that they blend with the automatic building of the <script> in the HTML page? For instance, having in the extra dictionary something of the form:

'supplementary':'chart.forceY([1,1000000]);'

which would add "chart.forceY([1,1000000]);" inside the <script> section?

Thanks.

y-axis labels

Thanks for the great wrapper!
Is there a way to add y-axis labels to lineCharts?
Could not find any documentation.

Problems with multibarhorizontalchart

There were some problems in the last commit to the chart multibarhorizontalchart ... He lost the color ...
Image of Yaktocat

The chart tooltip linechart, no longer displays the keys y_start and y_end.
Image of Yaktocat

Is something wrong with my local environment?

User set y-axis range

I am using lineWithFocusChart to show two series. However, it seems that when both series are enabled, I end up with the chart using the max and min values (of both series) to determine the y-axis range. If the two series are flat, this results in a chart with the series drawn at the extreme ends of the chart. tricky to look at.

is it possible to extend python-nvd3 to allow a y-axis range to be user specified? i think in nvd3 its called yDomain

unslugified chartname in include_container

Hi All,
I have an issues with version 0.13.7.

First is in NVD3Chart.py line 173-175: (from python-nvd3)

def _slugify_name(self, name):
    """Slufigy name with underscore"""
    self.name = slugify(name, separator='_')

I have a Container name that looks like 'ContainerName' in my template, also do include_container with that name.
Since slugify removes the capital letters d3.select will not be able to find the correct container.
In content.html in line 101:
d3.select('#{{ chart.name }} svg')
Will then look for 'containername svg' instead of 'ContainerName svg' .
The reason seems to be that in nvd3_tags in line 94 the chart name is an unslugified representation:
chart.name = str(include_container)
using:
chart.name = slugify(include_container, separator='_')
seems to work.

Recommend Projects

  • React photo React

    A declarative, efficient, and flexible JavaScript library for building user interfaces.

  • Vue.js photo Vue.js

    🖖 Vue.js is a progressive, incrementally-adoptable JavaScript framework for building UI on the web.

  • Typescript photo Typescript

    TypeScript is a superset of JavaScript that compiles to clean JavaScript output.

  • TensorFlow photo TensorFlow

    An Open Source Machine Learning Framework for Everyone

  • Django photo Django

    The Web framework for perfectionists with deadlines.

  • D3 photo D3

    Bring data to life with SVG, Canvas and HTML. 📊📈🎉

Recommend Topics

  • javascript

    JavaScript (JS) is a lightweight interpreted programming language with first-class functions.

  • web

    Some thing interesting about web. New door for the world.

  • server

    A server is a program made to process requests and deliver data to clients.

  • Machine learning

    Machine learning is a way of modeling and interpreting data that allows a piece of software to respond intelligently.

  • Game

    Some thing interesting about game, make everyone happy.

Recommend Org

  • Facebook photo Facebook

    We are working to build community through open source technology. NB: members must have two-factor auth.

  • Microsoft photo Microsoft

    Open source projects and samples from Microsoft.

  • Google photo Google

    Google ❤️ Open Source for everyone.

  • D3 photo D3

    Data-Driven Documents codes.