Code Monkey home page Code Monkey logo

ava's Introduction

Switch between English and Chinese English | 简体中文

AVA logo

A framework for automated visual analytics. https://ava.antv.antgroup.com


What is AVA

AVA (AVA examples Visual Analytics) is a technology framework designed for more convenient visual analytics. The first A has multiple meanings: AI driven, Automated, Augmented, and VA stands for Visual Analytics. It can assist users in data processing, extracting insights from data, recommending and generating charts, and optimizing existing charts.

AVA examples

Composition

AVA contains 2 packages, @antv/ava and @antv/ava-react :

  • @antv/ava : AVA core package, containing four main modules:

    • data (Data Processing): Data Processing Module. Used for statistical analysis and processing of datasets.
    • insight (Auto Insight): Automatic Insights Module. Automatically discover data insights from multi-dimensional data.
    • ckb (Chart Knowledge Base): Chart Knowledge Base Module. Based on empirically derived knowledge and observations about the various fundamentals of visualization and charts, it is the cornerstone of intelligent chart recommendations.
    • advisor (Chart Recommendation): Chart Recommendation Module. Recommend chart types and specific chart detail settings based on data and analysis needs, as well as chart optimization for existing charts.
  • @antv/ava-react : A plug-and-play React component library based on the integration of AVA capabilities, it contains three core components:

    • <NarrativeTextVis />: Demonstrate data insight interpretation text. In a full-flow presentation of data analysis, using text to describe data phenomena is as critical as giving insightful conclusions.
    • <InsightCard />: Present data insights in a combination of graphics and text. It is possible to either receive data directly and perform insights automatically, or to visualize and interpret only the insight result data for presentation.
    • <AutoChart />>: Automatically recommends and renders the appropriate chart based on the data. It provides users with the ability to implement intelligent visualizations in one line of code, and the component is currently undergoing further upgrades.

Features

  • Intelligent drive: Integrates automation and intelligence to simplify the visual analysis process.
  • Rich functions: Its functions cover the whole process of data analysis, linking people and data, and connecting the "last mile" of the data analysis chain.
  • Flexible syntax: Rich built-in configuration items and support for customization.

Documentation

Getting Started

NPM package manager can be used to install @antv/ava and @antv/ava-react.

$ npm install @antv/ava
$ npm install @antv/ava-react

The following two examples show the use of @antv/ava and @antv/ava-react respectively (demo code based on React):

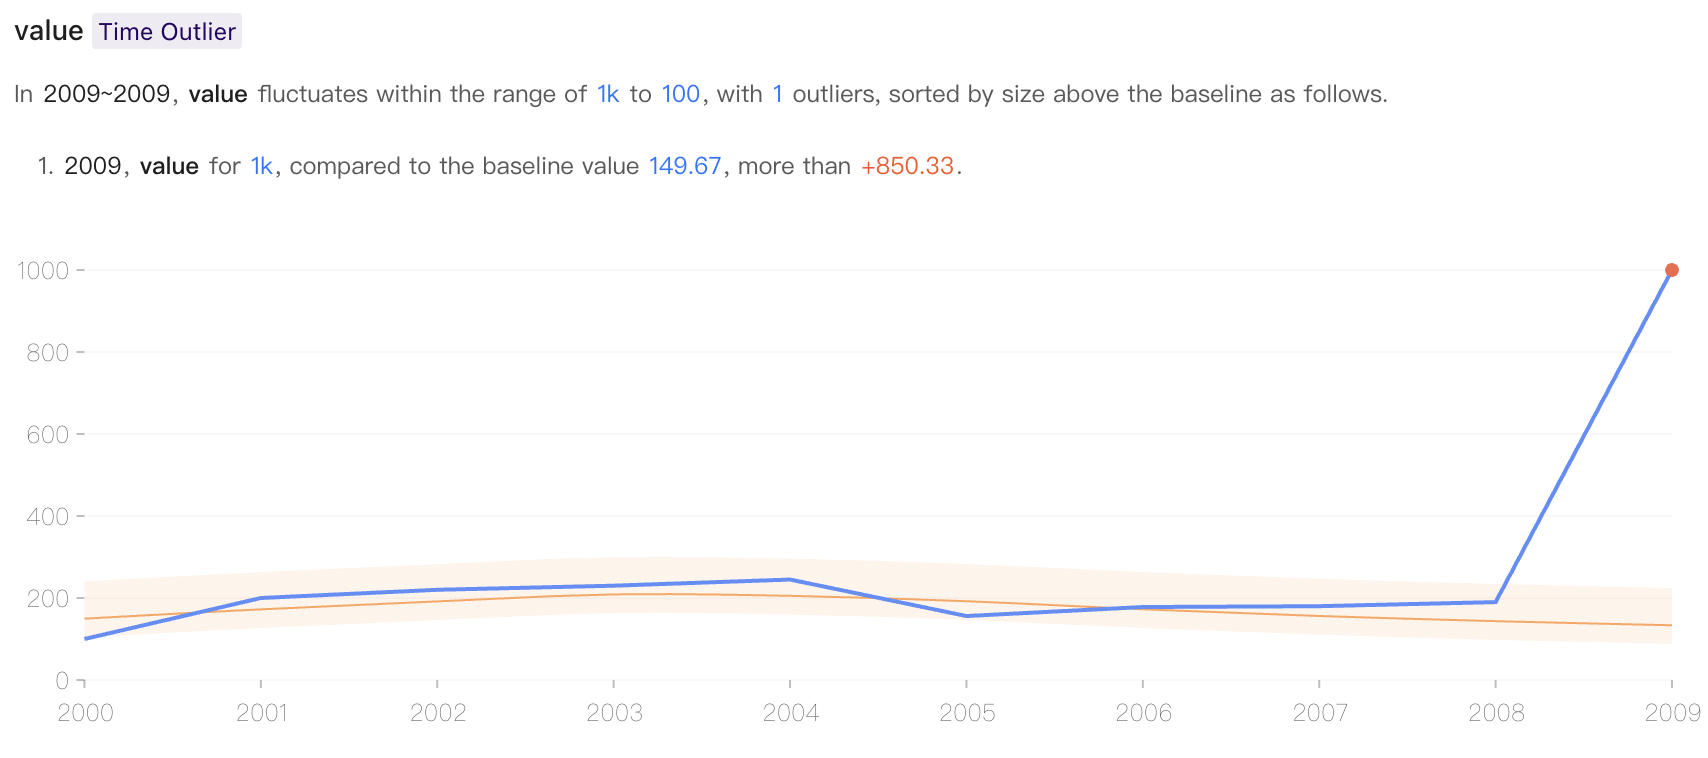
  1. Demo 1: Use the insight (Auto Insight) in @antv/ava to extract data insights. Input multi-dimensional data, the backend automatically runs different algorithms to find interesting patterns in the data, evaluates them uniformly and returns high-quality data insights according to the score.

    import { getInsights } from '@antv/ava';
    
    //  Input: Multi-dimensional data
    const data = [
        { year: '2000', value: 100 },
        { year: '2001', value: 200 },
        { year: '2002', value: 220 },
        { year: '2003', value: 230 },
        { year: '2004', value: 245 },
        { year: '2005', value: 156 },
        { year: '2006', value: 178 },
        { year: '2007', value: 180 },
        { year: '2008', value: 190 },
        { year: '2009', value: 1000 },
    ]
    
    // The insightRes contains interesting insights from the data.
    const insightRes = getInsights(data)
  2. Demo 2: Use <InsightCard /> in @antv/ava-react to display the insight results. This component can display data insight results directly, here using the insight results from Demo 1 as input:

    <div id="root"></div>
    // import <InsightCard /> component
    import { InsightCard } from '@antv/ava-react';
    
    const root = ReactDOM.createRoot(document.getElementById('root'));
    
    // render
    root.render(
      <InsightCard insightInfo={insightRes.insights[0]} visualizationOptions={{ lang: 'zh-CN' }} />
    );

    The result of the rendering is as follows:

    Data Insight Results

Contribution PRs Welcome

We welcome all contributions. Please read our Contributing Guide first. You can submit any ideas as pull requests or as GitHub issues. Let's build a better AVA together.

More at Wiki: Development.

Collaboration

iDVx

Papers

VizLinter

Chen, Q., Sun, F., Xu, X., Chen, Z., Wang, J. and Cao, N., 2021. VizLinter: A Linter and Fixer Framework for Data Visualization. IEEE transactions on visualization and computer graphics, 28(1), pp.206-216.

《数据可视化设计的类型学实践》(Exploring the Typology of Visualization Design)

蓝星宇, 王嘉喆. 数据可视化设计的类型学实践, 《美术大观》, 2022(3), 149-152.

License

MIT@AntV.

ava's People

Contributors

aceleewinnie avatar ai-qing-hai avatar amyqianqianwang avatar arranzeyuwang avatar bbsqq avatar beewolf233 avatar chenluli avatar chenying2929 avatar cuiyansong avatar cxxxxxn avatar esorakouki avatar gaiapang avatar guangmingyoubei avatar imgbotapp avatar intchous avatar ixuxinyue avatar jeffy2012 avatar lai-x avatar leipeng1223 avatar lzxue avatar neoddish avatar observedobserver avatar olivialan avatar pddpd avatar pearmini avatar soundquiet avatar tomotoes avatar topgrd avatar yanyan-wang avatar ymyqwe avatar

Stargazers

 avatar  avatar  avatar  avatar  avatar  avatar  avatar  avatar  avatar  avatar  avatar  avatar  avatar  avatar  avatar  avatar  avatar  avatar  avatar  avatar  avatar  avatar  avatar  avatar  avatar  avatar  avatar  avatar  avatar  avatar  avatar  avatar  avatar  avatar  avatar  avatar  avatar  avatar  avatar  avatar  avatar  avatar  avatar  avatar  avatar  avatar  avatar  avatar  avatar  avatar  avatar  avatar  avatar  avatar  avatar  avatar  avatar  avatar  avatar  avatar  avatar  avatar  avatar  avatar  avatar  avatar  avatar  avatar  avatar  avatar  avatar  avatar  avatar  avatar  avatar  avatar  avatar  avatar  avatar  avatar  avatar  avatar  avatar  avatar  avatar  avatar  avatar  avatar  avatar  avatar  avatar  avatar  avatar  avatar  avatar  avatar  avatar  avatar  avatar  avatar

Watchers

 avatar  avatar  avatar  avatar  avatar  avatar  avatar  avatar  avatar  avatar  avatar  avatar  avatar  avatar  avatar  avatar  avatar  avatar  avatar  avatar  avatar  avatar  avatar  avatar  avatar  avatar  avatar  avatar  avatar  avatar  avatar  avatar  avatar  avatar  avatar  avatar  avatar  avatar  avatar

ava's Issues

【bug】无指定数据状态下初始化表格,点击 config 后 js 报错

🐛 bug 描述

无指定数据状态下初始化表格,点击 config 后js报错,如果设置了数据,没有此现象。

📷 复现步骤

  1. 未指定 data 数据下初始化表格
  2. 选择某一个图表类型后,成功渲染
  3. 点击 config 后内部 js 报错,流程终止

🏞 期望结果

可以继续流程。

💻 复现代码

© 版本信息

  • @antv/chart-advisor: 0.1.3-alpha.17
  • 浏览器环境: chrome 80.0.3987.122
  • 开发环境: macOS

🚑 其他信息

报错截图:报错信息

CKB Completion 图表知识库补全计划

目前我们的图表知识库(CKB)还有很多信息不完备,急需社区合力讨论、补充。

At present, our Chart Knowledge Base still has a lot of incomplete information, which urgently needs the community to discuss and supplement together.

关于为什么要做 CKB,这篇文章进行了解释:《AVA/CKB:一次性解决图表命名问题》

This article explains why CKB is required: "AVA/CKB: Solving the Chart Naming Problem at One Time" (Sorry, only the Chinese version is available)

如何贡献 How to contribute

请参考我们的 CKB 贡献指南,里面有操作细节,感谢!

Please refer to our CKB contribution guide, which has operational details, thanks!

多次执行autochart报错

hi
我写了一个使用autochart的demo,想实现切换图标数据的功能。
当时点击‘data1’按钮第一次切换数据时,是可以的
当时点击‘data2’按钮第二次切换数据时,控制台报错
image

image

调试代码发现,当第一次切换数据时,从父节点中移除了noDataLayer,然后在构建图表时由于这句代码,没有将noDataLayer重新添加至container节点下。

我当前的临时绕过方法:在报错行后(noDataLayer从父节点移除后),增加 this.noDataLayer = undefined

想请问下
1、这是一个bug吗,还是说是我切换数据的方式不正确?
2、我的这种临时绕过方法,是否是合理的,是否会影响antochart内部的 “缓存”,或者引起其他问题?

期待回复。谢谢。

重现步骤:
打开demo,依次点击data1 、data2按钮,当点击data2按钮时报错

关于AVA推荐列表的疑问

AVA推荐是基于图表知识库的,但是其能够推荐出的图表目前是没有覆盖知识库中所有图表类型的吧?例如力导向图是不是就没有办法推荐。
那这个情况下,不知道在哪里可以找到AVA当前能够推荐的所有图表的列表。
另外AVA目前是都基于G2plot进行推荐对吧,与G2的结合是否有方法。
我是可视化产品经理,问题有不专业的地方请见谅!

1122 site theme picture

本年度 AntV 品牌日 AVA 将开源产品网站,现向社区征集主站主题图片🌟 ,放置如下图的位置。有意向的设计师 / 工程师欢迎来撩~~
image

g2plotRender渲染图表libConfig问题

用g2plotRender渲染图表时,如何配置libConfig,才可以让图表以指定颜色显示。
我的代码:
export const colors10 = ['#4DBFE8', '#F9A741', '#3B7ECD', '#E0725F', '#ECDEDE', '#07817C', '#1161C8', '#FFE581', '#5ABEF9', '#D87E49',];
image
显示效果:
image
image
我的问题:
我设置了同时设置了color10和defaultColor,在多条折线图时,color10的设置生效,但是在单条折线图(或者单条柱形图)时,defaultColor没有生效,因为折线(或柱形)并没有按照color10[0]的颜色进行展现。

图表-自定义内容

大佬 假如想实现自定义内容
比如: 坐标轴X、Y的文本自定义 (label, value) 这种 我想显示成 value% 这种怎么配置
自定义图形显示颜色 根据value值的不同,显示自定义的颜色能否实现
tooltip的内容能否自定义
这些在G2的使用中 都可以通过api就行修改,用autoChart能否在configs种实现自定义呢

Adaptor for G2

There is only a mapping from chart specification to G2Plot. We will need one for G2.

结合g2plot使用AVA的一些问题

疑惑:

  1. AVA是否能支持交互事件的注册
  // 如onPlotClick等,尝试在导出的configs里配置,但是会报错
   events:{
      onPlotClick:(ev)=>{console.log(ev)}
   }
  1. AVA的文档(autochartoptions.md)太简洁了,部分内容不易理解,
  • 比如toolbar似乎不是我理解的toolbar,配置开或关都没有对图表产生影响
  1. 在实际的报表需求中会有图表切换,导出报表等特殊需求,需要一个工具栏(toolbar)可以自定义图标按钮用于功能的使用,如果本身不提供默认toolbar的话有没有什么入口允许自定义render工具栏。

PS:在使用了AVA后确实是觉得可以更快速的生成配置参数,然后结合g2plot的文档再进行细化定制,效率感人。但是如果无法绑定事件,以及提供一些额外的参数配置入口(比如需要做图表和表格的切换功能,可能就需要自定义一个表格组件在toolbar点击切换的时候用表格覆盖当前图表,制造切换的效果)最后还是会因为需求覆盖率的问题不得不放弃AVA。

rename it as `dataToSpecs` and export it

* @todo rename it as `dataToSpecs` and export it
*/
export function analyze(data: any[], options?: AdvisorOptions): Advice[] {
console.log('💠💠💠💠💠💠 data 💠💠💠💠💠💠');
console.log(data);
console.log('🍯🍯🍯🍯🍯🍯 options 🍯🍯🍯🍯🍯🍯');


This issue was generated by todo based on a todo comment in 4dab7b9 when #44 was merged. cc @antvis.

建议开发模式下的配置面板本地化

目前开发模式下的配置面板链接到 https://render.alipay.com/p/s/autoChart/config-panel.html?type=Area&cancopydata=false 的独立html页面,能否单独开源出来用户自由部署。
目前的方案有两个问题:
1.该页面需要加载antd.js moment.js以及react.development.js等文件,载入时间较长,表现为打开时卡顿;

2.不方便内网部署。

最终效果类似下面这样:

image

另外:参数中的cancopydata能否开发出来,默认为true;

[SoC2020] Insight Workers for Insight Detection

数据集洞察识别器的研发
Insight Workers for Insight Detection

What is SoC2020: #69

描述 Description

AVA 是一套智能可视化解决方案,目前已经初步解决了从给定数据字段智能推荐和生成单个图表的问题,现阶段一个重要的目标是从多维数据集中自动识别出含有“洞察”的字段子集。比如,输入 20 列数据,能发现第 1、2 列存在相关关系;第 6 列的可选值中存在一个绝大占比的值;第 2、8 列形成的时序关系中存在几个异常值,等等。

我们为这个任务提供了一个简单的结构:示例。结构中对每一种洞察定义了一个 InsightWorker,调用这个 InsightWorker 的特定方法可以检索出数据集中所有包含这种洞察类型的字段组合子集

AVA is a framework  for automated and augmented visual analytics. At present, the problem of recommendation and generation of a single chart from given data fields has been initially solved. An important goal at this stage is to automatically identify subsets of fields that containing "insights" from a multi-dimensional dataset. The insights include correlation, majority, outliers, etc.

We provide a demo structure for this task. An InsightWorker is defined for each type of insight, and a specific method of this InsightWorker can retrieve subsets of all fields that contain this type of insight.

目标 Goal

参与研发部分 InsightWorkers,使它们能够服务于 AVA 的洞察识别功能:

  1. 思考、调研并提出可能的洞察类型,指出其应用场景和分析价值。参考 pbi 洞察(见解)类别
  2. 针对至少三个洞察类别的 InsightWorker 进行完整的开发工作。
  3. 包括相关文档、测试的撰写。
  4. 为这些 InsightWorker 编写易于测试和展示的 demo。参考:示例
  5. 这些 InsightWorker 应该可以与其他 InsightWorker 整合使用
  6. 为每一种被识别出的洞察类别设计相关的最佳展示可视化。参考 pbi 洞察(见解)类别
  7. 在研发过程中,如需使用到图表自动生成、数据预处理等环节的功能,学习并使用 AVA 的其他模块和 API 来完成(比如 DataWizard 来处理数据)。如果 AVA 相关模块的能力不足以支持,则参与到这些模块的能力补全中去。

Participate in the development of some InsightWorkers so that they can serve the insight recognition.

  1. Research and propose possible types of insights, pointing out their application scenarios and analytical value. See: Power BI insight types
  2. Complete development  on at least three InsightWorkers.
  3. Write test cases and docs for them.
  4. Write demos for these InsightWorkers to make them  easy to test and represent. See: Examples
  5. These InsightWorkers should be able to integrate with other InsightWorkers.
  6. Design the best presentation visualization for each identified insight type. See: Power BI insight types
  7. packages.In the research and development process, if you need to use  features like automatic chart generation and data preprocessing, try modules and APIs of AVA (such as DataWizard to process data). If the capabilities of  AVA packages are not sufficient to support, then participate in the completion of the capabilities of these modules.

需要技能 Prerequisite Skills

  1. 对数据可视化有基本理解,有可视化类库(如 G2/d3/echarts)的使用经验
  2. 有 JavaScript、TypeScript、前端工程的基本能力
  3. 有对数据分析、商业智能 BI 的基本了解和相关工具或产品的使用经验
  4. 有良好的数学功底,有机器学习相关知识尤佳

  1. Basic understanding of data visualization and experience in using visualization libraries (such as G2/d3/echarts).
  2. JavaScript, TypeScript and front-end engineering skills.
  3. Basic understanding of data analysis, business intelligence and experience in using related tools or products.
  4. Good math skills, machine learning knowledge would be a plus.

Besides nominal data, can ordinal data be used in bar/column charts as well?

Now all defined charts in BarChart family and ColumnChart family only receive nominal data as classification dimension, would it possible to use ordinal data as well?

As wiki mentioned:

Ordinal data is a categorical, statistical data type where the variables have natural, ordered categories. ...
The ordinal scale is distinguished from the nominal scale by having a ranking.

Maybe it is ok to have ordinal data in bar/column charts?

0.1.3-beta.5 文件引用路径错误

Cannot find module '../../../../datawizard/transform' from 'node_modules/@antv/chart-advisor/lib/insight/insightWorkers/monotonicity.js'

引用方式需要修改一下,datawizard 下也是 npm 包,导致实际发布之后文件目录发生改变,应当为以下引用方式

import { RowData, autoTransform, AggregationType } from '@antv/dw-transform';

Support field meta

The BI system generally have data model detail and the field meta info is similar to dataProps, should we support user to input the field meta to overwrite or replace dataProps?

To split the advisor pipeline

The current chart recommending pipeline is data > G2Plot.

The whole process is in one huge function analyze().

For flexibility and expansibility, the pipeline should be splited divided into smaller tubes, like:
data > data props > chart schema(specification) > library translator > chart code

There could be api for each step to enable different usages.

饼图(🍪曲奇饼)相加的总和出现浮点数异常

image

配置如下

import React, { useEffect, useRef } from 'react';
import { autoChart } from '@antv/chart-advisor';

/**
 * https://www.npmjs.com/package/@antv/chart-advisor
 *
 * https://observablehq.com/@jiazhewang/autochart-automatic-chart-dev-library-by-antv
 */

const AChart = ({ option: { data = [], ...option }, ...props }) => {
  const instance = useRef(null);
  useEffect(() => {
    if (!instance) {
      return;
    }
    autoChart(instance.current, data, option);
  }, [option, data]);
  return <div ref={instance} {...props} />;
};

export default function() {
  const option = {
    data: [
      { 区域: 'East', 销量: 4684.44 },
      { 区域: 'North', 销量: 4137.09 },
      { 区域: 'NorthEast', 销量: 2681.46 },
      { 区域: 'SouthEast', 销量: 2447.01 },
      { 区域: 'SouthWest', 销量: 818.59 },
      { 区域: 'NorthWest', 销量: 1303.5 },
    ],
    purpose: 'Comparison',
    toolbar: 'true',
    title: '某数据对比图',
    description: '统计区间:2019-2010',
    theme: 'light',
  };
  const chartStyle = { width: 800, height: 600 };

  return <AChart option={option} style={chartStyle} />;
}

Chart Knowledge Base Document System

描述

Chart Knowledge Base (CKB) 是一个提供图表经验的知识库,它的形式基于 JSON。CKB 希望能解决目前可视化研究环境(特别是中文环境)中概念、术语不统一的问题。降低领域内研究和讨论的沟通成本。我们基于数据可视化社区来共建一个图表知识库。每个参与者都可以提出自己对于图表的认识。我们会一起讨论来制定图表的名称、定义、分类和各种属性。CKB 的关键意义在于,他是智能图表推荐的基石。
为了便于更多不熟悉代码开发和 git 工具的设计师、分析师、行业相关人员可以参与到 CKB 的共建,我们需要一个网页来展示 CKB 的 内容,并支持用户直接编辑和提交相关字段。

目标

开发一个 web 的 Chart Knowledge Base 文档网页系统,包含如下功能:

  1. 支持 CKB 中图表类型的各种筛选
  2. 展示每种图表类型的细节属性
  3. 在每个属性一旁有编辑按钮,点击可以对属性内容进行编辑或添加
  4. 有些属性的编辑是结构化的,需要先添加或编辑选项,再对属性进行选择
  5. 编辑内容的提交自动发布到 github 仓库的 PR 或 issue。
  6. 系统需要能让用户授权 github 账号

1122 todo

  • custom rules
  • chart-advisor new pipeline and api
  • plot types +
  • autoChart config panel
  • test cases & coverage
  • pkg: datasample
  • pkg: thumbnails
  • docs
  • demos
  • promo articles

rename it as `dataToSpecs` and export it

* @todo rename it as `dataToSpecs` and export it
*/
export function analyze(data: any[], options?: AdvisorOptions): Advice[] {
console.log('💠💠💠💠💠💠 data 💠💠💠💠💠💠');
console.log(data);
console.log('🍯🍯🍯🍯🍯🍯 options 🍯🍯🍯🍯🍯🍯');


This issue was generated by todo based on a todo comment in 443fa9b. It's been assigned to @jiazhewang because they committed the code.

扩展性问题

请问下,几时有正式版?对其他其他插件图表是否有智能识别?

自定义数据转换为图表的问题

最近使用的时候,采用按照规则逐步解析为G2Plot配置的方法,我将G2Plot里的雷达图数据进行转换后advices里并没有雷达图选项,查看了dataPropsToAdvices方法的源码,但还是不明白对应的softScore和hardScore的计算。希望各位可以帮小弟解惑

🏖️ 2020 Alibaba Summer of Code - AntV

Welcome to the open source world!If you haven't planned how to spend this summer, come to the Alibaba Summer of Code and coding with us! 💻

Alibaba Summer of Code is a global program focused on engaging students directly into open source software development. Under the guidance of the mentor in the Alibaba open source project, students experience the software development in the real world.Alibaba Summer of code will begin between May 25th and September 5th. Students can use the summer time to participate in the open source project and work with the core members of the project.

What you can get?

On this exclusive developer journey, students will have the opportunity to:

  • Participate in the top projects of the International Open Source Foundation;
  • Get a scholarship from Alibaba;
  • Obtain an open source contributor certificate;
  • Get a fast pass of Alibaba Internship/recruitment;
  • Get your code adopted and used by the open source project!

Our Mentor

Jiazhe (Neo) Wang
GitHub ID:neoddish
Alibaba Data-Tech Expert, AntV Developer

Apply Now!

Step 1. You can click on these links to apply directly:

Step 2. Full list of Alibaba Summer of Code Projects

以下链接将与 5月25日 上线
These links would be available on May 25th.

image

Timeline⏳

image

Contact us!

Email Address: [email protected]

AVA使用的一些疑问

1.图表可以不设定宽高,自适应父容器吗?
2.貌似没有提供图表数据刷新、配置刷新的方法,如何刷新数据?
3.图表有时候会显示异常,柱状图丢失一部分不显示,不知道什么原因
image
但是在扇形图就是正常的,如下所示:
image

标题的优先级 advisor应大于G2 Plot的配置;导出的配置信息建议format一下;

问题1:标题的优先级 advisor应大于G2 Plot的配置

目前如果设置了configs,advisor的标题无法生效

import { autoChart, AutoChartOptions } from '@antv/chart-advisor';
 
export interface IAChart extends AutoChartOptions {
  data: any[];
  [key: string]: any;
}

  const config = {
    configs: {
      title: { visible: true, text: '百分比堆叠条形图(G2 Plot配置)' },
      description: { visible: true, text: '一个简单的百分比堆叠条形图(G2 Plot配置)' },
      legend: { flipPage: false },
      xAxis: { label: { visible: true }, title: { visible: true, text: '月份' } },
      yAxis: { title: { text: '数值' } },
      label: { position: 'right' },
      xField: 'x',
      yField: 'y',
      stackField: 'serie',
      smooth: true,
      point: { visible: true },
      width: 800,
      height: 600,
    },
    type: 'Area',
  };

  const option: IAChart = {
    data,
    toolbar: true,
    title: '百分比堆叠条形图(advisor配置)',
    description: '一个简单的百分比堆叠条形图(advisor配置)',
    theme: 'light',
    config,
    development: true,
    preferences: {
      canvasLayout: 'landscape',
    },
  };

渲染结果如下:
image

如果把G2 Plot中的title配置信息删除,保留advisor的title配置,渲染结果不含标题;

问题2: perferences中的canvasLayout修改之后无变化;

优化建议: 导出的配置信息建议format;

一组奇怪的数据,导致无法画出图形

const region_sales = [

{ btag: 'fav',count:  997815},
{ btag: 'pv', count:  1135028},
{ btag: 'buy',count: 5388715},
];

就是没法画出图形的,但是
const region_sales = [

{ btag: 'fav',count:  997815},
{ btag: 'pv', count:  1135028},
{ btag: 'buy',count: 5388715},
{ btag: 'buy',count: 0},
];
就是可以画出图形的

Recommend Projects

  • React photo React

    A declarative, efficient, and flexible JavaScript library for building user interfaces.

  • Vue.js photo Vue.js

    🖖 Vue.js is a progressive, incrementally-adoptable JavaScript framework for building UI on the web.

  • Typescript photo Typescript

    TypeScript is a superset of JavaScript that compiles to clean JavaScript output.

  • TensorFlow photo TensorFlow

    An Open Source Machine Learning Framework for Everyone

  • Django photo Django

    The Web framework for perfectionists with deadlines.

  • D3 photo D3

    Bring data to life with SVG, Canvas and HTML. 📊📈🎉

Recommend Topics

  • javascript

    JavaScript (JS) is a lightweight interpreted programming language with first-class functions.

  • web

    Some thing interesting about web. New door for the world.

  • server

    A server is a program made to process requests and deliver data to clients.

  • Machine learning

    Machine learning is a way of modeling and interpreting data that allows a piece of software to respond intelligently.

  • Game

    Some thing interesting about game, make everyone happy.

Recommend Org

  • Facebook photo Facebook

    We are working to build community through open source technology. NB: members must have two-factor auth.

  • Microsoft photo Microsoft

    Open source projects and samples from Microsoft.

  • Google photo Google

    Google ❤️ Open Source for everyone.

  • D3 photo D3

    Data-Driven Documents codes.