If you use this code, please consider citing it as: M.A. García-Campos. (2018, March 17). AngelCampos/Pathifier-Tool-Kit: v1.0 (Version pathifierTools_v1.0). Zenodo. http://doi.org/10.5281/zenodo.1202186
This repository has been developed to help users to run Pathifier and visualize its results in an interactive manner. The code may need modifications according to user's needs.
Pathifier is an algorithm designed to model the heterogeneity in samples based on their genomic data, e.g. gene expression levels, in a pathway centered manner (Drier et al., 2013). It does it by calculating the level of deregulation compared to a control group taking into account all the genes involved in a specific pathway. In this manner it is possible to represent samples with fewer, but more informative variables, based on biological knowledge of the biomolecules that work togheter in a pathway (e.g. apoptosis).
The following scripts may be used for easier loading of data, and calculation of default arguments not implemented in the native functions. As well as attractive plotting of the results of the deregulation analysis.
An R script for running Pathifier (Drier et al., 2013) in R.
First file required is TAB separated file of the gene expression matrix in the following format:
| NAME | Sample1 | Sample2 | Sample3 | Sample n... |
|---|---|---|---|---|
| NORMALS | 1 | 1 | 0 | ... |
| Gene1 | 1.25 | 1.56 | 2.56 | ... |
| Gene2 | 4.56 | 0.25 | 1.75 | ... |
| Gene3 | 1.56 | 3.21 | 1.36 | ... |
| GeneN | ... | ... | ... | ... |
1st row = Sample names 2nd row = Normal status of samples: 1 = Healthy, 0 = Tumor 1st col = Gene names from third row on (Gene symbol format is recommended)
Second file required by the script is a TAB separated file of the pathway information in GMT format:
| PATHWAY1 | Blank cell | GeneA | GeneB | GeneC | etc... |
| PATHWAY2 | Blank cell | GeneD | GeneA | GeneX | etc... |
Notes:
- NO HEADER ROW!
- Gene names used must coincide between expression matrix and pathway annotation
- GMT format: Each row represents a pathway. 1st column is pathway name or id, 2nd column it's discarded BUT needed, from the 3rd column on starts the genes belonging to that pathway.
- The PDS stability procedure is set to 10 for illustrative purposes (default should be 100),
Test-data is provided on TEST-DATA directory
Powered by package(s): "pathifier"
An R script for showing results of Pathifier (Drier et al., 2013) in a heatmap, showing the deregulation of each sample by pathway.
This script works directly with the results of the "1_Run_Pathifier.R" script and the stand-alone version of Pathifier, adding a vector for depicting normal samples (See additional notes).
The last update of the heatmap adds sample labeling for normal (healthy) vs tumoral samples
Output preview (using EXAMPLE_DATA)

Powered by package(s): "gplots", "RColorBrewer"
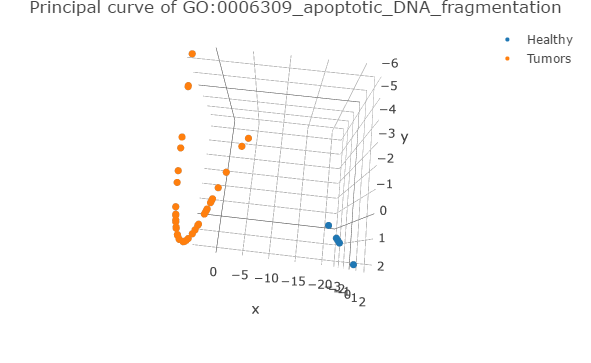
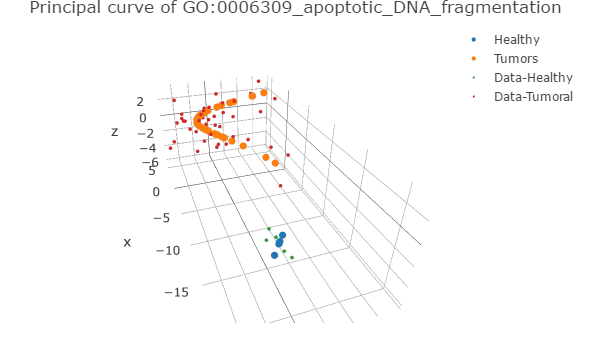
An R script with 2 functions for plotting the principal curves derived of the pathway deregulation analysis using Pathifier (Drier et al., 2013)
This script works directly with the results of "1_Run_Pathifier.R" script and the stand-alone version of Pathifier, adding a vector for depicting normal samples (See additional notes).
Output examples (using EXAMPLE_DATA)
Powered by package(s): "plotly", "RColorBrewer"
Pathifier Stand-alone version: http://www.weizmann.ac.il/complex/compphys/software/yotam/pathifier/installation.html
R-version of Pathifier is available via Bioconductor: http://bioconductor.org/packages/pathifier/
For Pathifier support, please contact the maintainer of the package Assif Yitzhaki


