Code Monkey home page Code Monkey logo

python-science-tutorial's Introduction

Python Science Tutorials ๐Ÿ“ˆ๐Ÿ“Š

This repository will contain a series of scripts and notebooks to help people get acclimated to using Python for scientific publications.
Follow me at: @naveen.venkatesan


Table of Contents

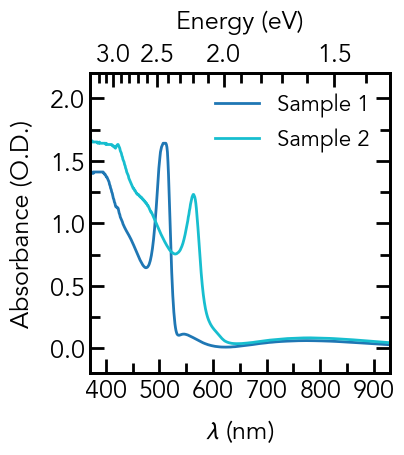
  1. An Introduction to Making Scientific Publication Plots with Python

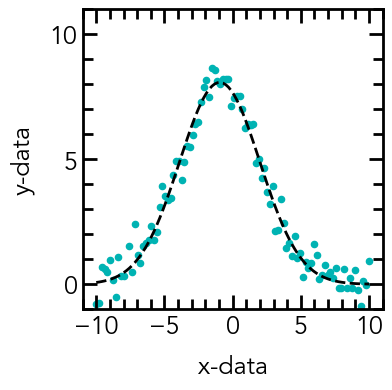
  2. Basic Curve Fitting of Scientific Data With Python

  3. Visualizing Three-Dimensional Data - Heatmaps, Contours, and 3D Plots with Python

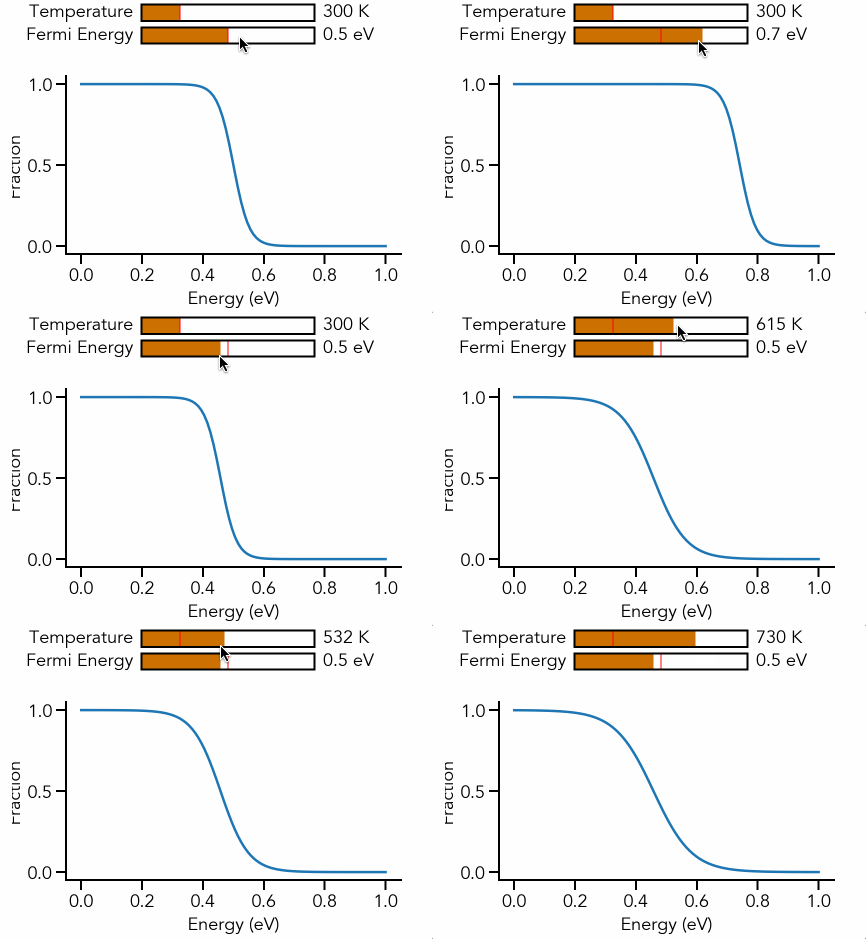
  4. Intro to Dynamic Visualization with Python - Animations and Interactive Plots

  5. A Guide to Creating and Using Your Own Matplotlib Style

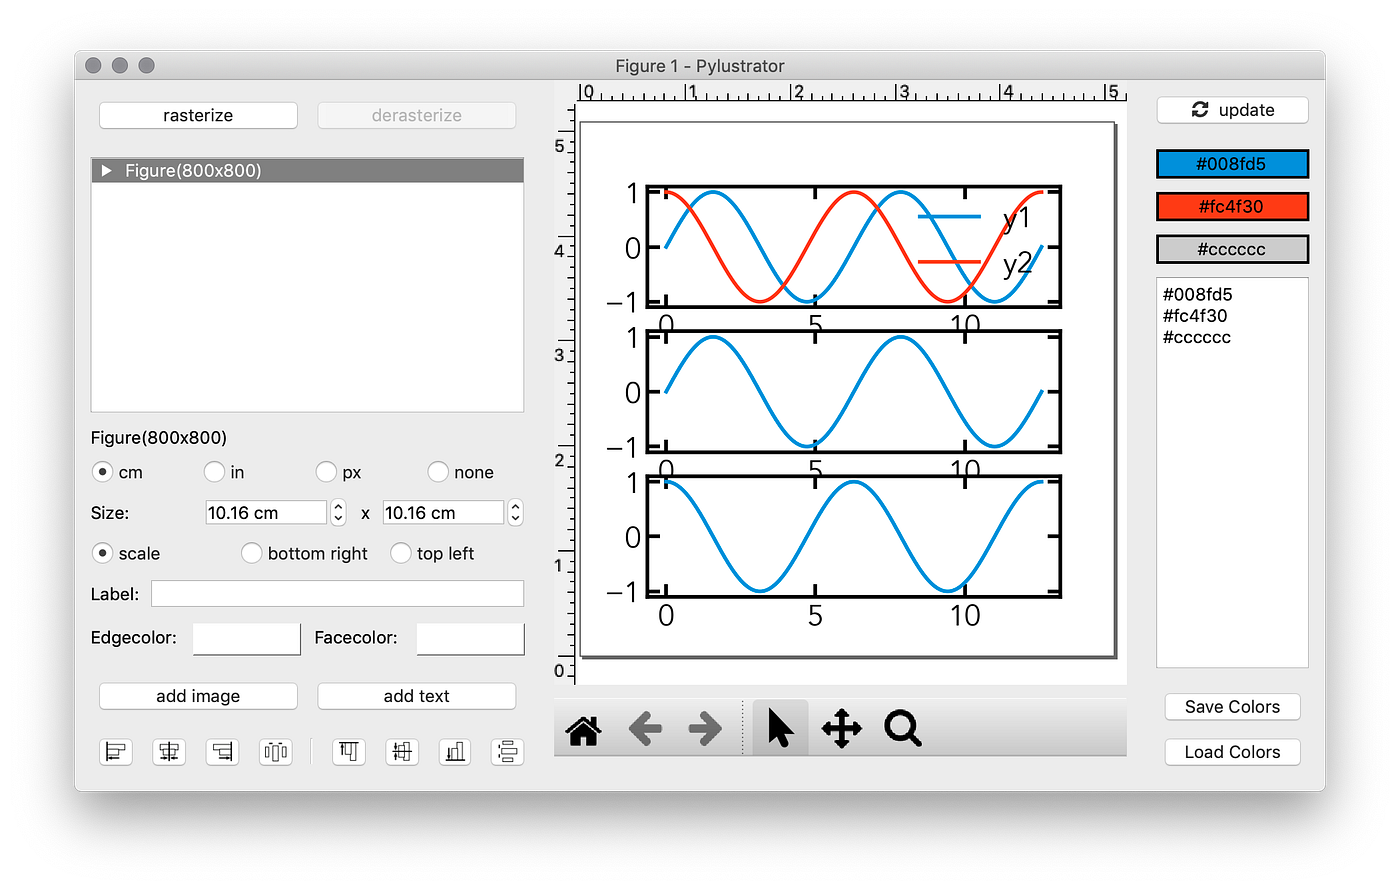
  6. Generate Easily Reproducible Scientific Figures with Pylustrator


An Introduction to Making Scientific Publication Plots with Python

Link to Article: https://towardsdatascience.com/an-introduction-to-making-scientific-publication-plots-with-python-ea19dfa7f51e

Notebook: python-plotting-intro.ipynb


Basic Curve Fitting of Scientific Data With Python

Link to Article: https://towardsdatascience.com/basic-curve-fitting-of-scientific-data-with-python-9592244a2509

Notebook: curve-fitting-tutorial.ipynb


Visualizing Three-Dimensional Data - Heatmaps, Contours, and 3D Plots with Python

Link to Article: https://towardsdatascience.com/visualizing-three-dimensional-data-heatmaps-contours-and-3d-plots-with-python-bd718d1b42b4

Notebook: heatmaps.ipynb


Intro to Dynamic Visualization with Python - Animations and Interactive Plots

Link to Article: https://towardsdatascience.com/intro-to-dynamic-visualization-with-python-animations-and-interactive-plots-f72a7fb69245

Notebook: animation.ipynb


A Guide to Creating and Using Your Own Matplotlib Style

Link to Article: https://towardsdatascience.com/a-guide-to-creating-and-using-your-own-matplotlib-style-30de6c60bac0

Style File: scientific.mplstyle


Generate Easily Reproducible Scientific Figures with Pylustrator

Link to Article: https://towardsdatascience.com/generate-easily-reproducible-scientific-figures-with-pylustrator-9426292e07a4

Python Script: plot.py


Recommend Projects

  • React photo React

    A declarative, efficient, and flexible JavaScript library for building user interfaces.

  • Vue.js photo Vue.js

    ๐Ÿ–– Vue.js is a progressive, incrementally-adoptable JavaScript framework for building UI on the web.

  • Typescript photo Typescript

    TypeScript is a superset of JavaScript that compiles to clean JavaScript output.

  • TensorFlow photo TensorFlow

    An Open Source Machine Learning Framework for Everyone

  • Django photo Django

    The Web framework for perfectionists with deadlines.

  • D3 photo D3

    Bring data to life with SVG, Canvas and HTML. ๐Ÿ“Š๐Ÿ“ˆ๐ŸŽ‰

Recommend Topics

  • javascript

    JavaScript (JS) is a lightweight interpreted programming language with first-class functions.

  • web

    Some thing interesting about web. New door for the world.

  • server

    A server is a program made to process requests and deliver data to clients.

  • Machine learning

    Machine learning is a way of modeling and interpreting data that allows a piece of software to respond intelligently.

  • Game

    Some thing interesting about game, make everyone happy.

Recommend Org

  • Facebook photo Facebook

    We are working to build community through open source technology. NB: members must have two-factor auth.

  • Microsoft photo Microsoft

    Open source projects and samples from Microsoft.

  • Google photo Google

    Google โค๏ธ Open Source for everyone.

  • D3 photo D3

    Data-Driven Documents codes.