Code Monkey home page Code Monkey logo

altair-transform's Introduction

altair-transform

Python evaluation of Altair/Vega-Lite transforms.

build status github actions github actions code style black

altair-transform requires Python 3.6 or later. Install with:

$ pip install altair_transform

Altair-transform evaluates Altair and Vega-Lite transforms directly in Python. This can be useful in a number of contexts, illustrated in the examples below.

Example: Extracting Data

The Vega-Lite specification includes the ability to apply a wide range of transformations to input data within the chart specification. As an example, here is a sliding window average of a Gaussian random walk, implemented in Altair:

import altair as alt
import numpy as np
import pandas as pd

rand = np.random.RandomState(12345)

df = pd.DataFrame({
    'x': np.arange(200),
    'y': rand.randn(200).cumsum()
})

points = alt.Chart(df).mark_point().encode(
    x='x:Q',
    y='y:Q'
)

line = alt.Chart(df).transform_window(
    ymean='mean(y)',
    sort=[alt.SortField('x')],
    frame=[5, 5]
).mark_line(color='red').encode(
    x='x:Q',
    y='ymean:Q'
)

points + line

Altair Visualization

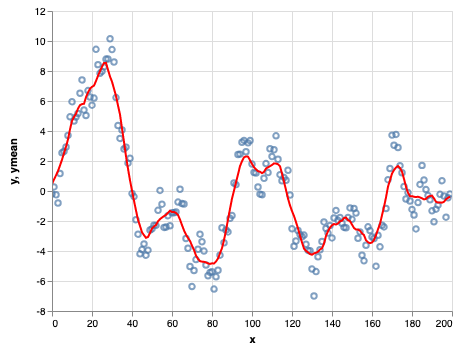
Because the transform is encoded within the renderer, however, the computed values are not directly accessible from the Python layer.

This is where altair_transform comes in. It includes a (nearly) complete Python implementation of Vega-Lite's transform layer, so that you can easily extract a pandas dataframe with the computed values shown in the chart:

from altair_transform import extract_data
data = extract_data(line)
data.head()
x y ymean
0 0 -0.204708 0.457749
1 1 0.274236 0.771093
2 2 -0.245203 1.041320
3 3 -0.800933 1.336943
4 4 1.164847 1.698085

From here, you can work with the transformed data directly in Python.

Example: Pre-Aggregating Large Datasets

Altair creates chart specifications containing the full dataset. The advantage of this is that the data used to make the chart is entirely transparent; the disadvantage is that it causes issues as datasets grow large. To prevent users from inadvertently crashing their browsers by trying to send too much data to the frontend, Altair limits the data size by default. For example, a histogram of 20000 points:

import altair as alt
import pandas as pd
import numpy as np

np.random.seed(12345)

df = pd.DataFrame({
    'x': np.random.randn(20000)
})
chart = alt.Chart(df).mark_bar().encode(
    alt.X('x', bin=True),
    y='count()'
)
chart
MaxRowsError: The number of rows in your dataset is greater than the maximum allowed (5000). For information on how to plot larger datasets in Altair, see the documentation

There are several possible ways around this, as mentioned in Altair's FAQ. Altiar-transform provides another option via the transform_chart() function, which will pre-transform the data according to the chart specification, so that the final chart specification holds the aggregated data rather than the full dataset:

from altair_transform import transform_chart
new_chart = transform_chart(chart)
new_chart

Altair Visualization

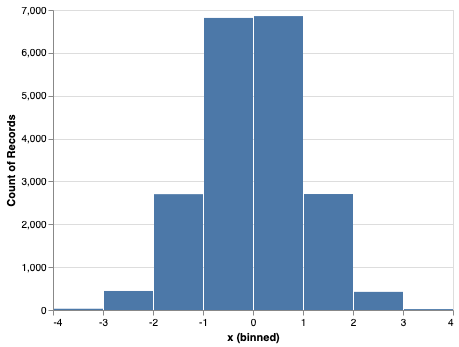
Examining the new chart specification, we can see that it contains the pre-aggregated dataset:

new_chart.data
x_binned x_binned2 count
0 -4.0 -3.0 29
1 -3.0 -2.0 444
2 -2.0 -1.0 2703
3 -1.0 0.0 6815
4 0.0 1.0 6858
5 1.0 2.0 2706
6 2.0 3.0 423
7 3.0 4.0 22

Limitations

altair_transform currently works only for non-compound charts; that is, it cannot transform or extract data from layered, faceted, repeated, or concatenated charts.

There are also a number of less-used transform options that are not yet fully supported. These should explicitly raise a NotImplementedError if you attempt to use them.

altair-transform's People

Stargazers

 avatar  avatar  avatar  avatar  avatar  avatar  avatar  avatar  avatar  avatar  avatar  avatar  avatar  avatar  avatar  avatar  avatar  avatar  avatar  avatar  avatar  avatar  avatar  avatar  avatar  avatar  avatar  avatar  avatar  avatar  avatar  avatar  avatar  avatar  avatar  avatar  avatar  avatar  avatar  avatar  avatar  avatar  avatar  avatar  avatar  avatar  avatar  avatar  avatar  avatar  avatar  avatar  avatar  avatar  avatar  avatar  avatar  avatar  avatar  avatar  avatar  avatar  avatar  avatar  avatar  avatar  avatar  avatar  avatar  avatar

Watchers

 avatar  avatar  avatar  avatar  avatar  avatar  avatar  avatar

altair-transform's Issues

Implement Vega-Lite 4.0 transforms

Vega-Lite 4.0 adds a number of additional transforms, including density, loess, pivot, quantile, and regression. These can't be fully supported until Altair 4.0 comes out, but we could start implementing them before that.

Extract transforms from encodings

We should support transforms specified as part of encodings. For example, we could create a helper function that would take a spec like this (vega editor):

{
  "data": { "url": "data/population.json"},
  "mark": "bar",
  "encoding": {
    "y": {
      "field": "age", "type": "ordinal"
    },
    "x": {
      "aggregate": "sum",
      "field": "people",
      "type": "quantitative",
      "axis": {"title": "population"}
    }
  }
}

and convert it to something like this (vega editor):

{
  "data": {"url": "data/population.json"},
  "transform": [
    {
      "aggregate": [{"op": "sum", "field": "people", "as": "people"}],
      "groupby": ["age"]
    }
  ],
  "mark": "bar",
  "encoding": {
    "y": {"field": "age", "type": "ordinal"},
    "x": {
      "field": "people",
      "type": "quantitative",
      "axis": {"title": "population"}
    }
  }
}

Before passing it to the transform functionality.

Using Big Data with Altair

I wanted to reach out, since we have been working on a similar project over at https://github.com/Quansight/jupyterlab-omnisci.

The goal there is to let users create Altair charts and have the heavy lifting transparently executed on a database.

To get a feel for it, you can open the notebooks/Ibis + Altair + Extraction.ipynb notebook in Binder. If you run the cells, the graphs should appear.

We are using Ibis to build up the SQL expression. We are building it to execute on an OmniSci database, but most of the work should translate to any other Ibis backend.

Currently, we update the Vega Lite spec to take out the transforms and map them to Ibis. So we are implementing a very limited version of what you have here, targeting Ibis instead of Pandas, and using the extracted transforms in the VL spec.

However, our next goal is to support interactions, so that after a user interacts, a new query is computed and run. To do this, we are looking to switch from processing the Vega Lite spec to using the underlying Vega spec or graph. The idea being, we take the initial Altair chart, generate Vega Lite, convert to Vega, then pre-process the Vega spec to turn some of the transforms into a custom transform that will run the query using Ibis back on the kernel. We are tracking that here: https://github.com/Quansight/jupyterlab-omnisci/issues/54

On the Python side, that would involve somehow taking an existing Vega dataflow graph or Vega spec and understanding how those operations map to Ibis expressions. It seems that task shares a lot in common with what you have implemented here.

Like I said, although this work initially targets OmniSci, and their database is particular suited to computing these types of analytic queries, I hope that the general approach will be useful generally for using Altair in Python with other data sources on the kernel, like Pandas dataframes or other databases.

I would be happy to collaborate on any part of this that you would like or get your feedback on your general approach and understand if you have thoughts on how to support this kind of use case on top of Altair.

Also, thank you for helping to maintain this repo!

It's a treat to be able to use the UX in Altair to create large scale visualizations.

error with transform_fold

import pandas as pd
import numpy as np
import altair as alt

data = { 'ColA': {('A', 'A-1'): 'w',
                 ('A', 'A-2'): 'w',
                 ('A', 'A-3'): 'w',
                 ('B', 'B-1'): 'q',
                 ('B', 'B-2'): 'q',
                 ('B', 'B-3'): 'r',
                 ('C', 'C-1'): 'w',
                 ('C', 'C-2'): 'q',
                 ('C', 'C-3'): 'q',
                 ('C', 'C-4'): 'r'},
        'ColB': {('A', 'A-1'): 'r',
                 ('A', 'A-2'): 'w',
                 ('A', 'A-3'): 'w',
                 ('B', 'B-1'): 'q',
                 ('B', 'B-2'): 'q',
                 ('B', 'B-3'): 'e',
                 ('C', 'C-1'): 'e',
                 ('C', 'C-2'): 'q',
                 ('C', 'C-3'): 'r',
                 ('C', 'C-4'): 'w'} 
        }
                 
df = pd.DataFrame(data).reset_index( drop = True )

mychart = alt.Chart(df).transform_fold(
    [r'ColA', 'ColB'], as_=['column', 'value'] 
).mark_bar().encode(
    x=alt.X('value:N', sort=['r', 'q', 'e', 'w']),
    y=alt.Y('count():Q', scale=alt.Scale(domain=[0, len(df.index)])),
    column='column:N'
)

from altair_transform import extract_data
data = extract_data(mychart)
data.head()

generates the error:

altair-transform/altair_transform/core/fold.py in visit_fold(transform, df)
      9     transform = transform.to_dict()
     10     fold = transform["fold"]
---> 11     var_name, value_name = transform._get("as", ("key", "value"))
     12     value_vars = [c for c in df.columns if c in fold]
     13     id_vars = [c for c in df.columns if c not in fold]


AttributeError: 'dict' object has no attribute '_get'

mark_errorbar silently fails

import pandas as pd
import altair as alt
from altair_transform import transform_chart

df = pd.read_json('https://vega.github.io/vega-datasets/data/iris.json')

error_bars = alt.Chart(df).mark_errorbar(extent='ci').encode(
  x=alt.X('petalLength:Q', scale=alt.Scale(zero=False)),
  y=alt.Y('species:N')
)

transform_chart(error_bars)

The transformation does not take place but NotImplementedError is also not raised (which would be expected based on the Limitations section in the README).

Second example in README not working

I'm trying out altair-transform, and when I run the second example, I still get the MaxRowsError even with transform_chart(chart). Running extract_data(chart) doesn't work either; it gives me the input data unchanged.

Strangely, the first example works: extract_data(line) returns the aggregated dataframe.

altair v3.2.0
altair-transform v0.1.0

date() / monthdate() breaks on Pandas v2.0

import pandas as pd

source = pd.DataFrame({"A": [1,2,3,4], "B": pd.date_range("2023-06-1", periods=4, freq="D")})

from altair_transform import extract_data

# Works:
data = extract_data(alt.Chart(source).encode(x="A:Q", y="B:Q"))

# AttributeError: module 'pandas' has no attribute 'Int64Index'
data = extract_data(alt.Chart(source).encode(x="A:Q", y="date(B):Q"))

pd.Int64Index was removed in Pandas v2.0 (https://pandas.pydata.org/pandas-docs/version/1.5/reference/api/pandas.Int64Index.html) in favor of pd.NumericIndex

Support data generators

For example, this should work:

import altair as alt

chart = alt.Chart(
    {"sequence": {"start": -4, "stop": 4, "step": 0.1, "as": "x"}}
).transform_calculate(
    y="densityNormal(datum.x, 0, 1)"
).mark_line().encode(
    x='x:Q',
    y='y:Q'
)

from altair_transform import extract_data
extract_data(chart)

transform_chart breaks with BinParams extent

from altair_transform import transform_chart
transform_chart(
    alt.Chart(cdf2.select(pr.col("cleaned_stat_len")).to_pandas().head(100))
    .mark_bar()
    .encode(
        x=alt.X("binned_len:O"),
        y=alt.Y("count()", scale=alt.Scale(type="log")),
        tooltip="count()",
    ).transform_bin(
        'binned_len', field='cleaned_stat_len', bin=alt.Bin(maxbins=50, extent=[0, 100]) 
    )
)


Truncated Traceback (Use C-c C-$ to view full TB):
File ~/dev/instant-science/trademark/.venv/lib/python3.9/site-packages/altair_transform/transform/bin.py:36, in visit_bin(transform, df)
     33 field = transform_dct["field"]
     34 extent = df[field].min(), df[field].max()
---> 36 bins = calculate_bins(extent, **({} if bin is True else bin))
     38 if isinstance(col, str):
     39     df[col] = _cut(df[field], bins, return_upper=False)

TypeError: calculate_bins() got multiple values for argument 'extent'

Support compound charts

Currently the altair object transform only supports simple chart specifications. With a bit of work, we could also support layered, faceted, concatenated, and repeated charts as well.

Improve bin transform

Vega has some fairly sophisticated logic around choosing bin boundaries. Currently altair-transform does not do a good job of duplicating that logic.

Recommend Projects

  • React photo React

    A declarative, efficient, and flexible JavaScript library for building user interfaces.

  • Vue.js photo Vue.js

    ๐Ÿ–– Vue.js is a progressive, incrementally-adoptable JavaScript framework for building UI on the web.

  • Typescript photo Typescript

    TypeScript is a superset of JavaScript that compiles to clean JavaScript output.

  • TensorFlow photo TensorFlow

    An Open Source Machine Learning Framework for Everyone

  • Django photo Django

    The Web framework for perfectionists with deadlines.

  • D3 photo D3

    Bring data to life with SVG, Canvas and HTML. ๐Ÿ“Š๐Ÿ“ˆ๐ŸŽ‰

Recommend Topics

  • javascript

    JavaScript (JS) is a lightweight interpreted programming language with first-class functions.

  • web

    Some thing interesting about web. New door for the world.

  • server

    A server is a program made to process requests and deliver data to clients.

  • Machine learning

    Machine learning is a way of modeling and interpreting data that allows a piece of software to respond intelligently.

  • Game

    Some thing interesting about game, make everyone happy.

Recommend Org

  • Facebook photo Facebook

    We are working to build community through open source technology. NB: members must have two-factor auth.

  • Microsoft photo Microsoft

    Open source projects and samples from Microsoft.

  • Google photo Google

    Google โค๏ธ Open Source for everyone.

  • D3 photo D3

    Data-Driven Documents codes.