Holter monitor with heart rate analysis, Azure cloud based and dashboard.
For the complete and updated writeup of the project go to: https://www.hackster.io/308917/healthsphere-4e0430

Always use technology to improve the world, if you are a black hat or gray hat hacker please abstain at this point ......... or at least leave your star to make me feel less guilty XP.
- Introduction
- Materials
- Connection Diagram
- Azure Sphere and Azure Cloud Setup
- Arduino Holter Monitor
- BT Modules Configuration
- Azure CLI Setup
- Recieve Data and Save
- Setup Python Code
- Node-Red Setup
- Automate all
- The Final Product
- Our Epic DEMO
- Future Rollout
- References
Our heart beats 115200 times a day, it is such a fine machinery that does not stop during our lives, however, not many people have the advantage to have this machinery in good condition, many factors of daily life can permanently affect cardiac function .
Factors such as:
- Sedentary.
- Do not eat a balanced diet.
- Drink alcoholic drinks along with energy drinks.
- A long ETC ...
Too many people must undergo cardiac tests frequently in expensive hospitals with gigantic measuring devices.
That's why I decided through AzureSphere's amazing technology to create a real-time heart rate monitoring system and perform a dashboard deployment.

Hardware:
- AzureSphere x1.
https://www.newark.com/avnet/aes-ms-mt3620-sk-g/ms-sphere-iot-starter-kit/dp/02AH9206
- AD8232 x1.
https://www.amazon.com/dp/B0111QV7OY/ref=cm_sw_em_r_mt_dp_U_VKV1Db51D1HW8
- Arduino MKR Zero or any Arduino board x1.
https://store.arduino.cc/usa/arduino/arduino-mkr-family
- HC-05 x1.
https://www.amazon.com/dp/B01G9KSAF6/ref=cm_sw_em_r_mt_dp_U_8qV1DbACN624T
- HC-06 x1.
https://www.amazon.com/dp/B01CKW4FSI/ref=cm_sw_em_r_mt_dp_U_2qV1DbBEJE1BV
- Standed-Core Wire x1.
https://www.adafruit.com/product/2987
- USB - Serial TTL x1.
https://www.amazon.com/dp/B075N82CDL/ref=cm_sw_em_r_mt_dp_U_QRV1Db3CF84V8
- 3.7V 400mAh LiPo Battery x1.
https://www.amazon.com/dp/B016ZU9C2U/ref=cm_sw_em_r_mt_dp_U_dfW1DbPZ27F4A
Software:
- Visual Studio
- Azure Cloud.
- Mouse Recorder Premium.
- Node-Red.
- Arduino IDE.
- Python.
- Cloud MQTT.
This is the connection diagram of the system, Arduino and Sphere.


Services Connection Diagram:

The initial configuration of Azure Sphere is a bit long, however I totally recommend the official Microsoft documentation, because the instructions are very clear.
You need to save the following data for later.
- Hubname.

- Device id.

- ID Scope

-
Auth Number (Azure Sphere CLI)
azsphere tenant show-selected

Remember to download the program for the Azure Sphere called "Health Sphere", once you download it, open it with VS and in the file "app_manifiest.json"
-
Write ID Scope in "CmdArgs": [ "xxxxxxxxxxxxx" ]
-
Write Hubname in "AllowedConnections": [ "global.azure-devices-provisioning.net", "xxxxxxxxxxxxxx.azure-devices.net" ]
-
Write Auth Number in "DeviceAuthentication": "xxxxxxxxxxxxxxxxxxxxxxxxxxxxxxxxxxxxxxx"
  {
    "SchemaVersion": 1,
    "Name": "AvnetStarterKit-Hackster.io-V1.0",
    "ComponentId": "685f13af-25a5-40b2-8dd8-8cbc253ecbd8",
    "EntryPoint": "/bin/app",
    "CmdArgs": [ "xxxxxxxxxxxxx" ],
    "Capabilities": {
      "AllowedConnections": [ "global.azure-devices-provisioning.net", "xxxxxxxx.azure-devices.net" ],
      "AllowedTcpServerPorts": [],
      "AllowedUdpServerPorts": [],
      "Gpio": [ 0, 4, 5, 8, 9, 10, 12, 13, 34 ],
      "Uart": [ "ISU0" ],
      "I2cMaster": [ "ISU2" ],
      "SpiMaster": [],
      "WifiConfig": true,
      "NetworkConfig": false,
      "SystemTime": false,
      "DeviceAuthentication": "xxxxxxxxxxxxxxxxxxxxxxxxxxxxxxxxxxxxxxx"
    }
  }
Github Azure Samples (These samples are for the Azure Sphere from an earlier version, however the chip is the same, so most of the samples work on this Azure Sphere verison):
Azure Devices Heat Map:
- Azure Heat Map: http://avnet.me/azsphere-kit-map
UPDATE 21/11/2019:This project is already updated to the "3+Beta1909" version of the Target API Set, many projects will not work in Visual Studio, they do not configure it in this version.
https://docs.microsoft.com/en-us/azure-sphere/resources/release-notes-1909
Before starting, the EKG is composed of the following graph and we will call this segment PT.

The heart rate is mainly obtained by obtaining the distance between the peaks of the graph, this is called the RR segment.

In this case the frequency will be obtained through an algorithm implemented in arduino.
- First we get the ranges in which our AD8232 module is working.

We can observe that the wave approximately goes from 420 to 680 in the ADC reading, we will propose the following algorithm to detect the frequency.
-
Since what we are looking for the reference of the R segment, we can notice that 650 is a value that the R segment will always reach, therefore detecting a value greater than 650 will be the R segment.
float frec = 0; // initialize frecuency variable. unsigned long time1; // initialize first R time segment Reference. unsigned long time2; // initialize second R time segment Reference. int i=0; // initialize counter var. void setup() { Serial1.begin(115200); // Start Serial1. time1=millis(); // First time reference. } void loop() { int lec = analogRead(A6); // Taking the ADC value. if(lec > 650) // Set the 650 R value reference. { time2=millis(); // Taking the second time reference. frec+=((60*1000)/(time2-time1)); // Get heart rate in beats per minute. time1=millis(); // Taking the first time reference for the next segment. i++; // Add 1 to counter. if(i>10) { frec/=11; // Getting the average of 11 frequency samples. Serial1.println((int)frec); // Send the average to Azure Sphere (BT Serial Communication) i=0; // Restart counter frec = 0; // Restart frecuency value } delay(100); // Wait for the R wave to end, to prevent the algorithm from detecting the same R wave, the entire QRS segment lasts between 60 and 100 milliseconds, a delay of 100 milliseconds will work perfectly. } } -
This is the formula to obtain the heart rate.

The arduino generate a count in milliseconds, so the formula will be modified to work with the arduino values.

- Here a sample that the algorithm can detect the correct frequency, on the right are the values obtained by the Arduino and on the left a Xiaomi Mi Band 3.


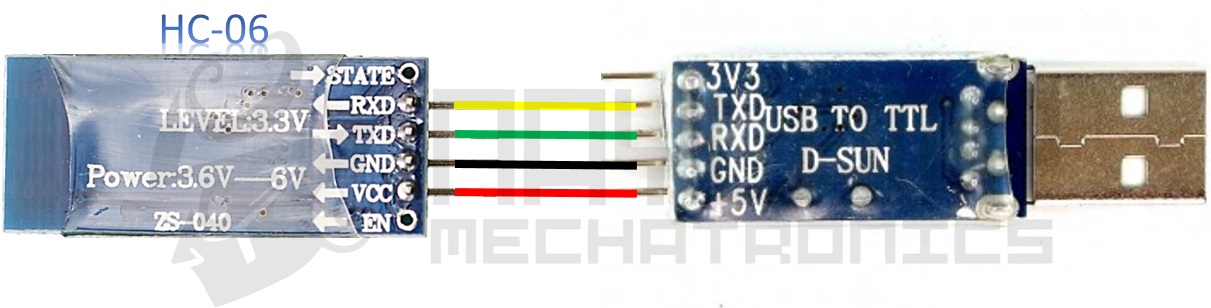
Connect your BT module with the USB - Serial TTL. (Serial configuration 9600 baudrate, No line ending)
    Send: AT
    Response: OK
    Send: AT+NAME<device name>
    Response: OKsetname
    Send: AT+PIN<4 digit code>
    Response: OK<Any 4 digit code>
Baud Rates(1:1200, 2:2400, 3:4800, 4:9600, 5:19200, 6:38400, 7:57600, 8:115200, 9:230400, A:460800, B:921600, C:1382400)
    Send: AT+BAUD8          (115200 Baud Rate)
    Response: OK<baud rate>
Connect your BT module with the USB - Serial TTL. (Serial configuration 38400 baudrate, Both NL & CR)
The module has a button, this must be pressed when connecting to enable the function to configure it with the AT commands, so I recommend that you put a clip to make it easier.

Leave the HC06 connected when configuring the HC05 since we need to pair the two devices
    Send: AT
    Response: OK
    Send: AT+RMAAD
    Response: OK
    Send: AT+ROLE=1
    Response: OK
    Send: AT+RESET
    Response: OK
    Send: AT+CMODE=0
    Response: OK
    Send: AT+INQM=0,5,9
    Response: OK
    Send: AT+INIT
    Response: OK
    Send: AT+INQ
    Response:
    +INQ:AA1:BBB:CCC,XXXXX,XXXX
    +INQ:AA2:BBB:CCC,XXXXX,XXXX
    +INQ:AA3:BBB:CCC,XXXXX,XXXX
    // Use the following command with all the BT addresses you get until
    // you find HC 06, Example if AA1: BBB: CCC is the correct address.
    Send: AT+RNAME?AA1,BBB,CCC
    Response: +RNAME:<device name>
    Send: AT+PAIR=AA1,BBB,CCC,9
    Response: OK
    Send: AT+BIND=AA1,BBB,CCC
    Response: OK
    Send: AT+CMODE=1
    Response: OK
    Send: AT+LINK=AA1,BBB,CCC
    Response: OK
Now that the connection has been formed, the HC-05 will automatically connect to the HC-06 every time they are turned on.
To install the Azure CLI you need to follow the following tutorial according to your OS.
Enter the following command to get the Azure IoT extension
az extension add --name azure-cli-iot-ext
After that log in to your azure account.
az login
Once this is finished we can check that the data is being sent well to Azure IoT Hub. Run the following command replacing HUBNAME and DEVICEID with your data.
az iot hub monitor-events --hub-name HUBNAME --device-id DEVICEID
We are receiving in the payload the heart rate every 10 seconds as we set it in the Arduino code.

To send the data, what I did was a process of saving, processing and sending the data "Manually", however, in the end I will show how everything can be automated through a MACRO.
- The first step is to execute the following command, this command will save all the information received by Azure CLI in a file.
az iot hub monitor-events --hub-name HUBNAME --device-id DEVICEID> datain.txt
- Since we are receiving the data every 10 seconds, we will only have to wait 10 seconds to execute the command before stopping it with CTRL + C, inside the datain.txt file, we can find the received data.

For the subsequent processing of the data we must configure the CloudMQTT credentials that we will use to send the data received from the CLI.
- Create an account in Cloud MQTT.
- Copy the credentials of "Server", "User", "Password" and "Port".

Within the python code we will change the following parameters for our credentials.
 client.username_pw_set ("USER", "PASSWORD")
 client.connect ("SERVER", PORT)
Once we have the data there, we must execute the Exe.py program in the "Python Code" folder, this will process the data and send it to the CloudMQTT with the topic "/ Azure"
Node Red is a tool for NodeJS where we can integrate services easily, without code and, of course, create excellent dashboards.
NodeJS installation guide: https://www.guru99.com/download-install-node-js.html
NodeRED installation guide: https://nodered.org/docs/getting-started/windows
NodeRED installation guide: https://flows.nodered.org/node/node-red-dashboard
The file "flows.json" in the folder "Node-RED Flow", has all the information to import the flow into your NodeRED.


Once that is done we will edit the MQTT node to enter our credentials.

Set Server and Port.

Set User and Password.

If everything works fine press the "Deploy" button and enter the following URL to check the Dashboard.
If we execute the Exe.py file, we will see how the data appears on the Dashboard.

To Automate everything, create a macro with a program called "Mouse Recorder Premium", the macro of that program is in the "Macro File" folder.
In this part of the macro we must change for our values, so that it works.

The interface:

Holter Monitor:


Azure Sphere:


Video: Click on the image
Sorry github does not allow embed videos.
inventa algo
Links


